Police Interventions – Statistics and Trends
From 2017 to 2019, the RCMP entered an average of 2.93 million occurrences per year into RCMP records management systems.
Over this time period, each year there were on average 2,215 encounters involving reportable applications of police interventionFootnote1. Applications of police intervention account for 0.08% of the total number of RCMP occurrences, or one encounter involving police intervention for every 1322 occurrences. This indicates that approximately 99.9% of RCMP encounters are resolved naturally or successfully de-escalated by officers without the need for police intervention.
Application of Police Intervention Occurrence Rate
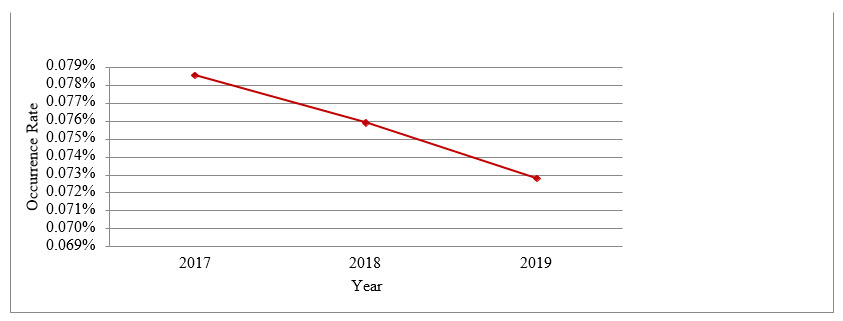
Image Description
Application of Police Intervention Occurrence Rate

Image Description
Officer Response Utilized |
Deployment Type |
|
Year |
|
|
|---|---|---|---|---|---|
2017 |
2018 |
2019 |
Total |
||
Count |
Count |
Count |
Count |
||
Physical Control - Soft |
Pressure Points |
20 |
11 |
12 |
43 189 |
Physical Control - Hard |
Stuns/Strikes |
649 |
707 |
718 |
2074 |
Oc Spray |
Draw And Display |
9 |
4 |
8 |
21 |
Conducted Energy Weapon |
Laser Sight Activated |
119 |
89 |
109 |
317 |
Baton |
Draw And Display |
14 |
16 |
12 |
42 |
Extended Range Impact Weapon |
Draw And Display |
2 |
19 |
8 28 |
29 |
Speciality Munitions |
|
25 |
44 |
48 |
117 |
Police Firearm |
Draw And Display Pointed At Subject |
1001 |
908 |
1153 |
3062 |
Other |
|
35 |
48 |
50 |
133 |
Police Service Dog |
Presence Only |
141 |
169 |
194 |
504 |
Note: Occurrences can involve more than one intervention options/methods (i.e., multiple officer using interventions options/methods or one officer using multiple intervention options/methods). Physical control soft is only required to be reported when it resulted in an injury to the subject or the officer; however, some officers opt to report it without injury to demonstrate an (de-)escalation in force. This table excludes officer-involved shootings, which are reported separately on the following page.
Officer-Involved Shootings
From 2017 to 2019, RCMP officers were involved in 99 officer-involved shootings (an average of 33 per year), of which 26 (an average of nine per year) resulted in the death of the subjectFootnote2.
From 2017 to 2019, RCMP officers discharged a firearm in 0.001 per cent of RCMP occurrences — or one in approximately 89,000 occurrences.
From 2017 to 2019, RCMP officers discharged a firearm resulting in a fatality, in 0.0003 per cent of RCMP occurrences — or one in approximately 338,000 occurrences.
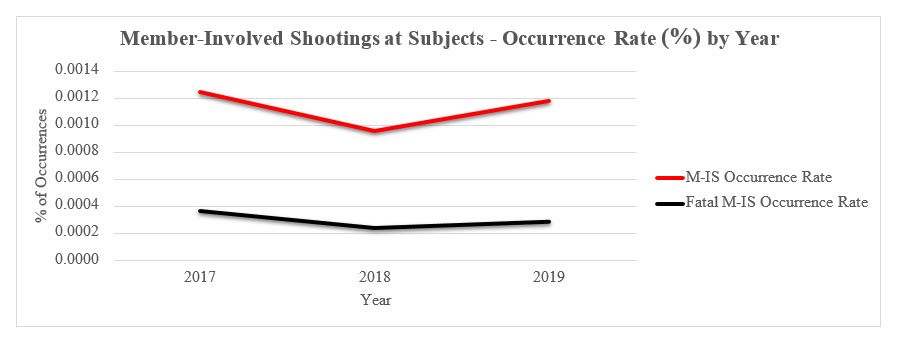
Image Description
Member-Involved Shootings at Subjects - Occurrence Rate
Footnotes
- Date modified: