Community Safety Placemat
Key trends and drivers
- The volume and severity of police-reported crime in Canada was up in 2023, continuing an upward trend since 2014.
- Despite a small decline in 2023 (-1.7%), the rate of firearm-related violent crime was 22% higher compared to 2018 and 55% higher compared to 2013, while overall violent crime was 25% higher since 2018 and 30% higher since 2013.
- Canadians report having a good or great deal of confidence in police (62%), but have lower levels of satisfaction with the justice system and courts (46%), federal parliament (32%), and media (32%) (Statistics Canada).
- Indigenous people are overrepresented in Canada's criminal justice system; 50% of all women behind bars are Indigenous while the rate of violent victimization among Indigenous people was more than double that of non-Indigenous people (163 incidents per 1,000 people vs. 74 incidents per 1,000 people).
Police-reported crime rates in Canada, 1963 to 2023
(per 100,000 population) - Data sourced from Statistics Canada (07-25-2024)
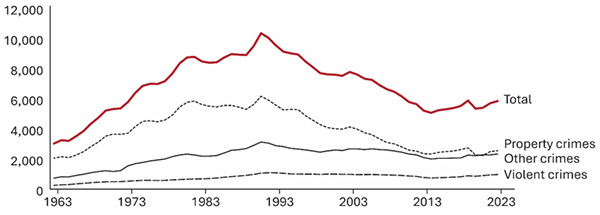
Image description
The graph depicts police-reported crimes in Canada from 1963 to 2023 per 100,000 population. There are 4 lines on the graph, a dashed line labelled "Violent Crimes", a solid line labelled "Other Crimes", a dotted line labelled "Property Crimes" and a red solid line labelled "Total". The vertical axis begins with 0 to 12,000, in increments of 2,000. The horizontal axis lists the years 1963 to 2023 in increments of ten years. In the graph, the "Violent Crimes" line begins in 1963 at close to 0 and rises steadily in 2023. The "Other Crimes" line begins in 1963 with 700 crimes, rises steadily in 1993 to 2,500 crimes and drops in 2023 to 1,500 crimes. The "Property Crimes" line begins in 1962 with 2,000 crimes, steadily rises in 1993 to 5,000 crimes and drops im 2023 to 2,000. The "Total" line begins in 1963 at 3,000 crimes, steadily rises in 1983 to 8,000, peaks in 1993 with 11,000, and steadily drops to 6,000 in 2023. Figures are per 100,000 approximate, all data is approximate.
What's working
- Early intervention to address factors that lead to criminal behaviour are proven to be effective, result in safer communities and reduce costs of the criminal justice system.
- Strengthening border and immigration security through increased investment and domestic and international collaboration.
- Collaboration between Canada's policing services to respond to emergencies and share information to tackle crime.
- Whole-of-government approaches and strong FPT engagement to respond to community safety challenges (i.e., Canadian Drugs and Substances Strategy, National Strategy to Combat Human Trafficking, etc.).
Challenges and opportunities
- Crime prevention approaches are characterized by a multijurisdictional patchwork system with significant resource and operational challenges.
- Growing social factors increase risks of criminal behaviour (i.e., poverty, food insecurity, education, employment, housing, health and mental-health care). Many of these are under provincial and territorial responsibility.
- Growing complexity of crime requires greater integration and collaboration between national security and intelligence and law enforcement.
- Rising costs, increasing demand for service and growing vacancies are impacting the current RCMP policing structure, focused attention is required to bolster federal policing capacity (sole federal responsibility).
- RCMP policing contracts will expire in 2032, offering an opportunity to redefine the future federal role and level of support to front-line police service delivery.
- [REDACTED]
- Date modified: