Corporate Risk Profile 2019-2020
- INTRODUCTION
- OPERATING CONTEXT
- DEPARTMENTAL PRIORITIES
- DEPARTMENTAL RISK PROFILE
- DEPARTMENTAL RISK 1
- DEPARTMENTAL RISK 2
- DEPARTMENTAL RISK 3
- DEPARTMENTAL RISK 4
- APPENDIX A: RISK RANKING SCALES
- APPENDIX B: RESIDUAL RISKS ASSESSMENT
Risk refers to the effect of uncertainty on objectives. It is the expression of the likelihood and impact of an event can have on the achievement of objectives.
INTRODUCTION
The Corporate Risk Profile (CRP) identifies Public Safety Canada’s (PS) key corporate risks. It describes the Department’s operational context and its objectives with respect to addressing these risks, which include the current controls in place. Given that existing controls are not always sufficient to mitigate the impact of certain risks, additional mitigation strategies have been identified to focus efforts on mitigating residual risk to a manageable level. Stemming from an organizational risk process, the CRP provides critical information regarding the risk environment which in turn enhances the organization’s ability to set priorities, allocate resources, make informed decisions, and improve performance outcomes.
The CRP, along with the Integrated Risk Management Framework and the Policy on Risk provide the governance, process and accountabilities linked to Enterprise Risk Management at Public Safety.
Our mission is to build a safe and resilient Canada. Public Safety Canada’s mandate is to keep Canadians safe from a range of risks such as natural disasters, crime and terrorism.
OPERATING CONTEXT
PS plays a key role, via its 12 programs (see Fig. 1), in the development, coordination and implementation of policies and programs to strengthen national security, community safety and emergency management in Canada. Operating in a dynamic environment, PS must exercise a high level of awareness, engagement, and adaptability to deliver on its mandate, maintain a cohesive and coordinated approach to safety and security, and generate results for Canadians while managing a variety of risks. Canada faces numerous public safety challenges, including cyber threats, terrorism, organized crime and natural disasters. Partnerships with a wide variety of stakeholders are essential to the effective development of policies and delivery of programs.
Terrorist threats and incidents have emphasized the importance of Canada’s continued vigilance, including countering efforts towards radicalization to violence. The Department and its partners increasingly collaborate to strengthen and coordinate initiatives across the country to address national security threats.
Organized crime groups are sophisticated, adaptable, and transnational in nature. The Department strives to prevent criminality while also helping to combat crimes such as human trafficking, child sexual exploitation, illicit drug trafficking, and gun violence.
The increasing occurrence and complexity of natural disasters and extreme weather events linked to climate change are affecting Canada and resulting in greater damages and expenses. Addressing this trend requires the collaboration of federal, provincial, territorial and municipal partners, as well as Indigenous peoples, to increase communities’ resilience and to better mitigate, respond to and recover from emergencies.
Figure 1
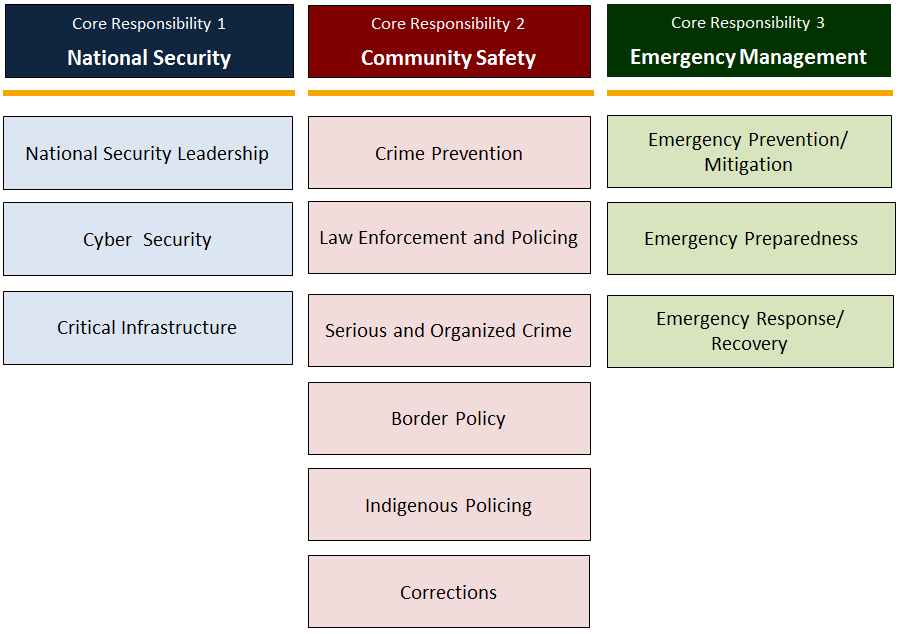
Image Description
This graphic depicts Public Safety Canada’s program inventory by core responsibility. Core Responsibility #1 is National Security, Core Responsibility #2 is Community Safety and Core Responsibility #3 is Emergency Management. The programs in the Program Inventory under the Core Responsibility of National Security are National Security Leadership, Critical Infrastructure and Cyber Security. The programs in the Program Inventory under the Core Responsibility of Community Safety are Crime Prevention, Law Enforcement and Policing, Serious and Organized Crime, Border Policy, Indigenous Policing, and Corrections. The programs in the Program Inventory under the Core Responsibility of Emergency Management are Emergency Prevention/Mitigation, Emergency Preparedness, and Emergency Response/Recovery.
DEPARTMENTAL PRIORITIES
Every year, PS identifies the priorities on which to focus its attention and resources. Departmental priorities are established in relation to ministerial mandate priorities as well as in relation to critical events, the Department’s operating environment, and the risks PS faces.
P1 |
Advance the federal government’s efforts in protecting Canadians and Canada’s critical infrastructure from cyber threats and cybercrime. |
P2 |
Continue to advance countering radicalization to violence and counter-terrorism efforts with all levels of government, internal partners, and other stakeholders. |
P3 |
Strengthen community resilience to emergencies in collaboration with provinces and territories, Indigenous communities and municipalities. |
P4 |
Increase the efficiency and effectiveness of community safety, with a focus on at-risk and vulnerable populations, including Indigenous peoples, as well as those with mental health issues in the criminal justice system. |
P5 |
Continue to strengthen an ethical and values-based departmental culture focused on respect and people-centered practices, mental health, and workplace wellness. |
P6 |
Ensure a strong focus on results through effective performance measurement and sound management practices. |
DEPARTMENTAL RISK PROFILE
Key risks
Residual risks can impact the Department’s ability to meet its outcomes despite related mitigation measures and controls in place. It has been determined through analysis and engagement that the following four risks require additional measures and controls to decrease the likelihood of occurrence and potential impact. (See Appendix A for details on risk ranking.)
| RISK STATEMENT | LIKELIHOOD |
IMPACT |
RESIDUAL RISK |
|---|---|---|---|
1. There is a risk that some program outcomes relying on the actions of partners will not be met |
4.00 |
5.25 |
High |
2. There is a risk that Public Safety will be unable to keep pace with and take advantage of technological advances. |
4.75 |
4.75 |
High |
3. There is a risk that the Department may not respond effectively to the pace and magnitude of change in the evolving all-hazards threat environment. |
5.25 |
5.5 |
High |
4. There is a risk that the Department will not attract and retain the employees required to achieve its organizational objectives. |
5.25 |
5.5 |
High |
Key risks heat map
The risk heat map represents the results of the risk assessment process, which involved evaluating the likelihood of residual risks materializing and the potential impact were they to materialize. All four residual risks fall within the high-risk zone. (For more details on the heat map ratings, see Appendix B.)

Image Description
This diagram depicts a 6-by-6 square colour-coded risk heat map. It consists of a square sub-divided into 36 equal but small squares. The Y-axis on the left of the large square denotes the ‘Residual Risk Impact’. The scale along the Y-axis ranges from 1 to 6 from bottom to top. The x-axis denotes the ‘Residual Risk Likelihood’ along the bottom of the large square. The x-axis ranges from 1 to 6, going from left to right. The 36 sub-divided boxes are colour-coded with green, yellow and red colours. The square transitions from green on the bottom-left to red on the top-right with yellow stretching diagonally across the middle.
On the risk heat map are four numbered black dots. The numbers on them range from 1 to 4 and represent the top four departmental risks. The black dot with a number 1 in it (denoting key risk #1) can be found in the square denoting a likelihood of 4.00 and an impact of 5.25. The black dot with a number 2 in it (denoting key risk #2) can be found in the square denoting a likelihood of 4.75 and an impact of 4.75. The black dot with a number 3 in it (denoting key risk #3) can be found in the square denoting a likelihood of 5.25 and an impact of 5.5. The black dot with a number 4 in it (denoting key risk #4) can be found in the square denoting a likelihood of 5.25 and an impact of 5.5. This correlates to a residual risk of “High”.
DEPARTMENTAL RISK 1
Risk Statement |
THERE IS A RISK THAT SOME PROGRAM OUTCOMES RELYING ON THE ACTIONS OF PARTNERS WILL NOT BE MET |
Risk Owner |
NCSB, CSCCB, EMPB, PACB |
Corporate Priorities |
|
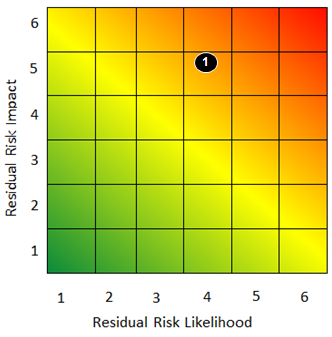
Image Description
This diagram depicts a 6-by-6 square colour-coded risk heat map. It consists of a square sub-divided into 36 equal but small squares. The Y-axis on the left of the large square denotes the ‘Residual Risk Impact’. The scale along the Y-axis ranges from 1 to 6 from bottom to top. The x-axis denotes the ‘Residual Risk Likelihood’ along the bottom of the large square. The x-axis ranges from 1 to 6, going from left to right. The 36 sub-divided boxes are colour-coded with green, yellow and red colours. The square transitions from green on the bottom-left to red on the top-right with yellow stretching diagonally across the middle.
On the risk heat map is a numbered black dot. The number represents the departmental risk number. A black dot with a number 1 in it (denoting key risk #1) can be found near the square denoting a likelihood of 4.00 and an impact of 5.25. This correlates to a residual risk of “High”.
Risk context
The majority of PS’ programs must forge partnerships in order to implement program initiatives and funding arrangements, meet objectives and achieve outcomes. The need to form partnerships creates a degree of dependence which may render PS vulnerable to the actions of partners whose interests or approaches may not align with its own. In some instances this can be mitigated by engaging with partners whose interests are compatible; however, this may not always be possible given the scope of its partnerships with other government departments and agencies, other levels of government in Canada, foreign governments, the private sector, and non-governmental organizations.
Risk sources
- The challenges in building and maintaining effective partnerships/relationships with portfolio agencies, other governmental departments, provinces, municipalities, non-governmental organizations and special interest groups;
- The reliance on partners and/or stakeholders to deliver federal programs and services;
- The changing domestic and foreign economic and political landscapes;
- Shared responsibilities and coordination between branches, the Department and other jurisdictions;
- Insufficient resources to properly engage with all populations.
Controls
- Communicate strategic priorities, risks and issues to Portfolio agencies;
- Coordinate policy development to ensure alignment among Portfolio agencies;
- Ensure that action plans with partners have clearly identified deliverables, timelines and frameworks that guide and facilitate activities;
- Leverage existing or establish regular reporting mechanisms for early identification of issues and opportunities with partners;
- Maintain and enhance operational coordination and governance mechanisms (i.e., Federal Terrorism Response Plan);
- Hold joint committees and working groups with partner departments, various levels of government and industry leaders to discuss cross-cutting issues and initiatives, and to advance policy priorities (e.g. FPT DMs of Justice and Public Safety, FPT ADM EMC, SOREM, COSPAS-SARSAT, NCSF, MSN, LFD CI Network, FPT CI Working Group, PPAG);Footnote1
- Establish comprehensive contribution funding agreements with partners that include clear expectations, outcomes, and appropriate incentive systems;
- Negotiate and ratify memoranda of agreement with provinces/territories (PT) (e.g., Memorial Grant Program);
- Build relationships with communities, provinces, territories, Indigenous groups, industry and other partners (e.g., through the Canada Centre for Community Engagement and Prevention of Violence, Federal Terrorism Response Plan, the Lead Federal Departments CI Network, the Natural Disaster Mitigation Program);
- Leverage the National Strategy for Critical Infrastructure (CI) and the 2018-2020 Action Plan to strengthen resilience in collaboration with public and private sector partners;
- Engage with allies through established fora;
- Communicate lessons learned from collective response incidents through the Operations Centre Interconnectivity PortalFootnote2 (OCIP).
Impacts
- The Department may be unable to effectively deliver on its mandate;
- There may be a breakdown of relationships and barriers to future strategic collaborations;
- The Department may lose credibility;
- The lives of Canadians may be endangered due to the inability to leverage key partnerships;
- The Department may be in non-compliance with national or international standards, policies and requirements in relation to audit, evaluation and reporting;
- The Department may act in an uncoordinated, ineffective or inefficient manner.
Mitigation strategies and performance measurement
STRATEGY |
ACCOUNTABILITY |
RESOURCES REQUIRED |
TIMELINE |
|---|---|---|---|
1. IMPLEMENTATION PLAN FOR GOC PROCEDURES |
|||
Develop an implementation plan for GOC procedures which is modular and can be fit into specific time periods as they become available (e.g., during incidents). |
EMPB |
Within existing resources |
March 2020 |
Indicator: Implementation plan is in place and will be updated in future years to reflect recommendations from the After Action Report that follows an incident |
Target: baseline TBD in 2020-21 |
||
2. COMMUNITY OF EXERCISE PRACTITIONERS |
|||
Create a community of Critical Infrastructure across CI sector and cyber security exercise practitioners. |
NCSB |
Within existing resources |
August 2019 |
Indicator: Number of stakeholder engagement meetings or events held by Critical Infrastructure and Strategic Coordination Directorate |
Target: 1 |
||
3. NCSS HORIZONTAL INITIATIVE FRAMEWORK |
|||
Complete the Horizontal Initiative Framework that both lists and tracks the performance measurement criteria of every initiative stemming from the National Cyber Security Strategy (NCSS) to provide a coordinated and transparent launch. |
NCSB |
Within existing resources |
March 2019 |
Indicator: Percentage of funded initiatives that achieve their performance targets |
Target: 80% |
||
4. CONTRIBUTION AGREEMENTS TO FUND ENFORCEMENT OF DID LEGISLATION |
|||
Enter into contribution agreements with provinces and territories in order to provide funding to law enforcement to build and enhance capacity to enforce new drug-impaired driving (DID) legislation. |
CSCCB |
Within existing resources |
October 2019 |
Indicator: Percentage of contribution agreements signed by provinces and territories |
Target: 100% |
||
Indicator: Percentage of deliverables that achieved established outcomes identified in the contribution agreements |
Target: 80% |
||
5. STRATEGIC PS / PT EMS ACTION PLAN |
|||
Establish an FPT Emergency Management Strategy (EMS) working group to begin to develop a FPT action plan, to advance the priorities outlined in the FPT EMS (approved in January 2019). |
EMPB |
Existing Resources |
Next FPT Ministerial Meeting (2020-TBD) |
Indicator: The presentation of the progress report |
Target: 2020 Month TBD |
||
DEPARTMENTAL RISK 2
Risk Statement |
THERE IS A RISK THAT PUBLIC SAFETY WILL BE UNABLE TO KEEP PACE WITH AND TAKE ADVANTAGE OF TECHNOLOGICAL ADVANCES |
Risk Owner |
CMB |
Corporate Priorities |
|

Image Description
This diagram depicts a 6-by-6 square colour-coded risk heat map. It consists of a square sub-divided into 36 equal but small squares. The Y-axis on the left of the large square denotes the ‘Residual Risk Impact’. The scale along the Y-axis ranges from 1 to 6 from bottom to top. The x-axis denotes the ‘Residual Risk Likelihood’ along the bottom of the large square. The x-axis ranges from 1 to 6, going from left to right. The 36 sub-divided boxes are colour-coded with green, yellow and red colours. The square transitions from green on the bottom-left to red on the top-right with yellow stretching diagonally across the middle.
On the risk heat map is a numbered black dot. The number represents the departmental risk number. A black dot with a number 2 in it (denoting key risk #2) can be found near the square denoting a likelihood of 4.75 and an impact of 4.75. This correlates to a residual risk of “High”.
Risk context
With the increased rate of technological advances, it is imperative that PS keep pace with developments to enable the Department to effectively support Public Safety staff, interact with partners and stakeholders and improve business processes that are vulnerable to disruption. Ensuring that PS remains current with technological advances also bolsters the Department’s ability to fulfill its role as emergency response coordinator.
Risk sources
- Challenges with connectivity;
- The need to remain current with the latest technological advances;
- Difficulties in interfacing and data sharing with partners and stakeholders;
- Managing the centralization of IM/IT services;
- Multiple jurisdictions holding responsibility for PS communications initiatives and, therefore, multiple systems at play;
- Challenges recruiting and retaining employees with specialized skillsets;
- Outdated systems, such as the Departmental Financial Management System (DFMS), which is currently lagging behind other government departments’ financial systems (i.e., e-invoice processing, business intelligence, reporting, data quality, etc.);
- Too few resources being assigned to PS’ grants and contributions system (PSIMS) to implement systems updates in a timely manner.
Controls
- Maintain and update critical systems regularly;
- Monitor new technologies and approaches;
- Acquire technology to increase existing capacity and interoperability with key partners (e.g., GOC Modernization Project);
- Maintain an information management and technology-focused working group to discuss new technological solutions to process-oriented problems (e.g., Grants and Contributions);
- Regularly engage business partners on information management and technology to discuss digital solutions to process-oriented problems;
- Ensure adequate training is provided on new technology and security of information (e.g., for protocols pertaining to PS’ G&Cs system (PSIMS)).
Impacts
- The Department may be unable to deliver in a timely way on mandate commitments;
- The response to emergency and public safety events may be slowed or hindered, resulting in economic damage and loss of life;
- Employees and partners may not be aware of emerging threats or have access to appropriate and modern technology/tools to carry out responsibilities;
- Key partnerships may deteriorate;
- Canadians may be unaware of and, therefore, may not use available services;
- The Department may lack the information to make timely and evidence-based decisions.
Mitigation strategies and performance measurement
STRATEGY |
ACCOUNTABILITY |
RESOURCES REQUIRED |
TIMELINE |
|---|---|---|---|
1. IMPLEMENTATION OF A BUSINESS INTELLIGENCE SOLUTION |
|||
Implement a business intelligence solution to provide direct access to Gs&Cs datasets by means of a user friendly interface, and allow employees and senior management to organize and report on real-time data |
EMPB |
Within existing resources |
March 31, 2020 |
Indicator: Percentage of EMPB FTEs that have been trained on the business intelligence solution |
Target: 10% |
||
2. WINDOWS 10 MIGRATION |
|||
Migrate all operating systems to Windows 10 and introduce new associated tools and technologies. |
CMB |
Additional resources required: TBD |
Fall 2019 |
Indicator: Percentage of operating systems that are migrated to Windows 10 |
Target: 100% |
||
3. REGIONAL OFFICES BOARDROOMS |
|||
Improve regional boardrooms (ongoing, resources contingent) via installation of audio-visual equipment. |
CMB |
Within existing resources |
Summer 2019 |
Indicator: Number of boardroom retrofits that were completed |
Target: 9 |
||
4. REGIONAL OFFICES BANDWIDTH |
|||
Improve regional office connectivity (bandwidth) via installation of additional IT equipment. |
CMB |
Within existing resources |
Summer 2019 |
Indicator: Number of sites with a network bandwidth of 30 Mbps |
Target: 14 |
||
DEPARTMENTAL RISK 3
Risk Statement |
THERE IS A RISK THAT THE DEPARTMENT MAY NOT RESPOND EFFECTIVELY TO THE PACE AND MAGNITUDE OF CHANGE IN THE EVOLVING ALL-HAZARDS THREAT ENVIRONMENT |
Risk Owner |
NCSB, CSCCB, EMPB |
Corporate Priorities |
|
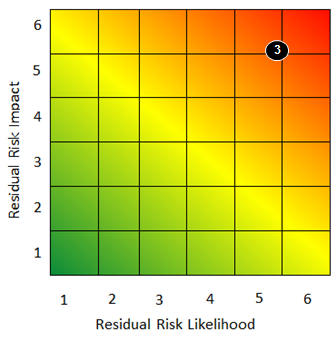
Image Description
This diagram depicts a 6-by-6 square colour-coded risk heat map. It consists of a square sub-divided into 36 equal but small squares. The Y-axis on the left of the large square denotes the ‘Residual Risk Impact’. The scale along the Y-axis ranges from 1 to 6 from bottom to top. The x-axis denotes the ‘Residual Risk Likelihood’ along the bottom of the large square. The x-axis ranges from 1 to 6, going from left to right. The 36 sub-divided boxes are colour-coded with green, yellow and red colours. The square transitions from green on the bottom-left to red on the top-right with yellow stretching diagonally across the middle.
On the risk heat map is a numbered black dot. The number represents the departmental risk number. A black dot with a number 3 in it (denoting key risk #3) can be found near the square denoting a likelihood of 5.25 and an impact of 5. 5. This correlates to a residual risk of “High”.
Risk context
An all-hazards threat environment encompasses natural and human activity that may cause death or injury, property damage, social and economic disruption and environmental degradation. The likelihood of the occurrence of and the frequency of events - including extreme weather phenomena like wild fires, flooding and tornados - not to mention their impact, are increasing thereby increasing the risk to national security and community safety, and creating a strain on emergency management. All-hazards threats also include rapidly evolving and often sensitive events that present a threat to Canadians, critical infrastructure, cyber systems and national security. PS develops policy, legislation and programs to support Canada’s capacity to respond to this broad range of threats. It provides national coordination and leadership to partners and stakeholders, and works to strengthen preparedness and Canada’s ability to prevent, mitigate, respond and recover from all-hazards events.
Risk sources
- The complexity of cyber security;
- Extreme weather events due to climate change;
- Man-made environmental disasters;
- Urbanization and critical infrastructure interdependencies;
- Evolving security risks;
- Geopolitical developments; and
- The interconnected nature of global supply chains.
Controls
- Conduct regular environmental scans;
- Follow procedures, use thorough planning and risk assessment processes for responding to threats;
- Maintain and enhance policy and operational coordination and governance mechanisms (i.e., Departmental Continuity Management Plan, Building Emergency Response Plans);
- Support funding and engagement with partners to enhance crime prevention, and border and law enforcement activities related to serious and organized crime;
- Engage with the security and intelligence community to remain apprised of main terrorist and violent extremist threats facing Canada;
- Engage with international partners and technology companies to ensure online radicalization to violence is understood and effectively addressed;
- Conduct site assessments of CI facilities as part of the Regional Resilience Assessment Program (RRAP) to identify vulnerabilities and inform CI owners and operators of measures to enhance the resilience of their facilities;
- Develop and share analytic products as part of the Virtual Risk Analysis Cell (VRAC) Program and produce impact assessments on disruptions to CI;
- Provide hands-on training to Industrial Control System (ICS) experts through the Cyber Engagement Program Symposium, exercises and workshops;
- Implement GOC training plans to ensure that employees have the knowledge and expertise to carry out responsibilities;
- Collaborate with domestic partners in order to leverage existing expertise in the cyber realm.
Impacts
- The Department may not be able to deliver on its mandate;
- The Department may lose credibility;
- The Department may be unable to provide an effective response to disasters and recovery efforts;
- The Department may be unable to render appropriate decisions.
Mitigation strategies and performance measurement
STRATEGY |
ACCOUNTABILITY |
RESOURCES REQUIRED |
TIMELINE |
|---|---|---|---|
1. FPT EM ACTION PLAN |
|||
Develop a FPT action plan to implement the five priority areas of the Emergency Management Strategy for CanadaFootnote3. |
EMPB |
Within existing resources |
2021-22 |
Indicator:The action plan is presented to FPT Ministers responsible for Emergency Management |
TBD |
||
2. GOC MODERNIZATION REVIEW RECOMMENDATIONS |
|||
Implement GOC Modernization review recommendations to improve the Federal Emergency Management Community’s capacity to respond to all-hazards events of national interest. |
EMPB |
Within existing resources but additional resources may be required (TBD) |
March 2022 |
Indicator: Percentage of GOC Modernization recommendations addressed |
28% by 2019-20 44% by 2020-21 56% by 2021-22Footnote4 |
||
3. NETWORK VULNERABILITY ASSESSMENT TOOL |
|||
Pilot a network vulnerability assessment tool to assess network vulnerabilities as part of the RRAP non-technical cyber security assessments. |
NCSB |
Within existing resources |
July 2019 |
Indicator: Percentage of vulnerabilities identified in a network assessment addressed through the one-year follow-up |
Target: 60% |
||
4. ANALYTICAL CAPACITY TOOLS |
|||
Evaluate two toolsFootnote5 to build analytical capacity and better understand the interdependencies of CI sectors. These tools are designed for the purpose of modeling infrastructure interdependencies and associated risk. |
NCSB |
Within existing resources |
Spring 2019 |
Indicator: Evaluation of functional tools that can be hosted on the Critical Infrastructure Gateway |
Target: Complete and present evaluation results |
||
5. FUNDING AGREEMENTS |
|||
Establish provincial and territorial funding agreements which outline eligible activities to which funding can be applied by recipients in support of activities to combat gun and gang violence in Canada. |
CSCCB |
[Redacted] |
December 2019 |
Indicator: Percentage of contribution agreements signed by provinces and territories |
Target: 95% |
||
6. NATIONAL STRATEGY |
|||
Develop a national strategy to combat gun and gang violence in collaboration with federal, provincial and territorial partners and key stakeholders. |
CSCCB |
[Redacted] |
March 2020 |
Indicator: Number of meetings held with federal, provincial and territorial partners and key stakeholders on the gun and gang violence strategy |
Target: 5 |
||
DEPARTMENTAL RISK 4
Risk Statement |
THERE IS A RISK THAT THE DEPARTMENT WILL NOT ATTRACT AND RETAIN THE EMPLOYEES REQUIRED TO ACHIEVE ITS ORGANIZATIONAL OBJECTIVES |
Risk Owner |
NCSB, CSCCB, EMPB, PACB, CMB |
Corporate Priorities |
|
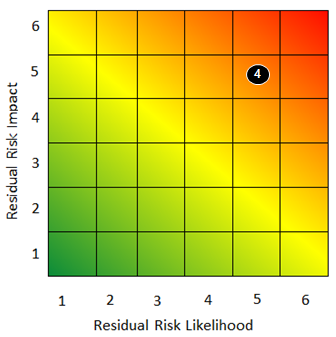
Image Description
This diagram depicts a 6-by-6 square colour-coded risk heat map. It consists of a square sub-divided into 36 equal but small squares. The Y-axis on the left of the large square denotes the ‘Residual Risk Impact’. The scale along the Y-axis ranges from 1 to 6 from bottom to top. The x-axis denotes the ‘Residual Risk Likelihood’ along the bottom of the large square. The x-axis ranges from 1 to 6, going from left to right. The 36 sub-divided boxes are colour-coded with green, yellow and red colours. The square transitions from green on the bottom-left to red on the top-right with yellow stretching diagonally across the middle.
On the risk heat map is a numbered black dot. The number represents the departmental risk number. A black dot with a number 4 in it (denoting key risk #4) can be found near the square denoting a likelihood of 5.25 and an impact of 5. 5. This correlates to a residual risk of “High”.
Risk context
PS competes against other government departments and agencies as well as the private sector to attract competent, skilled and knowledgeable individuals to carry out the work performed by the Department. The challenge of retaining the right individuals is further compounded by the fact that employees are changing jobs on a frequent basis. The vacancies that are created and a young/new workforce may hamper the Department’s ability to deliver on its mandate.
Risk sources
- Increasing mobility of employees due to a rise in work opportunities across the Public Service and the Canadian economy;
- Hiring practices and long hiring processes;
- An aging population and more individuals exiting the workforce;
- Rapid globalization and technological changes leading to the changing nature of work;
- A shortage of certain employees, such as financial and IT officers, which causes significant turnover/movement of employees;
- The complexity of cyber security and its associated skills and responsibilities.
Controls
- Assist managers with staffing needs by maintaining a talent mobility inventory of current PS employees, encouraging internal promotions, and bridging qualified candidates;
- Develop a strategic approach to attract and retain employees by holding a monthly ADM/DG/director meeting to review the human resource situation;
- Implement human resources retention and recruitment plans/strategies;
- Offer information sessions on staffing options to executives and managers;
- Implement a PS Talent Management Strategy, for effective application of integrated human management practices;
- Participate in career fairs as well as diversity events within and outside of the NCR throughout the year to promote the Department as an employer of choice and to recruit talented individuals;
- Pilot on-the-spot conditional offers and use them as a recruitment option for interested managers;
- Implement initiatives focused on staff satisfaction, mental health and workplace wellness (e.g., Staffing Task Force, Culture Connect, the Respect Campaign, Mental Health Days and Weeks, and the Positive Space Pilot);
- Provide employee assistance services and informal conflict management to support employees and encourage early resolution of conflict.
Impacts
- The Department may not be able to deliver on its mandate;
- The Department may lose credibility;
- PS partnerships may erode;
- The Department may be unable to provide an effective response during natural disasters and recovery efforts; and
- The Department may be unable to render timely, well-informed decisions.
Mitigation strategies and performance measurement
STRATEGY |
ACCOUNTABILITY |
RESOURCES REQUIRED |
TIMELINE |
|---|---|---|---|
1. STAFFING SOLUTIONS TASK FORCE WORKING GROUPS |
|||
Establish working groups to engage employees in exploring options to advance efforts in recruitment, staffing and retention. These options include the creation of an ombudsperson for the Department, exploration of development programs, and review of the exit interview process as part of our efforts to continue to enhance the workplace and increase retention. |
CMB |
TBD based on outcomes of the working groups |
2019-20 |
Indicator: Percentage of employees who respond in affirmation to the statement: I would recommend my department or agency as a great place to work (PSES) |
Target: ≥54% |
||
Indicator: Percentage of employees who respond in affirmation to the statement: Do you intend to leave your current position in the next two years? (PSES) |
Target: ≤51% |
||
2. PSYCHOLOGICAL-HAZARD ASSESSMENT |
|||
Complete the first psychological-hazard assessmentFootnote6, including the analysis of resultsFootnote7. |
CMB |
Within existing resources |
March 2020 |
Indicator: Percentage of employees who respond affirmatively to the statement: I would describe my workplace as being psychologically healthy (PSES) |
Target: ≥71% |
||
APPENDIX A: RISK RANKING SCALES
The following scales are used to assess the likelihood and the impact of any given risk.
Risk Ranking Scale ― LIKELIHOOD
Risk Ranking Scale ― IMPACT
APPENDIX B: RESIDUAL RISKS ASSESSMENT
A risk heat map is a tool used to visually represent the results of a risk assessment process in a meaningful and concise way. It involves evaluating the likelihood and potential impact of identified risks.
Risk heat map
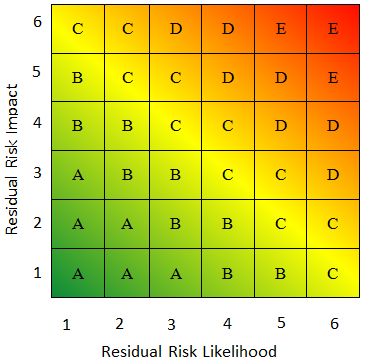
Image Description
This diagram depicts a 6-by-6 square colour-coded risk heat map. It consists of a square sub-divided into 36 equal but small squares. The Y-axis on the left of the large square denotes the ‘Residual Risk Impact’. The scale along the Y-axis ranges from 1 to 6 from bottom to top. The x-axis denotes the ‘Residual Risk Likelihood’ along the bottom of the large square. The x-axis ranges from 1 to 6, going from left to right. The 36 sub-divided boxes are labeled from ‘A’ to ‘E’ and are colour-coded with green, yellow and red colours. The square transitions from green on the bottom-left to red on the top-right with yellow stretching diagonally across the middle. ‘A’ signifies a risk worth accepting. ‘B’ signifies a risk worth accepting with monitoring. ‘C’ signifies that management effort is worthwhile. ‘D’ signifies that considerable management is required. ‘E’ signifies that extensive management is essential. The squares transition from ‘A’ on the bottom-left all the way to ‘E’ on the top-right.
Row 1 (starting at the bottom) of the squares is labeled, from left to right: A, A, A, B, B, C.
Row 2 of the squares is labeled, from left to right: A, A, B, B, C, C.
Row 3 of the squares is labeled, from left to right: A, B, B, C, C, D.
Row 4 of the square is labeled, from left to right: B, B, C, C, D, D.
Row 5 of the square is labeled, from left to right: B, C, C, D, D, E.
Row 6 of the square is labeled, from left to right: C, C, D, D, E, E.
A – Risk worth accepting
B – Risk worth accepting with monitoring
C – Management effort worthwhile
D – Considerable management required
E – Extensive management essential
Footnotes
- 1
FPT DMs of Justice and Public Safety, FPT ADM Emergency Management Committee, National Cross Sector Forum, Multi-sector Network, Large Federal Departments Critical Infrastructure (CI) Network, FPT CI Working Group, Passenger Protect Advisory Group
- 2
OCIP is hosted on government servers outside the PS network and is used by regional offices and federal partners.
- 3
The Strategy, approved in January 2019, provides a roadmap to strengthen Canada's ability to better prevent, prepare for, respond to, and recover from disasters.
- 4
This target reflect annual objectives for the years preceding 2021-22
- 5
One is an emergency management (EM) interdependency model that simulates the cascading effects of a disruption on infrastructure interdependencies within the 72-hour EM cycle (DOMINO). The other aims to extrapolate the future risk and costs associated with climate change scenarios and the likelihood of increased environmental hazards (XDI Systems).
- 6
The initial phase of the first psychological hazard assessment was completed in early 2019 and work is being completed to analyze the results.
- 7
The assessment is an exercise that involves identifying psychological hazards in the work environment and assessing their risk, determining the significance of any identified risks and developing recommendations to control for these risks.
- Date modified: