Evaluating Crime Prevention through Social Development Projects: Handbook for Community Groups

Table of contents
- Introduction
- Module 1: An overview of evaluation Learning objectives
- Module 2: Setting the stage – Preparing a logic model Learning objectives
- Step 1: Identify project goals (outcomes) and who you intend to serve
- Hints for developing project goals
- Goals/Outcomes: Indicating the direction of change
- What's next? Project components, inputs, activities, & outputs
- Splash & ripple
- What is a logic model?
- Why develop a logic model?
- The logic model
- Logic model check list
- Glossary of terms
- References
- Suggested resources
- Module 2 worksheets
- Module 3: Developing an evaluation plan Learning objectives
- What have we got so far?
- What's next?
- What should an evaluation plan include?
- Identifying evaluation questions
- Identifying indicators
- How to choose good indicators
- Some additional considerations when choosing indicators
- Identifying information sources
- Choosing data collection methods
- Deciding whether to sample
- Choosing a sample
- Deciding how many to include in a sample
- Analyzing the results
- Reporting the results
- Glossary of terms
- References
- Suggested resources
- Module 3 worksheets
- Module 4: Data collection methods Learning objectives
- What is "data"?
- Official sources
- Surveys
- Survey tips
- What is wrong with these questions?
- Standardized tests
- Testing tips
- In-depth interviews
- Interview tips
- Focus groups
- Focus group tips
- Observation
- Observation tips
- Multiple methods
- Glossary of terms
- References
- Suggested resources
- Answer key
- Module 4 worksheets
- Module 5: Evaluation designs Learning objectives
- What is evaluation design?
- Levels of evaluation
- Threats to the validity of evaluation results
- Evaluation design
- Design #1: Single group posttest only
- Design #2: Single group pre- and posttest
- Design #3: Comparison group posttest only
- Design #4: Comparison group pretest and posttest
- Design #5: Time-series designs
- A word about comparison groups
- Further words of caution
- Glossary of terms
- References
- Suggested resources
- Answer key
- Module 5 worksheets
- Module 6: Analyzing data/reporting results Learning objectives
- The art of interpreting data
- The science of analyzing data
- Key steps in data analysis
- Analyzing results
- Standardized tests
- Qualitative data
- Reporting your results
- Questions to consider in your report
- Match your presentation style to your audience
- Glossary of terms
- References
- Suggested resources
- Module 6 worksheets
- Module 7: Evaluation challenges and solutions Learning objectives
- Challenge #1: Getting buy-in
- Challenge #2: Participant involvement
- Challenge #3: Data collection
- Challenge #4: Realistic outcomes
- Challenge #5: Data analysis
- Challenge #6: Finding an evaluator
- Challenge #7: Ethical considerations
- Challenge #8: Reflecting community and cultural differences
- What other evaluation challenges come to mind?
- Resources and supports
- Glossary of terms
- References
- Suggested resources
- Module 7 worksheets
- General resource list
- Community/crime prevention resources
Acknowledgements
Evaluating Crime Prevention through Social Development Projects was developed as part of a train-the-trainer program to equip program staff at the National Crime Prevention Centre (NCPC) with the knowledge and resources needed to encourage and enhance the evaluation capacity of community groups involved in crime prevention through social development projects.
The Trainer's Guide and accompanying Handbook for Community Groups were developed by Mary Sehl, Senior Evaluation Analyst, National Crime Prevention Centre. As with most projects, this project could not have happened without the advice and support of many others. Special thanks are due to Colleen Ryan, now with Health Canada, for identifying the need for this initiative and to members of the project's advisory committee for their valuable direction:
- Linda Casson Hare, Senior Program Officer, Yukon
- Susan Howe, Senior Evaluation Analyst, Vancouver
- Dianne MacDonald, Program Manager - Saskatchewan
- Monika Ochnik, Program Officer - Ontario
- Wayne Stryde, Director Program Development and Delivery, Ottawa
- Michelle Woods, Program Officer, Thunder Bay
Special thanks are also due to Brin Sharp, whose training and advice in adult education techniques are reflected throughout the Trainer's Guide, and to Susan Howe for the energy and support she brought to this initiative and for her help in planning and cofacilitating a pilot training session in Vancouver. Her creativity is reflected in many of the exercises used in the training workshops.
Thank you also to all members of the NCPC evaluation unit for their comments and advice on the training package and for the energy they have brought to delivering the training to NCPC program staff. Particular thanks go to Muguette Lemaire, Senior Evaluation Analyst, Montreal, for her extensive help with the French version of the Trainer's Guide and Handbook for Community Groups and to Carolyn Scott for taking a lead role in planning the evaluation of this initiative. Tim Peters, Antoine Bourdages and Wayne Stryde also deserve much appreciation for their direction and ongoing support for this project as members of NCPC's management team.
Mary Sehl
Senior Evaluation Analyst
NCPC
Why evaluation training?
- To encourage and enhance the evaluation capacity of project sponsors
- To provide supports and resources to facilitate evaluation efforts
- To establish processes and benchmarks for the evaluation of funded projects
The National Crime Prevention Centre (NCPC) sees evaluation as a tool for project management and learning. Evaluation is not done simply to prove that a project worked, but also to learn about and improve the way it works.
Community groups interested in applying for NCPC funding to support their crime prevention through social development project will be expected to play different roles in evaluation depending on the stream of funding they receive.
Projects funded through the Crime Prevention Action Fund (CPAF) develop innovative ways to prevent crime. The CPAF helps people working at the ground level undertake activities that deal with the root causes of crime. It aims to build partnerships between sectors such as policing, community health and voluntary and private sectors to enhance community capacity to prevent crime through social development. It helps community groups, to make their crime prevention efforts more sustainable, and to increase public awareness and support for crime prevention activities.
Projects funded under CPAF conduct evaluations to:
- See how the project is doing on a day-to-day basis (on-going monitoring);
- See if the project is on track to meet expected outcomes (results), if it is on time, and if it is using resources as planned mid-way through the project (mid-term evaluation);
- See if the overall changes it was trying to achieve actually happened by the end of the project (final evaluation).
The Policing, Corrections and Communication Fund (PCCF) supports projects where community partners work together to prevent crime primarily through social development. It is intended for law enforcement agencies, community corrections groups/organizations, Aboriginal communities, community-based organizations and the municipalities in which they work.
If you have received or are interested in funding though the Crime Prevention Action Fund, or the Policing, Corrections and Communication Fund , this training will help to improve your ability to develop a sound project plan and to conduct a credible evaluation.
The Research Knowledge and Development Fund (RKDF) supports a range of research activities, demonstration projects, knowledge transfer initiatives and evaluations that identify and analyze gaps in the current body of knowledge related to crime prevention in Canada; create new knowledge in areas where gaps have been identified; synthesize the results of existing research; and contribute to a growing awareness and recognition of promising practices and models for community-based crime prevention. Projects are intended to demonstrate what works and what is promising in reducing the risk factors associated with crime and victimization. Third-party evaluators are hired to conduct rigorous evaluations of these projects in order to identify the costs, benefits, and overall effectiveness of innovative efforts to prevent crime.
Project management and staff will work closely with the third-party evaluator, and in most cases will be involved in the collection of information for the evaluation. If you are interested in the RKDF, this training is an important way to improve your understanding of evaluation and your ability to work with an evaluation contractor.
For more information about NCPC funding programs, see the National Crime Prevention Strategy web site www.publicsafety.gc.ca/ncpc
Organization of this Handbook
This Handbook is organized into seven chapters that correspond to the seven modules of the Crime Prevention through Social Development Evaluation Training package. The end of each chapter provides a glossary of terms used in the chapter and a list of resources relevant to the topics covered. Worksheets used in the training sections are provided at the close of each chapter.
We hope you find the handbook a helpful reference during the training sessions and long after you have completed them. We encourage you to make use of the resources in the resource section of each chapter as you plan evaluations of your crime prevention projects.
Module 1: An overview of evaluation
Learning Objectives
- Understand some of the barriers to community-based evaluations
- Understand how evaluation can improve project management and delivery
- Learn what evaluation is...
- Major approaches
- Basic steps
- Know when to bring in professional evaluators
Why should we care about evaluation?
If we care about preventing crime and victimization in Canadian communities, it only makes sense to care about what works in reducing crime and victimization. The only way to know this for sure is to invest in evaluation.
Why don't we evaluate?
Time
We know that time is especially a problem for community groups that are operating on shoestring budgets. It takes time to plan an evaluation, implement it, analyze data, report the results, and review their implications for project activities. The good news is that much of this work is part of good project management and can be integrated into daily activities.
Money
You may feel that the costs devoted to evaluation could be better spent on project activities. It is true that, at a minimum, evaluation requires costs in staff time. Rigorous third-party evaluation can cost a lot more. Local university or college faculty members and students can sometimes provide free help as part of student internships or projects.
Expertis
Your group may have little experience in planning projects that are eligible for government funding. We hope to show you how the knowledge and skills needed to plan projects are similar to those needed to plan evaluations.
Evaluation has a reputation for being complex and requiring outside expertise. While sometimes expertise is needed to conduct statistical analyses or to help determine how to answer evaluation questions, simpler evaluations can be done in-house. We'll talk more about this in this section of your handbook.
Intrusiveness
To answer questions like "Who are we reaching?" or "Did the project result in changes in attitude or behaviour," evaluations ask questions about people's life experiences, their attitudes and behaviours.
We have found that project staff are often more concerned about the intrusiveness of these questions than are the participants in their projects. It is important to remember that participation in an evaluation should always be voluntary. Participants should always be told they can refuse to answer questions or can end their participation in the evaluation at any time without affecting their involvement in project activities.
We already know the project is effective
You probably have a lot of stories or anecdotes that have proved to you the effectiveness of the project you are planning. You might feel this is more than enough evidence to prove the planned activities are effective. Evaluation helps to provide an evidence base so others can also be convinced.
Philosophy
You may feel the work you do cannot be quantified in numbers or described in a simple "linear" way. Projects often have many parts. They can affect participants in subtle, unanticipated ways. It's true that evaluations sometimes fail to capture the complexity of project activities and the ways in which they work. Adding evaluation questions that give participants and staff an open place to tell their stories can ensure these aspects are captured.
Long-term change vs. short-term funds
It seems contradictory. On the one hand, the National Crime Prevention Centre (NCPC) provides funds for only a short time; on the other, it recognizes that change often takes a long time to occur. While it's ideal to be able to track change over the long term, if you can make strong arguments as to why the short-term outcomes of your project are likely to lead to long-term change, you can focus on measuring the short-term changes and don't need to track change over the long term.
This Handbook for Community Groups and the accompanying training sessions will show you how to develop a logic model. A strong logic model that shows how project activities will lead to short- and long-term outcomes and how they all link together demonstrates to others how the short-term changes your project accomplishes can lead to further changes long after the project ends.
Fear
It's natural to worry that a negative evaluation might mean your group will not be able to get further funding. But projects often get better as a result of evaluations that show how some of their results could be improved. Evaluation is a good way to show funders you are interested in continuous improvement.
Why evaluate?
Decision making, managing the project
Evaluation is part of good management. It doesn't have to involve a lot of time or money, but some time and some money should be devoted to evaluation if you want to manage your project effectively. How ambitious your evaluation will be is likely to depend on the size and budget of your project.
You are probably already doing some kind of evaluation, at least in informal ways. You might be asking questions about participant satisfaction. Or you might be assessing the need for additional staff.
Evaluation can answer questions that need to be answered in order to ensure good project management. For example, you might ask:
- Are we reaching who we intended to reach or are we missing the people who most need our project?
- Do we need more project staff?
- Do project staff need more training?
- Does the project ensure the safety of staff and/or participants?
- Is the project resulting in the changes we thought it would?
- What aspects of the project should be modified, expanded, continued, or discontinued?
Project improvement
If your group has been involved in other community projects, you have probably made changes to improve aspects of these projects over time. For example, you may have changed the location or time in order to improve access. You may have engaged a new partner to increase referrals. You may even have evaluated these changes to learn if they made a difference. Documenting what worked can help others to learn from your project. It can help to improve not just your project, but also other projects in your community or across Canada.
Did the project work?
If we really care about crime prevention, we'll want to know that what we do works. After all, why invest our time and money in something that, in the end, isn't making a difference?
If it's hard to document whether a project prevents crime or reduces victimization, we can often show how it reduces factors associated with crime and victimization (risk factors) or increases factors that help to prevent crime or to reduce victimization (protective factors). We'll also want to know how it works so that others can copy it.
Unanticipated outcomes
Sometimes projects have effects we never predicted. These can be good or bad. For example:
-
Good. Parenting projects intended to improve participants' knowledge of child development and good parenting practices sometimes have the unintended effect of increasing participants' social support network. Through the project, they get to know others in their community whose children are the same age. They provide each other with emotional support and sometimes they provide concrete supports such as help with childcare or information about drop-in projects in the neighbourhood.
-
Bad. An evaluation of an early intervention support group intended to reduce alcohol and drug use among students (Deck & Einspruch, 1997, cited in Einspruch & Deck, 1999) found the program had some unanticipated negative outcomes. Students using alcohol or other drugs were invited to participate in a support group intended to help them examine their substance use and related behaviours, improve their problem-solving and communication skills, and develop positive bonds with others. The evaluation found students who participated in the program to a "satisfactory" level were one and a half times more likely to report alcohol use at the end of the school year than those who were referred but refused participation or who did not actively participate.
It's important to remember that projects with the very best of intentions can cause harm. In cases like the one cited above, projects might actually result in poorer outcomes for participants. Another form of harm involves tying up people's time in projects that don't have any impact when we could redirect their time and public money toward projects that have greater impact.
Accountability
Taxpayers want to know their money is spent wisely. Government needs to be accountable for the dollars it spends on community projects. Failure to document whether these projects make a difference results in questions from the Auditor General, politicians, and ultimately, fellow Canadians.
Too often we forget that we also need to be accountable to participants in community projects. They deserve to have the opportunity to express their views about what works or doesn't work and to learn from evaluation reports about the ability of programs to achieve their intended outcomes. Front-line staff often express concerns that evaluations ask too many questions of participants and that these questions are too intrusive. These are legitimate concerns. But we often find that when participants are approached in a positive way and given an overview of the purpose of the evaluation and their role in it, they are excited about their role as "research assistants." They are interested in "what works."
Public relations/fundraising
Strong project results are the best tool to promote your project and to encourage others to donate money or provide resources to sustain it.
What is evaluation?
- It's a process by which we determine whether a project is meeting its goals through the activities taking place and in the manner expected.
- It summarizes:
- Why we developed the project (goals)
- What it involves (project activities)
- What we expect will happen as a result of these activities (anticipated results or outcomes)
- What in fact did happen (actual results or outcomes)
- What this information tells us about the project (conclusions) (Ottawa Police Services, 2001, p. 14)
Evaluations do not necessarily do all of the things listed above. Some focus more specifically on reviewing the project's development and examining project activities to assess whether the project is being offered in the way it was intended (process evaluation). Others focus more on the last three points and assess whether the project achieved its intended outcomes (outcome evaluation).
Types of evaluation
Needs assessment
A needs assessment is used to learn what the people or communities that you hope to reach might need in general or in relation to a specific issue. For example, you might want to find out about safety issues in your community, about access to services, or about the extent to which your community is dealing with a certain type of crime or a certain form of victimization.
Resource assessment
A resource assessment is used to assess the resources or skills that exist among the people or communities with which you hope to work. It is often conducted alongside a needs assessment. Resource assessments identify the skills that community members can contribute to a project and resources such as community space, in-kind and financial donations, volunteer time, and other attributes that can be tapped by your crime prevention project.
Evaluability assessment
An evaluability assessment is done to determine whether a project is ready for a formal evaluation. It can suggest which evaluation approaches or methods would best suit the project.
Project monitoring
Project monitoring counts specific project activities and operations. This is a very limited kind of evaluation that helps to monitor, but not assess the project.
Formative
Also known as process evaluation, a formative evaluation tells how the project is operating, whether it is being implemented the way it was planned, and whether problems in implementation have emerged (for example, it might identify that a project is reaching a less at-risk group than it intended, that staff do not have the necessary training, that project locations are not accessible, or that project hours do not meet participant needs.).
Outcome
An outcome evaluation examines the extent to which a project has achieved the outcomes it set at the outset.
Summative
Summative evaluations examine the overall effectiveness and impact of a project, its quality, and whether its ongoing cost can be sustained.
Cost-effectiveness
A cost-effectiveness study examines the relationship between project costs and project outcomes. It assesses the cost associated with each level of improvement in outcome.
Cost-benefit
Cost-benefit analysis is like cost-effectiveness analysis in that it looks at the relationship between project costs and outcomes (or benefits). But a cost-benefit study assigns a dollar value to the outcome or benefit so that a ratio can be obtained to show the number of dollars spent and the number of dollars saved. A well-known cost-benefit analysis was done of the Perry Preschool initiative in the United States. It concluded that for every one dollar spent, more than seven dollars were saved (Barnett, 1993, cited in Schweinhart, 2002).
Some major approaches
External evaluation
This approach employs an external evaluator (a third party or person/organization not previously associated with the project being evaluated) to conduct the evaluation. Using an evaluator who is not part of the organization being evaluated increases the perceived objectivity of the results. External evaluators may be used in all of the approaches described below. Outside contractors are often hired to facilitate participatory or empowerment evaluations.
Utilization-focused
This approach focuses on what project managers and staff need to know to assist with project decision making and improvement.
Participatory
This is a method that involves participants in all aspects of the evaluation, from identifying the evaluation questions to deciding what information to collect, how to do it, and how to interpret the findings.
Empowerment
This is an approach that uses evaluation concepts, techniques, and findings to help community groups improve their programs and services. The evaluator acts as a coach or facilitator to help project staff and participants through a process of self-evaluation and reflection. Empowerment evaluation follows three steps: a) establishing a mission or vision statement, b) identifying and prioritizing the most significant program activities and rating how well the program is doing in each of those activities, and c) planning strategies to achieve future project improvement goals (Fetterman, 2002).
The approach you choose for your evaluation will depend on the evaluation's purpose. If you wish to learn ways to improve the services you offer, a utilization-focused or an empowerment approach might be appropriate. If you want to convince outside organizations that you are having a positive impact on participants, an external evaluator will help to assure objectivity.
| Steps | STOP fraud against seniors project |
|---|---|
| Identify goals (anticipated outcomes) |
|
| Describe the project | Project Activities:
|
| Identify what you want to know (evaluation questions) |
|
| Identify data sources and data collection tools |
|
| Collect the information | Student interns will assist with data collection |
| Organize the information | Contractor will enter data into database |
| Analyze the data | Contractor will analyze data for:
|
| Report the results, identify next steps |
|
When to bring in evaluation professionals
Community groups often think evaluation requires the services of an expert outsider. While expert help is sometimes needed, it's not always required. Projects funded under the Crime Prevention Action Fund (CPAF) often manage their evaluations themselves. Some choose to contract with an outside evaluator on a short-term basis to undertake key activities. For example, they may hire an evaluator to help them identify or develop appropriate data collection instruments, to develop a database, or to analyse evaluation data.
Projects funded under the Research and Knowledge Development Fund (RKDF), on the other hand, always rely on outside evaluators to ensure a rigorous and objective assessment of their project's effectiveness.
This series of workshops is intended to help you to better understand the basic steps of evaluation. We hope you'll see evaluation as an ongoing part of good project management.
Of course, there are times when you will not have the evaluation knowledge or the time and resources needed to conduct your own evaluations. Here are some situations in which an outside evaluator might be useful:
- When complex statistics are needed to analyze the results of your evaluation
- When you plan to use a wide variety of information-gathering methods, requiring detailed comparison and analysis
- When evaluation data are obtained at different points in time and you wish to analyze them to see what changes have occurred and why
- When you are unsure what information is needed to answer your evaluation questions
- When your evaluation involves experimental and comparison groups, requiring different levels of statistical comparison
- When you want an objective viewpoint (Ottawa Police Services, 2001, p. 21).
If you decide to hire an external evaluator, think about using your time with the evaluator as a learning opportunity. Consider adding to the evaluator's contract a requirement that he or she prepare you to use evaluation as an ongoing practice to manage your project effectively.
Glossary of terms
Analyze (data)
Analyzing data involves bringing some sense or meaning to the information you have collected. In the case of qualitative data, this might involve categorizing the information you collected into themes that summarize what was said. In the case of quantitative data, descriptive statistics and, in some cases, statistical tests are used to provide meaning to raw numbers. This might involve, for example, identifying the mean or average response, the range of responses from highest to lowest, or the statistical likelihood that a change in scores over time is due to more than just chance. More information about analyzing data is provided in Module 6 of this Handbook.
Comparison (or control) group
Community-based research refers to a comparison group as opposed to a control group, the term more often used in experimental research. A comparison group is a group of participants who have similar characteristics to participants in the program or project being evaluated, but who do not receive exposure to the project activities.
Data
Data is another word for information that is collected to provide knowledge or insight into a particular issue.
Evaluability assessment
An evaluability assessment is way of assessing whether a project is ready for a formal evaluation. It can suggest which evaluation approaches or methods will best suit the project.
Experimental group
An experimental group is a group of people who participate in an intervention (or program). The results for this experimental group can be compared to those of a comparison group who do not receive the intervention. The comparison group should have similar characteristics to those of the experimental group, except that they do not receive the intervention under study. The difference in results between the two groups is then measured.
Formative evaluation
Formative evaluation assesses the design, plan, and operation of a program. It reports on whether the project is being implemented the way it was planned and whether problems in implementation have emerged.
Logic model
A logic model is a way of describing a project or program. It is a tool to help in project planning and evaluation. A logic model describes the resources and activities that contribute to a project and the logical links that lead from project activities to the project's expected outcomes. Logic models are often depicted as a flow chart that includes the project's inputs, activities, outputs, and outcomes.
Needs assessment
A needs assessment is a way to collect and analyze information about the needs of local communities or groups in general or in relation to specific issues.
Outcome evaluation
Outcome evaluation assesses the short and long-term outcomes that result from participation in a project or program.
Pre-post testing
Pre-post testing involves administering the same instrument before and after an intervention or program.
Process evaluation
A process evaluation reviews project development and examines project activities to assess whether the project is being offered in the way it was intended and to identify areas where project administration and delivery can be improved.
Random sample
A random sample is made up of individuals who have an equal opportunity of being selected from a larger population. Whether any one individual from the larger population is selected for the sample is determined by chance.
Resource assessment
A resource assessment is used to assess the resources or skills that exist among the people or communities with which a project plans to work.
Sample
A sample is a subgroup of a larger population. It is studied to gain information about an entire population.
Summative evaluation
A summative evaluation examines the overall effectiveness and impact of a project, its quality, and whether its ongoing cost can be sustained.
References
Einsprunch, E.L., & Deck, D.D. (1999, November). Outcomes of peer support groups. Retrieved March 16, 2004, from
http://www.rmcorp.com\Project\PIeval\Peer.pdf
Fetterman, D. (2002). Collaborative, participatory, and empowerment evaluation. Retrieved March 16, 2004, from
http://www.stanford.edu/~davidf/empowermentevaluation.html
Ottawa Police Services. (2001, August). You can do it: A practical tool kit to evaluating police and community crime prevention programs. Retrieved March 16, 2004, from http://dsp-psd.communication.gc.ca/ Collection/J2-180-2001E.pdf
Schweinhart, L.J. (2002, June). How the High/Scope Perry Preschool study grew: A researcher's tale. Phi Delta Kappa Center for Evaluation, Development, and Research, Research Bulletin No. 32. Retrieved March 16, 2004, from
http://ww.highscope.org
Suggested resources
Websites
Bureau of Justice Assistance Evaluation
Evaluation Strategies for Human Services Programs
http://www.bja.evaluationwebsite.org/html/documents/evaluation_strat
This website provides a "Road Map" which answers the following questions: What is evaluation? Why do we conduct evaluation? What types of programs are evaluated? When do we evaluate?
Centre for Substance Abuse Prevention
Prevention Pathways
http://pathwayscourses.samhsa.gov/samhsa_pathways/courses/index.htm
This website offers free tutorials on various evaluation topics. "Evaluation for the Unevaluated 101," is an excellent introductory course to evaluation that addresses the main components of evaluation and why evaluation is important.
United Way of America
Outcome Measurement Resource Network
http://www.unitedway.com
This website is a good starting point to learn the basics of outcome measurement. It includes an introduction to outcome measurement and a discussion of why it is important.
Guides and Manuals
Annie E. Casey Foundation
When and How to use External Evaluators
http://www.aecf.org/publications/data/using_external_evaluators.pdf
This publication reports on various issues related to hiring an external evaluator. It includes questions to use when interviewing external evaluators and suggestions for managing evaluation contracts.
Health Canada
Guide to Project Evaluation: A participatory Approach
http://www.phac-aspc.gc.ca/ph-sp/phdd/resources/guide/index.htm
Chapters One and Two of this guide provide a basic introduction to evaluation. The remainder of the guide provides useful advice for data collection, analysis, and reporting.
U.S. Department of Health and Human Services - Administration for Children and Families
The Program Manager's Guide to Evaluation http://www.acf.hhs.gov/programs/opre/other_resrch/pm_guide_eval/reports/pmguide/pm guide_toc.html
The Program Manager's Guide consists of nine chapters that address the purpose of evaluation and its main components. An additional feature of this guide is a discussion about hiring and managing external evaluators.
W.K. Kellogg Foundation
Evaluation Handbook
http://www.wkkf.org/Pubs/Tools/Evaluation/Pub770.pdf
This handbook introduces evaluation as a practical and useful tool, and assists the user in creating a blueprint of evaluation.
Textbooks
Research Methods Knowledge Base
Introduction to Evaluation
http://www.socialresearchmethods.net/
This on-line textbook introduces the user to evaluation, its basic definitions, goals, methods, and the overall evaluation process. It includes answers to frequently asked questions about evaluation.
Newsletter
Centre for Community Enterprise
Making Waves, "The 'Who' Of Evaluation," Vol. 11, No.2.
http://www.cedworks.com/waves03.html
This article addresses the issues involved in using an outside evaluator and recommends use of a combination of internal and external expertise.
Module 1 Worksheets
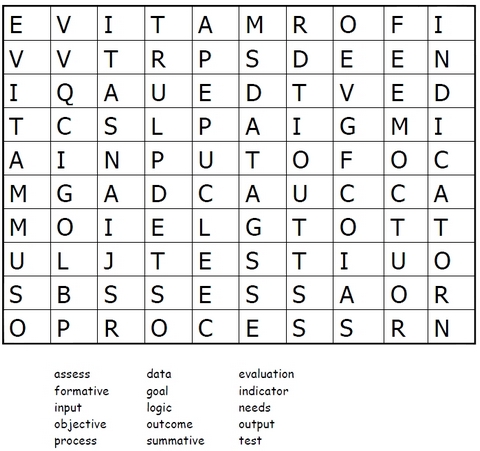
Worksheet #1
What is in a name? How many evaluation terms can you find?
Worksheet #2
Why should we care?
Why should we care about crime prevention in your community?
Module 2: Setting the stage for evaluation – Preparing a logic model
Learning Objectives
- Ability to design good projects
- Ability to design projects that are "evaluable" (i.e., that can be evaluated)
- Ability to develop strong project goals and outcomes
- Understanding of the parts of a logic model
- Ability to develop a logic model
Step 1: Identify project goals (outcomes) and who you intend to serve
A good project plan clearly identifies your goals or outcomes and the population you plan to serve. It tells others where you are headed. (In keeping with the planning tools included in the application guide for the Crime Prevention Action Fund , we're using the words "goals" and "outcomes" interchangeably.)
| Step 1 | Examples |
|---|---|
| Goals (anticipated outcomes) – What you expect the project to accomplish or change |
|
| Priority group – Who you intend to serve |
|
This is the first step in presenting the project's logic.
This training module shows how to develop a project plan, which will also serve as the first part of the evaluation plan. The two fit together. In the next training module, we will explain how to develop the rest of the evaluation plan.
Your knowledge of community needs and resources will help you to identify the goals of your project and the group of people it will serve. It is best to base your knowledge of community needs and resources on an objective assessment. You may already be familiar with needs assessments and resource assessments. These are research and project management tools that can help you plan your project. We have included some resources on needs assessments at the end of this chapter.
If you represent an agency or service that is planning a project, be sure to include members from the community you hope to serve at the project planning stage. You will want to know:
- What are their crime prevention goals?
- What would they like to see changed?
- Who do they think the project should reach out to?
Bringing together human service agencies and community members to discuss their unique perspectives can result in a stronger project.
When you bring everyone together, we suggest you give them hints about writing good project goals. We've listed some below.
Hints for developing project goals
- Use action words like increase, reduce, improve
- Avoid words like provide, develop, create
Saying that a project goal is "to provide recreational opportunities" does not tell us anything about the purpose of those recreational activities or the changes they are expected to bring about. Programs are developed to make change. They are not developed simply for the sake of delivering products or services alone.
Saying that these recreational opportunities are going to increase teamwork and leadership skills or reduce vandalism in the after-school hours are what we call SMART goals.
Be SMART
Specific
Is the goal/outcome specific? Is it clear? If you want to increase community safety, specify the particular changes you are trying to achieve to increase safety. Mention the particular group you are targeting – such as seniors, children or youth – and the particular issue you are trying to change. Here are some sample goals related to community safety:
- Increase the use of "walking school buses" for children who walk to and from the local elementary school
- Increase after-school programs for latch-key children
- Increase the participation of rural youth in organized recreational activities.
Measurable
Will you be able to measure (see) change? Will you be able to answer whether or not you achieved your goal? For example, how would you measure "improved partnerships"? Consider rewriting this goal to specify what changes will take place. Here are some examples that are easier to measure:
- Increase opportunities to share resources
- Reduce overlap in services
- Increase knowledge of community crime prevention resources
Achievable, attainable
Will the project be able to achieve the outcomes it set out? It may not be realistic to set "reduced crime" as a goal or outcome if the project activities focus on increasing coordination of services or improving awareness of a particular issue.
Relevant, realistic
Does the goal mean something to people involved in the project? Be realistic about what you can do, keeping in mind the resources available to you.
Trackable, timely
Don't set long-term goals for a short-term project. Focus on something that can be completed within the project period.
Goals/Outcomes: Indicating the direction of change
Here are some examples of the kinds of words that goals or outcomes should include. They are action words that indicate the direction of change – that is, whether something will be reduced or increased.
- Alleviated
- Augmented
- Decreased
- Diminished
- Enhanced
- Enlarged
- Expanded
- Extended
- Improved
- Increased
- Lowered
- Prevented
- Raised
- Reduced
- Shortened
What's next? Project components, inputs, activities, & outputs
Now that you have completed Step 1, you can fill in the remaining steps to complete your project plan. These steps are sandwiched between the priority group and the achievement of your goals or final outcomes. They show how you will accomplish the goals you have set. They are the key components of your project's logic model. Each step naturally leads to the next. Although the outcomes come last in the logic model, they are identified up front in order to show where we're headed.
Logic model

Splash and Ripple
Take a look at the Splash and Ripple Primer located at: http://www.ucgf.ca/English/Downloads/RBMSept2003.pdf (PLAN:NET Ltd., 2003).
It provides a wonderful metaphor to help you remember the key components of a logic model and how they fit together.
It talks about a person standing over a pond and holding a rock. When the person drops the rock in the pond, it creates a splash and then a series of ripples. If we liken this image to the steps in developing a project plan or logic model:
- The rock dropping into the pond is like an input
- The splash is like an output
- As the ripples spread, they are like moving from short-term to intermediate, and eventually to long-term outcomes
Control decreases as the ripples spread, just as it does as we move toward longer-term outcomes. Influences other than the project are more likely to intervene as time passes. We can contribute toward the longer-term outcomes, but we can rarely control them.
What is a logic model?
A logic model is a way of describing a project. It describes what goes in and out of your project. It answers questions in five areas:
- Inputs – What resources are needed to make your project operate (e.g., equipment, project materials, transportation costs, staff resources)?
- Activities – What activities take place in the project?
- Outputs – How much and what kind of products or services are generated from these activities (e.g., the number of participants involved, the number of sessions or workshops, the number of promotional materials distributed)?
- Outcomes – How well were the activities carried out and did they do what they were expected to do? Outcomes occur in the short term, intermediate, and long term. Long-term outcomes are sometimes called "impacts"
- Impact (or long-term outcome) – Has the project had an effect and, if so, was it positive, negative, or somewhere in between? These are the "big-picture" changes that the project is working toward; they are similar to the original goal statement.
Some sample outcomes :
Short term
- Increased after-school activities
- Improved coordination of services for youth, and
- Increased involvement of youth in planning activities
Intermediate
- Increased access to recreation
- Increased leadership skills
- Increased involvement in community events
Long term (impact)
- Increased sense of community
- Reduced vandalism and petty
Why develop a logic model?
- Project planning – Logic models are a useful tool for visioning and priority-setting exercises. They are a good way to bring project staff, managers, and partners together to identify what they hope to accomplish and what activities they will undertake.
- Monitoring and evaluation – Logic models help evaluators to assess the evaluability of a project (the extent to which the project activities are logically linked to the original goals, the soundness of the logic, and the extent to which the anticipated outcomes are realistic and measurable). The logic model provides a starting point for the development of project performance measures and ongoing monitoring.
- Communication, promotion – Logic models provide a simple picture of what programs do and what they plan to accomplish. They ensure all players communicate the same message when describing a project and its purpose to senior managers, referral sources, participants, and media.
- Orientation and training – Logic models provide a "big-picture" overview for new staff or volunteers
- Grant applications – Logic models are excellent tools for describing programs to potential funders. Their use in a grant application shows the funder the project has taken the first steps to putting an accountability structure in place.
Because your project is likely to change as a result of all kinds of influences, you should review your logic model regularly to ensure it continues to reflect your project's goals, activities, and anticipated outcomes.
The logic model

The logic model shown on the previous page is just a sample of what a logic model might look like. Logic models can be depicted in chart form, as on Worksheet #3, or as a flow chart, as show on the previous page.
The flow chart helps to show how various parts of the logic model link together. These links are an important part of the logic model. They show the logic between the different parts of the project. You should have a rationale to explain why each activity you plan is likely to lead to a particular outcome or outcomes. If a combination of activities result in a particular outcome, the lines in the flow chart should reflect that logic.
The following checklist can help you check how well you're doing in preparing your logic model.
Logic model check list
- Do the outcomes represent changes, benefits, results, or impacts of the project?
- Do the outcomes include strong verbs and reflect the direction of change?
- Are each of the long-term outcomes connected to short-term or intermediate outcomes that lead to them?
- Are the short-term/intermediate outcomes within the control of the project and within the usual time frame for evaluation?
- Is it reasonable to expect, based on previous experience or research (an evidence base), that these intermediate outcomes will lead to the long-term outcomes identified?
- Is there at least one activity that specifically addresses each short-term outcome?
- Is it realistic to expect that the outcomes listed could be achieved given the activities proposed? Should additional activities be added? Should the intensity, duration, or nature of the activities be changed? Or, should the outcomes be rethought?
- Are all of the program activities necessary? For example, are there any activities that do not lead to any outcomes? Are there some outcomes with too many activities linked to them?
Glossary of terms
Evaluability assessment
An evaluability assessment is way of assessing whether a project is ready for a formal evaluation. It can suggest which evaluation approaches or methods would best suit the project.
Input
Inputs refer to the resources invested in the delivery of a program or project. Sample inputs include funding, human resources (both paid and volunteer), equipment, or services. Inputs may be funded through a project budget or provided in-kind by project partners or volunteers.
Logic model
A logic model is a way of describing a project or program. It is a tool to help in project planning and evaluation. A logic model describes the resources and activities that contribute to a project and the logical links that lead from project activities to the project's expected outcomes. Logic models are often depicted as a flow chart that includes the project's inputs, activities, outputs, and outcomes.
Needs assessment
A needs assessment is a way to collect and analyze information about the needs of local communities or groups, either in general or in relation to specific issues.
Output
Outputs refer to the concrete results anticipated to occur after a project or activity is delivered. Examples of outputs include the number of flyers or materials distributed, the number of referrals made or workshops offered, or the number of participants who attend a particular service or activity.
Resource assessment
A resource assessment is a way to collect and analyze information about the resources within a particular community or group. Resources can include people or things that can support the community being assessed (e.g., financial resources, the skills and abilities of community members, community space, community programs or activities).
References
PLAN:NET Ltd. (2003, September). Splash and ripple: Planning and managing for results. Retrieved March 18, 2004, from
http://www.ucgf.ca/English/Downloads/RBMSept2003.pdf
Suggested Resources
Websites
Canadian Outcomes Research Institute
http://hmrp.net/canadianoutcomesinstitute/
This website offers general outcome measurement resources and a variety of resources related to logic models.
Innovation Network Online
http://www.innonet.org/
There is no charge to register on this network. It provides general guides to evaluation and an array of logic model resources. Innovation Network Online also provides an interactive Logic Model Builder that assists the user in developing a logic model.
University of Wisconsin
Program Development and Evaluation
http://www.uwex.edu/ces/pdande/evaluation/evallogicmodel.html
This website provides resources, worksheets, and examples of program logic models.
W.K. Kellogg Foundation
Evaluation Toolkit
http://www.wkkf.org/Programming/Resources.aspx?CID=281
This website provides resources on developing logic models and general resources for program evaluation.
Manuals and Guides
Innovation Network Online
Logic Model Workbook
http://www.innonetdev.org/
This workbook is available from Innovation Network Online. It provides a step-by-step process for creating a logic model. Items discussed in the workbook include goals, resources, activities, outputs, and outcomes. Additional logic model resources are provided.
Western Centre for Substance Abuse and Prevention
Building a Successful Prevention Program
http://casat.unr.edu/westcapt/bestpractices/eval.htm
This comprehensive guide illustrates program evaluation using a logic model. Topics include planning an evaluation, building a logic model, and conducting an evaluation using a logic model.
W.K. Kellogg Foundation
Logic Model Development Guide
http://www.wkkf.org/Pubs/Tools/Evaluation/Pub3669.pdf
This is a comprehensive guide to building your own logic model and includes examples and worksheets.
Module 2 Worksheets
Worksheet #1 Step 1: Developing a project/evaluation plan
Title of Crime Prevention Project:
Priority Group:
Project Goals/Outcomes:
Worksheet #2 What is wrong with these outcomes?
- Review the sample outcomes provided.
- List problems with the outcomes provided.
- Re-write the outcomes to correct the problems you have identified.
Worksheet #3:
| Inputs (Drop) | Activities (Fall into pond) | Outputs (Splash) | Outcomes (Ripples) | Impacts (Long-term outcomes) (0uter ripple) | |
|---|---|---|---|---|---|
| Short-term | Intermediate | ||||
Worksheet #4a:
Case study: Teaching young people to deal with abusive relationships
- The problem: Male violence against women in an isolated, rural community
- Partners: Big Brothers, local high school teachers, local schools, a service club, 2 local businesses
- Goals:
- To reduce the incidence of abusive relationships among young people
- To increase the ability of students in Grades 6-9 to recognize the danger signs for violence in intimate relationships
- To increase students' skills to resolve problems before they lead to violence
- Resources: two in-kind staff from Big Brothers; space and equipment donated by local schools; grants from the service club and, six volunteer facilitators
- Work plan:
- Two in-kind staff will work with teachers to develop workshop materials for a 12-week curriculum on healthy relationships for girls in Grades 6-9
- Two in-kind staff will work with teachers to develop a six-week mentoring project for boys in Grades 6-9
- One in-kind staff will train three facilitators to offer the curriculum for girls
- One in-kind staff will train three facilitators to offer the mentoring project
- Three facilitators will deliver the 12-week curriculum to girls
- Three facilitators will deliver the mentoring project to boys
Step 1: Goals and priority group
Goals
- Reduce the incidence of abusive relationships among young people
- Increase the ability of students in Grades 6-9 to recognize the danger signs for violence in intimate relationships
- Increase students' skills to resolve problems before they lead to violence
Priority Group
- Boys in Grades 6 to 9
- Girls in Grades 6 to 9
The goals listed above were set for the project in the planning stage. The next step is to develop a logic model for the project. As you work through the model, you may identify more specific outcomes than the goals identified here.
Logic model check list
- Do the outcomes represent changes, benefits, results, or impacts of the program?
- Do the outcomes include strong verbs and reflect the direction of change? Are each of the long-term outcomes connected to short-term or intermediate outcomes that lead to them?
- Are the short-term/intermediate outcomes within the control of the program and within the usual time frame for evaluation?
- Is it reasonable to expect, based on previous experience or research (an evidence base), that these intermediate outcomes will lead to the long-term outcomes identified?
- Is there at least one activity that specifically addresses each short-term outcome?
- Is it realistic to expect that the outcomes listed could be achieved given the activities proposed? Should additional activities be added? Should the intensity, duration, or nature of the activities be changed? Or, should the outcomes be rethought?
- Are all of the program activities necessary? For example, are there any activities that do not lead to any outcomes? Are there some outcomes with too many activities linked to them?
Worksheet #4b: Case study: Youth development project for at-risk aboriginal youth
- The problem: Aboriginal youth in an urban community feel disconnected from their culture and their school settings and are at risk of involvement in negative peer activities.
- Partners: Native Friendship Centre, YMCA, summer camp, elders
- Goals:
- To foster honour and respect of traditional culture among inner-city aboriginal youth
- To increase a sense of belonging to a larger aboriginal community
- To encourage the development of healthy ways to express feelings of anger and alienation
- To reduce gang involvement of inner-city aboriginal youth
- Resources: four summer staff at the Native Friendship Centre funded by the NCPC, in-kind contribution of a supervisor from the Friendship Centre, community space at the local YMCA, eight-week time slot at a summer camp, support of two native elders, use of two school buses, four parent volunteers, $7500 in grant money to cover program supplies and use of school bus
- Work plan:
- Two senior summer staff hired for 14 weeks will recruit and select youth, develop and lead program activities for the two-part summer program. The program will involve two program groups each participating in four weeks of urban activities and four weeks at the summer camp at opposing times.
- Two junior staff hired for 11 weeks will assist senior staff in preparation and follow-up activities and in leading summer program.
- Urban activities will include activities to teach youth about aboriginal culture and to explore creative arts and theatre, basketball and other sports activities at the YMCA, discussion groups involving elders, and joint planning by youth to culminate in a community project such as a mural painting, a theatrical event, or a youth-led nature walk for community members.
- Camp activities will be similar to those offered in the city, but with increased focus on traditional culture and life skills, discussion groups, and outdoor sports activities.
- One senior and one junior staff will lead 12 to 15 at-risk youth in the four-week urban program with the assistance of an elder and two parent volunteers. The remaining staff and volunteers will lead a similar group in the four-week summer camp. Both groups will switch programs at the four-week point.
Step 1: Goals and priority group
Goals
- To foster honour and respect of traditional culture among inner-city aboriginal youth
- To increase a sense of belonging to a larger aboriginal community
- To encourage the development of healthy ways to express feelings of anger and alienation
- To reduce gang involvement of inner-city aboriginal youth
Priority Group
- At-risk aboriginal youth from 14-17 years old living in the inner city
The goals listed above were set for the project in the planning stage. The next step is to develop a logic model for the project. As you work through the model, you may identify more specific outcomes than the goals identified here.
Logic model check list
- Do the outcomes represent changes, benefits, results, or impacts of the program?
- Do the outcomes include strong verbs and reflect the direction of change?
- Are each of the long-term outcomes connected to short-term or intermediate outcomes that lead to them?
- Are the short-term/intermediate outcomes within the control of the program and within the usual time frame for evaluation?
- Is it reasonable to expect, based on previous experience or research (an evidence base), that these intermediate outcomes will lead to the long-term outcomes identified?
- Is there at least one activity that specifically addresses each short-term outcome?
- Is it realistic to expect that the outcomes listed could be achieved given the activities proposed? Should additional activities be added? Should the intensity, duration, or nature of the activities be changed? Or, should the outcomes be rethought?
- Are all of the program activities necessary? For example, are there any activities that do not lead to any outcomes? Are there some outcomes with too many activities linked to them?
Worksheet #4c: Case study: Network and coalition building
- The problem: Lack of infrastructure and focused effort to deal with the root causes of crime in a medium-sized community.
- Partners: School board, 4 community centers, 3 local churches, citizens, youth centre, police, employment help centre, mall management
- Goals:
- Increase the development of broad community-based partnerships that can deal with local crime prevention issues
- Increased community/NGO awareness of root causes of crime
- Enhanced community/NGO understanding of and support for what is required to respond effectively to the root causes of crime
- Improved coordination of community crime-prevention efforts
- Resources: half-time crime prevention coordinator, representatives from each of the partner organizations, 10 interested community members, $1000 donated by the mall management, in-kind pace and equipment at community centre
- Work plan:
- The key partners will form a steering committee.
- Steering committee members and the half-time coordinator will recruit additional members with leadership skills.
- Three subcommittees will be formed: a public awareness subcommittee, a professional development subcommittee, and a fundraising subcommittee.
- The steering committee will organize a crime-prevention planning day involving existing community committees and networks with the intent of identifying promising crime-prevention programs to be implemented in the community.
- The public awareness committee will plan and implement one major community awareness campaign in the first year
- The professional development committee will develop and implement professional training opportunities for member organizations on responses to the root causes of crime.
- The fundraising committee will approach local foundations and prepare funding proposals for program activities identified at the crime-prevention planning day.
Step 1: Goals and priority group
Goals
- Increase the development of broad communitybased partnerships that can deal with local crime prevention issues
- Increased community/NGO awareness of root causes of crime
- Enhanced community/NGO understanding of and support for what is required to respond effectively to the root causes of crime
- Improved networking/partnerships among members
Priority Group
- Community at large
- NGOs/churches/businesses
The goals listed above were set for the project in the planning stage. The next step is to develop a logic model for the project.
As you work through the model, you may identify more specific outcomes than the goals identified here.
Logic model check list
- Do the outcomes represent changes, benefits, results, or impacts of the program?
- Do the outcomes include strong verbs and reflect the direction of change?
- Are each of the long-term outcomes connected to
short-term or intermediate outcomes that lead to
them? - Are the short-term/intermediate outcomes within the
control of the program and within the usual time
frame for evaluation? - Is it reasonable to expect, based on previous
experience or research (an evidence base), that these
intermediate outcomes will lead to the long-term
outcomes identified? - Is there at least one activity that specifically
addresses each short-term outcome? - Is it realistic to expect that the outcomes listed could
be achieved given the activities proposed? Should
additional activities be added? Should the intensity,
duration, or nature of the activities be changed? Or,
should the outcomes be rethought? - Are all of the program activities necessary? For
example, are there any activities that do not lead to
any outcomes? Are there some outcomes with too
many activities linked to them?
Module 3: Developing an evaluation plan
Learning objectives
- Ability to develop an evaluation plan, including:
- Identifying evaluation questions
- Developing indicators
- Choosing methods for data collection
- Sampling strategies
- Basic analysis
- Reporting results
What have we got so far?
- We know the project's goals and the priority group it is trying to reach.
- We identified the relationships between the project goals and inputs, activities, outputs, and outcomes.
- We understand the assumptions about these relationships.
As you will remember from Module 2, the relationships between project goals and inputs, activities, outputs, and outcomes are outlined in the logic model by drawing lines to show how they relate to each other. The assumptions behind these relationships are not portrayed in the model, but it is a good idea to identify these assumptions in the evaluation plan. For each outcome identified, a rationale should be provided to explain why the activity is likely to lead to the particular outcome.
Evaluations of projects funded under the Research and Knowledge Development Fund prepare a theory of change that tests the assumptions made in the logic model against what is known from existing literature.
If you are interested in learning more about how to write up the assumptions behind your logic model or to check the logic of your program, check out the web site:
http://www.theoryofchange.org/html/example.html
What's next?
- Define the purpose of your evaluation and the questions you want it to answer
- Define indicators that will show your project is achieving its goals/outcomes
- Identify sources of information for these indicators
- Determine how you will gather the information
What should an evaluation plan include?

We completed the first two steps (shown in black) in Module 2. In this Module, we will review the remaining steps in developing an evaluation plan.
Identifying evaluation questions
- Determine the goal of the evaluation (not of the project) – This will give you an idea of the questions you will want the evaluation to answer. Seek various perspectives in developing the evaluation questions. For example, find out what the funder, staff, participants, partners, and others want to know.
- Here are some ideas:
- Was the project implemented as planned?
- Did the priority group access the project?
- Did the project achieve its purpose (anticipated outcomes)?
- Were there unanticipated outcomes of the project (positive or negative)?
Identifying indicators
What is an "indicator"?
- A variable (or information) that measures one aspect of a program or project.
- It indicates whether a project has met a particular goal.
- There should be at least one indicator for each significant element of the project (i.e., at least one for each outcome identified in the logic model).
There are two kinds of indicators:
- A process indicator provides evidence that a project activity has taken place as planned.
- An outcome indicator provides evidence that a project activity has caused a change or difference in a behaviour, attitude, community, etc.
So, an indicator must be something we expect to change or vary from the time the project begins (known as the baseline) until a later point when the project activities have taken place and are likely to have had an impact.
Indicators can focus on inputs, outputs, or outcomes, but they should be narrowly defined in a way that precisely captures what you're trying to measure. Indicators are probably the trickiest part of designing an evaluation. They should:
- provide accurate and reliable evidence,
- be easy to gather, and
- provide useful information for making management decisions.
How to choose good indicators
- Validity – Does it measure the outcome?
- Reliability – Does it give a consistent measurement of the outcome over time (i.e., the results do not vary as a result of small changes in the respondent's mood or circumstances particular to a certain day)?
- Timeliness – Does it provide information at appropriate times in terms of project goals and activities?
- Ethics – Can the information be gathered without invading privacy or breaking ethics standards for social research?
- Usefulness – Will it provide useful information for project managers?
- Comparability – Can we compare the results across population groups or approaches?
Think back to the splash and ripple metaphor (PLAN:NET Ltd., 2003) we used in Module 2. If we wanted to measure what impact that drop in the pond had, what would be a good indicator? (Hint: the ripples are the outcomes).
Let's say we decided an indicator of the drop's impact would be the circumference of the outer ripple:
- Validity – Does measuring the circumference of the outer ripple tell us how big the final outcome was?
- Reliability – Would measuring the circumference of the outer ripples for 20 different drops give us an accurate assessment of the final outcome? Or could it change from one measurement to another?
- Note that if it is windy, the ripples might be hard to assess. As we said when we used this metaphor in the previous module, we have less control as the ripples spread, just as projects have less control over longer-term outcomes.
- Timeliness – How might the time when the indicator was measured affect the result?
- Note that if we measure the outer ripple too soon, we might be looking at an inner ripple – a short-term or intermediate outcome – rather than the outer ripple. If we measure too late, the ripple may have faded away. While we generally hope that project outcomes will last and not fade, we don't often know this for sure. Sometimes evaluations include a measurement approximately one year after a program or activity to see if changes found immediately afterward continued to last.
- Ethics – This is not likely an issue with the drop, unless it's in someone's bathtub! But if we're dealing with human beings, we want to respect their privacy and ethical standards.
- Usefulness – What will measuring the circumference of the outer ripple tell us? Will it tell us how big the drop was or how high the palm tree from which it dropped was?
- If we don't know the height of the tree (i.e., a bit about the process of the "intervention"), the information about the size of the outer ripple (or outcome) won't be very useful.
- Comparability – Will the circumference of ripples be comparable across smaller vs. larger ponds? Will it be comparable if the drop falls from a tap rather than a tree?
- These questions have parallels in the real world of project evaluation. The difference between small and large ponds, for example, might be a bit like the difference between projects in urban and rural communities. The difference between a drop falling from a tap and that falling from a tree can be likened to the difference between a project delivered by trained staff versus one delivered by untrained staff.
Some additional considerations when choosing indicators
- Availability – Sometimes the information that would be the best indicator of change is not available. For example, a project aimed at preventing abusive relationships among high school students might wish to obtain information about police reports related to date rape or relationship violence among students in the high schools involved in the project. However, police report information may not be broken down by school district.
- Resources – It would be ideal to do a long-term follow-up of participants in the project described in the example above to determine their involvement in abusive relationships over time. But this may not be feasible due to the large cost involved in such a survey. Resources are a key concern for projects with limited budgets.
- Program needs – Some information may not be available at the time it is required for an evaluation. For example, information about financial inputs may only be available for the project's fiscal year rather than for the time period needed for the evaluation.
- Funder requirements – Some funding bodies require information to be collected in a certain way. If the same information is required for the evaluation, the evaluation plan may need to be adapted to accommodate the project's other reporting requirements.
A good reference tool to help you select indicators can be found in Splash and Ripple: Planning and Managing for Results (PLAN:NET Ltd., 2003).
Identifying information sources
Once you have identified your indicators, you will need to think about who will provide the information you need. It's best to use a number of sources of information.
Researchers often talk about the importance of triangulation. This refers to bringing together information from more than one source. For example, you might analyze results from a pre-post survey, a focus group, and a review of project files. You can then compare the results of each of these separate information sources to confirm whether they are saying similar things. If more than one source reports similar information, you can feel more confident in the validity of the results you report.
The following page provides a list of some typical sources of information and suggested ways to gather information from them:
- Participants – intake form, interviews, focus groups, observation
- Public – surveys, questionnaires, community-level statistics
- Other agencies – focus groups, key informant interviews, surveys
- Project staff – focus groups, key informant interviews, project records/notes
- Media – review of media reports
Choosing data collection methods
How can you get the information?
- Project records/document review
- Interviews/focus groups
- Surveys/questionnaires
- Participant observation
- Population level data/statistics
When deciding what data to collect, how much to collect, and from where, avoid stretching your capacity to collect information. Develop priorities and start with information you can obtain within your organization, such as information on your project's activities and procedures. You can always amend your evaluation plan if you find something surprising that warrants further research.
Although their resources are limited, even projects funded under the Crime Prevention Action Fund should try to find some ways to measure the impact of their projects – how did it make a difference? – and not just the process. At the proposal development stage, groups applying for CPAF funding should think about ways to wrap the evaluation component into their project activities. Focus groups, for example, can sometimes serve two purposes: helping to further community development while at the same time, gaining perspectives on what has worked or what has not worked to date.
In all cases, it's important to ensure informed consent is provided for any information collected. If information collection will include photographs or videos of participants, always obtain participants' permission to use the photos/videos in whatever way is anticipated. When collecting information from or taking pictures of children and youth, first obtain permission from their parents.
Who should get the information?
Decisions about who should collect evaluation information will depend on a number of factors: convenience, the need for objectivity, issues related to the quality of the information collected, and the protection of confidentiality. Sometimes it will be most practical and convenient to have project staff gather information from participants. For example, when staff are already gathering intake information to better understand participant needs when entering a project, it makes sense to adapt the intake interview to include questions for evaluation purposes. In other situations, it is best to have a third party collect the information in order to reduce bias. In still other situations, participants may self-complete questionnaires. When self-completion is considered as an option, potential threats to the quality of data, such as literacy or comprehension of English or French as a second language, should be taken into account.
Closely tied to consideration of who will collect the information is the question of confidentiality. Think about how you will protect the confidentiality, and in some cases the anonymity, of those who provide the information.
When?
Some options include:
- Continuously
- After each event/activity
- At regular intervals
- Before and after programs
When collecting outcome information, at a minimum, you should try to gather information:
- before the project/activity begins (or soon after it begins) and
- after it is complete.
Information collected before a project or activity begins is known as baseline information. It shows what the situation was like in the community or for individual participants before the project or activity began or before individual participants entered the project or activity.
In addition to collecting information after the project is over (or after participants complete a series of project activities), it is a good idea to collect outcome information at another point six months to one year after the intervention. This will allow you to see if any of the changes found immediately after the intervention last over time. This longer-term follow-up may not be possible for small CPAF projects with budget or time limitations.
Factors to consider
Appropriatenes
- Ensure the way you collect information is appropriate to the kind of information you hope to obtain. For example, if you want an in-depth picture of a particular topic or issue, qualitative information might be more useful.
- If your project involves people from various ethnic or religious backgrounds, ensure the data collection tools you intend to use are culturally appropriate. Measures of self-esteem, for example, are often based on a western concept of what represents good self-esteem.
- Match the sophistication of the language used in the instrument to the language skills of the respondents. If respondents have low literacy levels, administer tools orally.
- Make sure the data collection methods you choose are feasible: They should be both affordable and likely to provide the information you need.
Acceptance by respondents
- Consider involving potential participants in the selection and development of data collection tools.
- Consider cultural and age appropriateness.
- Avoid intrusive questions if they are not essential to the evaluation.
- Focus on need-to-know information to avoid unnecessarily long questionnaires.
Resources needed for analysis
- Quantitative data are generally less time consuming to analyze, especially when data analysis software programs are used. Remember that more sophisticated analyses will require knowledge of statistics.
- Qualitative analyses do not require statistical knowledge, but can be very time consuming (and therefore costly) and must be conducted systematically to ensure reduction of bias.
Credibility
- Evaluations have to withstand critiques from stakeholders such as partners, participants, and funders. Consult with people who have expertise in evaluation and research methods to ensure you have compensated for threats to the evaluation's integrity. These threats are discussed in more detail in Module 5.
- Using more than one method to measure any one outcome will increase credibility.
Qualitative vs. quantitative data
1. Quantitative
Quantitative measures tend to look at:
- Frequency
- Intensity
- Duration
Quantitative data answer questions such as: How much? How many? They can be obtained from questionnaires in the form of rated scales, checklists, or true/false questions. These methods are often used to assess changes in attitudes or behaviour.
Quantitative data can be compared across different populations, studies, or time. As an example, the new CPAF application guide has a number of multiple-choice questions. The NCPC can roll up the responses to these questions to learn more about the kinds of projects being proposed across the country, in specific provinces or communities, or over different periods of time.
Quantitative measures are often simple to administer and easy to score and interpret. However, depending on the level of sophistication of the data you collect and the analyses you want to do, you may need someone with a background in statistics to analyze your quantitative data.
Here are some examples of questions that result in quantitative data:
Rated scale:
1. Please rate your satisfaction with this program.
- 1 Very satisfied
- 2
- 3
- 4
- 5 Very unsatisfied
Forced choice or close-ended question:
2. Which services did you receive? (Check all that apply.)
- Classroom instruction
- Individual mentoring/support
- Referrals
True/False question:
3. Indicate whether the following statements are true or false:
- Jealousy is a sign of love. T F
- When a woman gets hit by her partner, she must have provoked him in some way. T F
2. Qualitative
Qualitative measures provide descriptive information that explains how and why things occurred. When combined with quantitative measures, qualitative measures can provide context to the results of a study. On their own, they provide rich information that can help to explore different issues, including how and why projects work the way they do.
Here are some examples of questions that result in qualitative data:
- How would you describe your agency's involvement in the relationship-abuse prevention project?
- How effective do you think the community coalition has been in raising student awareness of the warning signs of relationship abuse?
| Data Type | Strengths | Weaknesses |
|---|---|---|
| Quantitative |
|
|
| Qualitative |
|
|
Considerations when choosing survey methods
The table on the following page can help you to consider the data collection method best suited to your evaluation. When "yes" is indicated for a particular option, that means it will work in the situation cited in the left column.
It's important to remember that, while telephone interviews have many advantages, they may not be the best method if many of your project participants have limited incomes and may not have phones.
| Important Consideration | Survey Options | |||
|---|---|---|---|---|
| Mail-out Survey | Telephone Interview | Face-toface Interview | Focus Group | |
| Large sample needed | Yes | Maybe | No | No |
| Require high response rate | No | Maybe | Yes | Yes |
| Target specific groups | No | Maybe | Yes | Yes |
| Issues are complicated | Maybe | No | Yes | Yes |
| Must have open-ended questions | No | Maybe | Yes | Yes |
| Need to probe for details | No | Maybe | Yes | Yes |
| Trained interviewers are not available | Yes | No | No | No |
| Results required quickly | No | Maybe | Yes | Yes |
| Budget is limited | Yes | Maybe | No | No |
Deciding whether to "sample"
Sampling is the process of choosing a subset or sample of people to study in order to make generalizations about the larger population or group.
Evaluations do not necessarily require a sampling strategy, but sampling can reduce the resources required to collect and analyze information. In cases where the number of participants is small (for example, less than 30 participants), collect information from all participants. Generally, if it is simple and inexpensive to include all participants in your study, it is best to do so. If, on the other hand, the population being studied is large, sampling can reduce the resources needed for data collection and analysis. Choosing a sample from a very large population can even help to reduce error.
When determining your sample size, consider:
- Available resources (staff, money, time) to collect the data and conduct the analyses.
- Anticipated analysis – If you're collecting qualitative information, for example, you should limit the number of respondents. Transcribing and analyzing qualitative data can be time consuming and costly.
- If you intend to analyze separately the information you collect from different subgroups (e.g., low vs. middle income, male vs. female, female low income vs. female middle income), ensure there will be enough participants to allow these subgroup analyses.
- Expected response rate
- Some of the people selected for the study may decline to participate.
- If you intend to collect information at multiple points in time, a certain number are guaranteed to drop out before all data are collected
- Some methods have poorer response rates than others. For example, mail-out surveys typically have poor return rates even when frequent reminders are made.
- Need for credibility – Samples should always be representative of the entire group from which they are drawn. Some examples of samples that would not be considered credible include:
- A focus group involving only those participants who staff feel have had good experiences in the project,
- Satisfaction surveys involving only those participants who completed the project activities, and
- Surveys of only those neighbourhood residents who live in single-family dwellings.
Choosing a sample
- Quantitative – Choose a sample that is representative of the population you are studying. Sampling tables can help to identify the appropriate sample size.
- In a random sample, each member of the population has an equal chance of being selected. A random sample might involve using every nth person from the population being studied, after selecting the first person with a random method. For example, you might randomly select a time of the week. The first person entering your project after that time will be the first person selected for your sample. Every fifth person after that first person will also be elected for the sample.
- In a stratified random sample, you will first divide the full group of participants into different subgroups. "Stratified" refers to the sectioning of a group into various parts. For example, you might divide the population being studied into parts according to characteristics such as gender, education level, or cultural affiliation. Then you would select a random sample from each group. This will ensure there are representative numbers of the different subgroups within a population.
- Qualitative – You can use a number of sampling strategies for qualitative research, including random sampling. But participants in qualitative studies are normally chosen for their ability to provide in-depth, rich information and different perspectives on the same topic. Qualitative studies generally involve smaller samples.
- Think about how you will cover all aspects of the "story." It is a bit like the work of a journalist. You have to cover all the angles. Your evaluation questions will direct you to the people who should be included: They may be participants, partners, staff, advisory committee members, funders, community members, or representatives from all of these groups.
Deciding how many to include in a sample
Tables are available to help you identify the appropriate sample size for your study. A sample size table is included in You Can Do It: A Practical Tool Kit to Evaluating Police and Community Crime Prevention Programs (p. 52). (See the web site reference at the end of this module of your handbook.)
Remember to factor in the expected response rate when choosing a sample size.
Think about how many responses you will ideally need, factor in the anticipated response rate, then choose your sample size. Here is an example of how you can do this:
- Your desired sample size is 50
- The expected response rate is 80%
- The sample size needed = 50 ÷ .80 = 62.5 (or 63).
- With a response rate of 80%, you should begin with a sample of 63 people to assure you will have 50 respondents in your completed sample.
Analyzing the results
Your evaluation plan should propose how you will analyze the information you obtain. We discuss some basic ways to analyze quantitative and qualitative data below.
Quantitative
Analysis involves sorting out the meaning and value of the data you have collected. We will talk more about how to analyze results in Module 6 of this handbook, but we provide a very brief overview here.
First of all, don't panic! Analysis does not have to be difficult. You can do simple analyses:
- Frequencies – how frequently certain responses were provided (simply count the number)
- Percentages – What percentage of respondents said a rather than b or c. You might even want to get a bit more sophisticated and show how the percentages differed across groups compared to the whole.
- Mean – the average response. This can be influenced by extreme responses (i.e., either much higher or much lower than average). If this is likely to occur, consider providing the median response too.
- Median – the middle response when responses are ordered from highest to lowest
- Mode – the most frequently provided response
See pages 4 to 8 of Module 6 of this handbook for information about how to calculate these basic statistics.
Qualitative
Small amounts of qualitative data can be summarized to provide an overall picture of what was said. As an example, if you have a few open-ended questions on a satisfaction survey, you can simply summarize the responses. ("Open-ended" means the questions do not have forced responses, such as yes/no, true/false, or a fixed number of responses from which the respondent must select.) As you're summarizing the responses, if some responses come up time and time again, list the number of times these more frequent responses were provided. This will give a sense of how common these responses were across respondents.
If you have larger amounts of data, content analysis can be done. This is a process where patterns or themes in the data are identified, given a code or name, and categorized. If you conduct a number of interviews with open-ended questions, you will need to do this more formal kind of analysis. When you report on the analysis, list and discuss each of the major themes identified (for example, teen respondents interpreted jealousy as a sign of love), summarizing what was said about this theme and providing representative quotations that reflect what was said.
Many people prefer to manually identify categories in the data by carefully reading through the transcripts of interviews, recording in the margins the themes they identify, and highlighting the quotes that best represent these themes. They feel this process enables them to gain a closer and more in-depth understanding of the data. Others prefer to use software programs (e.g., NVIVO/NUD*IST) that can do the categorizing of themes or patterns for them.
More information about content analysis is provided on pages 9 to 11 of Module 6
Reporting the results
Your evaluation plan should propose how you will communicate your results. Here are some things to consider when deciding how you will report the results (Ottawa Police Services, 2001):
- What worked well? Needed improvement?
- If there were problems, what were they?
- Can the problems be fixed with existing resources?
- What strengths stand out and should be further enhanced?
- Did the project accomplish its goals effectively? If yes, through what means?
- Overall, is the project worthwhile?
You should also keep in mind who your audience will be. Different methods of presentation are suited to different audiences. Some ways to present the results of your evaluation include:
- one-page summaries,
- oral presentations,
- reports with lots of visuals,
- reports that include technical details in the appendices,
- drama or video presentations.
Think about who should receive your evaluation findings. Don't forget to include project participants in your list. They deserve to know what you have learned.
As you plan your reporting strategy, make sure you plan to address the issues the reader or user will see as important. Check the requirements of your funder. What do they want to know?
No matter who your audience will be, use plain language. That way no one will be left out because they don't understand the jargon unique to your project or your area of expertise. Remember that participants may need a different reporting style than funders and other partners.
Finally, make sure you deliver your report on time!
Glossary of terms
Baseline
Information collected before a project or activity begins is known as baseline information. It shows what the situation was like in the community or for individual participants before the project or activity began or before individual participants entered the project or activity.
Close-ended question
Close-ended questions ask respondents to choose from a list of possible answers. A multiple-choice question is an example of a close-ended question.
Content analysis
Content analysis is the process by which patterns or themes in qualitative data are identified, given a code, and categorized (Patton, 1990).
Cultural appropriateness
Cultural appropriateness refers to the degree to which a measure is appropriate and sensitive to cultural variation. If members of a particular cultural group are not included in the validation and standardization studies used to develop an evaluation tool, the tool may not be appropriate to use with that cultural group (Ogden/Boyes Associates Ltd., 2001).
Focus group
Focus groups are one method of data collection. They normally involve less than 15 people. A facilitator asks the group a series of questions to gain their perceptions and opinions on a particular topic. Their responses are recorded.
In-depth interview
An in-depth interview is a guided conversation between an interviewer and a respondent. The interviewer asks a series of open-ended questions. The interviewer normally follows a guide, but may deviate from the guide to pursue a line of questioning relevant to a particular thought or idea.
Indicator
An indicator is information that is collected about a particular process or outcome. For example, an indicator of partner satisfaction with a project might be the number of referrals partners make to the project, the number of partnership meetings they attend, or their responses to a satisfaction questionnaire.
Informed consent
Participants in research and evaluation studies, or their guardians, should provide free (voluntary) and informed consent. This normally involves providing written consent, but other methods of recording consent may be appropriate for particular groups. Informed consent procedures should include disclosure of all information to be collected in the research; information about the nature and purpose of the research, the identity of the researcher, the expected duration and nature of participation, any potential harms and benefits of participation in the research, how the results of the research will be used and with whom they will be shared; and assurance that participants may drop out of the research or refuse to participate in any part of it without being penalized in any way. More information about the nature of informed consent is available in the Tri-Council Policy Statement: Ethical Conduct for Research Involving Humans (see http://www.pre.ethics.gc.ca/english/policystatement/policystatement.cfm).
Open-ended question
Open-ended questions allow respondents to answer in their own words rather than being restricted to a set of predetermined categories of response.
Pre-post survey
A pre-post survey involves administering the same survey instrument before and after an intervention or program.
Qualitative data
Qualitative data are a descriptive form of information presented in a non-numerical format. Qualitative data result from open-ended questions. They are normally collected in one of three different ways: a) in-depth, open-ended interviews, b) direct observation, or c) written documents (Patton, 1990).
Quantitative data
Quantitative data are numeric measurements. They tell us about quantity, frequency, intensity, and duration.
Random sample
Each member of a random sample has an equal opportunity of being selected from a larger population. Whether any one person from the larger population is selected for the sample is determined by chance.
Sample
A sample is a subgroup of a larger population. It is studied to gain information about an entire population.
Theory of change
A theory of change is a way to describe the assumptions or rationale for why a program or set of project activities is likely to lead to particular outcomes. It outlines the steps between each activity and its ultimate impact and cites theories that support the assumptions made about the links between the activity and its outcomes or impact.
Triangulation
Triangulation is a process that involves collecting information about similar questions or issues using different methods (e.g., interviews, questionnaires, focus groups) and/or different sources of information (e.g., staff and participants). Responses from various sources or methods are then compared to determine if they support or contradict each other.
References
The Aspen Institute Roundtable on Comprehensive Community Initiatives. (2003). Theory of change.org. Retrieved October 18, 2004, from
http://www.theoryofchange.org/html/example.html
Interagency Advisory Panel on Research Ethics. (1998). Tri-Council policy statement: Ethical conduct for research involving humans (with 2000, 2002 updates). Retrieved October 18, 2004, from
http://www.pre.ethics.gc.ca/english/policystatement/policystatement.cfm
Ogden/Boyes Associates Ltd. (2001). CAPC program evaluation tool kit: Tools and strategies for monitoring and evaluating programs involving children, families, and communities. Unpublished report for Health Canada, Population and Public Health Branch, Alberta/Northwest Territories Region, Calgary, AB.
Ottawa Police Services. (2001, August). You can do it: A practical tool kit to evaluating police and community crime prevention programs. Retrieved October 18, 2004, from
http://www.ottawapolice.ca/en/resources/publications/pdf/you%5Fcan%5Fdo%5Fit%5Fevaluation%5Ftoolkit.pdf
Patton, M. Q. (1990). Qualitative evaluation and research methods. London: Sage.
PLAN:NET Ltd. (2003, September). Splash and ripple: Planning and managing for results. Retrieved October 18, 2004, from
http://www.ucgf.ca/English/Downloads/RBMSept2003.pdf
Suggested Resources
Websites
Centre for Substance Abuse Prevention
Prevention Pathways
http://pathwayscourses.samhsa.gov/
This website offers tutorials on various evaluation components. "Evaluated for the Unevaluated 102," is an excellent course that provides information on developing an evaluation plan.
Community Toolbox
Developing an Evaluation Plan
http://ctb.ku.edu/tools/en/section_1352.htm
This site provides basic information on key considerations when developing an evaluation plan.
Management Assistance Program for Non-Profits (MAP)
Basic Guide to Program Evaluation
http://www.managementhelp.org/evaluatn/fnl_eval.htm#anchor1581634
This website provides information to assist in the development of an evaluation plan. Also included are key considerations when planning evaluation.
North Central Educational Regional Laboratory
Evaluation Design Matrix
http://www.ncrel.org/tech/tpd/res/matrix.htm
This matrix assists in outlining important components in evaluation planning, and is useful for developing your own evaluation plan.
United States Agency for International Development
Performance Monitoring and Evaluation Tips
http://www.dec.org/pdf_docs/pnaby215.pdf
This publication outlines the importance of performance monitoring plans, and identifies key areas to consider when planning an evaluation.
Textbooks
Trochim, William M., (2000).
The Research Methods Knowledge Base, 2nd Edition.
http://www.socialresearchmethods.net/
This is an excellent on-line textbook, which covers all topics relating to research methods, including evaluation planning and sampling.
Module 3 Worksheets
Worksheet #1
| Indicator | Data collection method | Rationale | ||
|---|---|---|---|---|
| Source of information | Tool/instrument used | Frequency of collection | ||
Worksheet #2
| Evaluation Questions | Key indicators | Information sources | Resources needed to collect info. | ||||
|---|---|---|---|---|---|---|---|
| Source | Tools to use | Frequ'y of collection | Dates | Persons | Time | ||
Module 4: Data collection methods
Learning objectives
- Knowledge of data collection methods including:
- Use of official records
- Surveys
- Standardized instruments
- In-depth interviews
- Focus groups
- Observation
- Knowledge of key considerations when designing data collection methods
- Ability to design surveys and interview questions, focus groups, and observation techniques
What is "data"?
Data is a Latin word for " information."
It sounds technical, but data collection is simply collecting information from people. There are some tricks to doing a good job at data collection. We'll learn more about those in this module.
Let's begin by looking at different sources of data (or information).
Official sources
Evaluators often use official sources of data to assess whether change occurs in a community over time. Below we have listed typical sources of this information for crime prevention projects, along with some of the pros and cons of using them.
Crime reports may underestimate actual crime, particularly for sensitive crimes such as domestic violence, sexual assault, and even some types of fraud where people are less likely to report crimes due to embarrassment or fear of community perceptions.
Police records should be treated with caution. Information on charges and arrests doesn't necessarily reflect actual rates of crime, and can be influenced by changes in legislation or policing policy (e.g., a crack down on drug trafficking). Information on convictions tends to be more reliable, but is subject to other influences such as the quality of legal representation received by the accused.
Despite these problems, arrest data tend to be one of the best measures we have of recidivism.
School records can include information on absenteeism, suspensions, academic success or failure, and special needs. Permission is required to obtain school records for individual students. Some provinces report on overall rates of academic success by school. For example, the Ontario Ministry of Education and Training provides school-level information about scores on province-wide tests administered in certain grades.
Census data can be used to describe demographic characteristics of Canadians as a whole, those living within a particular province or territory, or those living in as small an area as a census tract. (A census tract is a small area with a population of 2,500 to 8,000 within a large urban centre [Statistics Canada, n.d.]). The census provides information such as family income, education level, ethnicity, religious affiliation, housing type, marital status, or number of children in a household. This information can be used to create a community profile. But keep in mind one caution: Detailed census information, particularly that at the census tract level, is often years out of date once it is made publicly available.
Public or community health departments view "health" in the broadest sense, including physical, emotional and spiritual well-being. They are concerned with health at the individual and community level. As a result, they have interest in the area of community safety and crime prevention. Health departments have staff who analyze census data for your community. They also conduct their own community-level research. They can be a good source of information about your community. Ask your local public health department if it can provide resources or join your project partnership. Public health staff may be interested in helping you to conduct needs assessments or other community research.
Surveys
Pro: Surveys are relatively easy to administer.
Con: Surveys can be difficult to construct.
You have probably completed a survey at some point in your life. It might have been for the census, for a product or service, or as part of your job. Some skill is needed to develop a good survey.
Surveys can be administered by:
- Mail – But be aware that mail-out surveys often have low return rates.
- Telephone - Telephone interviews can be costly due to the amount of time needed to conduct surveys by phone.
- In person (self-completed or in an interview format) – Consider the literacy levels of potential respondents when you are relying on self-completion. Ensure your survey is simple to complete. Avoid complex instructions such as telling respondents to skip some questions depending on previous responses. Like telephone interviews, in-person interviews are more costly to conduct due to the amount of time required by interviewers.
- Internet or e-mail – These are the latest additions to survey methods. Response times are often faster than for other survey methods. Web-based and e-mail surveys tend to be inexpensive to administer. However, they will only reach people with Internet access and those who are comfortable using a computer. Web-based surveys often have the advantage of offering automatic data analysis.
Telephone and in-person surveys conducted in an interview format should be done in a consistent way. They should include a standardized introduction to the survey. Respondents should always be told how the information will be used and should sign a consent form that assures them their information will be kept confidential and anonymity will be protected. Interviewers should be trained to record responses accurately. Survey forms can facilitate accuracy and ease of completion by including check boxes and probable categories of responses. For example, if the survey asks respondents about their level of education, the survey form might have potential categories that can be checked off by the interviewer, such as:
- less than high school
- some high school
- high school completion
- some post-secondary
- post-secondary degree/diploma
The interviewer can then check the relevant category rather than writing the response in full.
Surveys are more difficult to construct than it may first appear:
- The wording and construction of questions requires careful thought. We present some typical problems in survey construction on the following page.
- When response options are provided for either the survey respondent or for the interviewer to facilitate recording, all possible responses should be included. Include an "other" category for anything you haven't considered. If a range or scale is used, it must be evenly balanced and include the full range of options.
- The order of questions is an important consideration. Don't begin with intrusive questions or questions that require a lot of thinking. Start with simpler, non intrusive questions such as: How did you hear about this project? Or start with simple demographic questions such as: How long have you lived in this neighbourhood? When did you first become involved in this project?
Survey tips
- Ask the right people and the right number of people – For example, don't ask partners about the quality of project delivery if they have little direct involvement in the actual delivery of the project.
- Use simple language – Avoid jargon. Don't use words like outcomes or impacts, for example. Avoid double negatives (e.g., Do you agree or disagree with the decision not to provide community-based policing?). Consider having a plain-language writer review your questionnaire.
- Be specific – For example:
- If you want to know income ranges, make sure you specify whether you want monthly or annual income, net or gross.
- When collecting intake information from children, get birth dates rather than age so you can calculate their age at each follow-up point. Given the fast pace of developmental change in the early years, exact age is more important when collecting information from children than from adults.
- If you want to know whether people found project content interesting and informative, ask the questions separately (i.e., was it interesting? Was it informative? NOT: Was it interesting and informative?)
- Measure intensity of opinion, not just the position held – Don't just ask if respondents agree or disagree, approve or disapprove, etc. Measure intensity through a range of response options such as Strongly agree, agree, disagree, strongly disagree. Avoid asking yes/no questions when a range of responses is better suited.
- Instead of asking:
Do neighbours watch out for children in your neighbourhood?- Yes
- No
- Ask:
Do neighbours watch out for children in your neighbourhood?- All the time
- Usually
- Sometimes
- Rarely
- Never
- Pilot test – Before implementing a survey, consider testing it on a few potential participants to see if it works. A pilot test will often identify problems in the wording or order of questions that you would not have otherwise suspected. For example, the way you phrase a question about income might depend on the way the typical respondent makes his or her living. People who earn a salary often know their annual income off hand, but not their weekly or hourly income. People who receive social assistance often know they're monthly income best. Fit the question to the audience. You might also be surprised that words you thought people would understand cause problems. For example, the word "lack" (as in lack of responsibility) was found to cause problems in one pilot test. The survey developers were surprised to find that many people did not know its meaning.
- Instead of asking:
What is wrong with these questions?
Try to identify the problems with the questions below.
- On a scale of 1 to 5, how would you rate this project?
- 1
- 2
- 3
- 4
- 5
- I feel safe in my community.
- usually
- sometimes
- hardly ever
- never
- Please check the age range that best represents your age.
- 20-30 yrs.
- 30-40 yrs.
- 40-50 yrs.
- 60+ yrs.
- Check the response that best represents your situation.
- No children
- Pregnant woman
- Parent with children
- Did you learn anything new about evaluation and developing your crime prevention project?
- Yes
- No
- In what areas of the housing complex do you feel unsafe?
- parking lots
- stairwells
- elevators
- hallways
- playgrounds
- other (specify)
- This project is offered to families with children aged 7-10 in the Radcliffe neighbourhood. Please indicate which of the following groups the project should be expanded to include:
- Families with younger children
- Families with older children
- Families from other neighbourhoods
Standardized tests
Don't be fooled by the word "test." There are no right or wrong answers to standardized tests. They are typically used to assess individual attitudes and behaviours. Evaluators often use them to assess changes experienced by program participants over time.
Knowledge tests can also be used to evaluate changes in knowledge that may occur as a result of an intervention.
You may already be familiar with some standardized measures such as the Rosenberg Self-Esteem Scale (Rosenberg, 1989), a self-completed measure that has been translated into many languages. You can find a copy of the Rosenberg Self-Esteem Scale at: http://www.bsos.umd.edu/socy/grad/socpsy_rosenberg.html.
Another standardized test you may be familiar with is the Child Behavior Checklist (Achenbach & Edelbrock, 1983). It comes in two versions, one completed by the child's parent and one completed by the child's teacher.
Standardized tests can also be used to assess community attributes. For example, the Sense of Community Index (Chavis, Hogge, McMillan, & Wandersman, 1986) can provide information about community cohesion. You can obtain a copy of the Sense of Community Index at http://www.capablecommunity.com/pubs/SCIndex.PDF.
Tests are "standardized" by administering them to large groups of people who, ideally, are similar to those who will complete the measure for assessment purposes. The data collected in the process of standardizing the test provide information about the way the average person completes the test. These "norms" help those who administer the test to interpret test scores. They enable the administrator to determine if a person's score is high, average, or low compared to the "norm."
Standardized tests are generally protected by copyright. Sometimes, such as in the case of the Rosenberg scale, the copyright holder allows the test to be used without cost under certain circumstances. In other cases, like that of the Child Behavior Checklist, the test must be purchased from the publisher. Some tests can only be administered by trained professionals.
Validity and reliability
As you will recall, we talked about validity and reliability in Module 3. These are especially important considerations when using assessment measures.
Validity refers to the ability of a measure to assess what it is intended to measure. "Validating" an instrument or scale normally involves administering the test along with other tests that measure similar attitudes or behaviours to a large group of people. The results are compared to determine if there is a correlation between the results of the measure being tested and the other measures already shown to measure associated characteristics. For example, the Rosenberg Self-Esteem Scale was assessed against self-reports and ratings by nurses and peers of constructs associated with self-esteem such as depression, anxiety, and peer-group reputation. When the results of the measure being tested correlate with the results of other related measures, the measure is considered to have "validity."
Reliability refers to the ability of a measure to provide consistent information over time and when completed by different groups. It is normally measured by looking at the results from tests completed by the same respondents on a number of occasions. The results are then compared from one time to another. When tests are considered to be reliable, there is little variation in responses over time. This means the test is not likely to be vulnerable to changes in mood or circumstance, which is a good thing. However, it also causes some risk when these tests are used for program evaluation. While reliability is considered a good thing, scales with good reliability ratings may be less subject to change even after an intervention has occurred.
Once a test has been validated and reliability tested, it is generally not recommended that individual researchers change the wording or items in the test. Such changes could affect the instrument's validity and reliability. On the other hand, it's important to recognize that the testing of assessment measures is often done with large groups of undergraduate students who are relatively well educated and are generally middle class, white, and American. As a result, these tests may use language that is too sophisticated or include items that are culturally based, making them inappropriate for participants in community settings. If possible, it is best to use scales that have been tested across a range of cultures and socioeconomic classes. When these are not available, try pilot testing the scales you hope to use with your participant population. This will give you an idea as to whether the test is a good fit for your participants.
Testing tips
Many people view standardized tests as the most objective way to measure knowledge, attitudes, and behaviours. The fact that standardized instruments are often widely tested and carefully researched supports this view. But there are some important factors that can influence the credibility of results on standardized tests.
- Social desirability – Sometimes test respondents answer questions in a "socially desirable" manner to please the researcher or to appear to hold attitudes or behave in a way they believe to be "desirable." Thus, parents may respond to parenting measures saying they never hit or yell at their children. Youth may respond to questionnaires saying they engage in less risky behaviours than they actually do.
- One way to overcome this problem is to include items within the test from a "social desirability" scale. These scales exist for both adults and children. They include items that, when answered in a certain way, clearly indicate a desire to present oneself in a positive light (e.g., "I never get angry" or "On occasion, I feel down-hearted or blue"). Because everyone gets angry sometimes, and everyone feels down-hearted on occasion, if a respondent says this is not the case, they are likely answering in a socially desirable manner. If the total responses on the social desirability scale suggest a respondent is answering in a desirable way, you can drop his or her response to the test measure from your sample.
- Response set – Sometimes respondents can get a bit lazy when items all seem to be assessing the same thing. They begin to check the same response each time. Here is an example of a set of questions that is likely to lead to this problem:
- I was more informed about projects I could use.
- Strongly agree
- Agree
- Disagree
- Strongly disagree
- I was better able to get help from other organizations or agencies.
- Strongly agree
- Agree
- Disagree
- Strongly disagree
- I felt more a part of the community where I live.
- Strongly agree
- Agree
- Disagree
- Strongly disagree
"Yea saying" is a form of response set. The respondent simply agrees to everything. "Nay saying" occurs when the respondent disagrees with everything.
Response set can be avoided by reversing the order of some items. In the example shown above, you could change the middle item to read: I was not able to get help from other organizations and agencies. But keep in mind that switching from positive to negative wording can make responding to questionnaires difficult for people with limited knowledge of English. - I was more informed about projects I could use.
- Literacy, language, culture – These important considerations are too often overlooked. Be aware of the characteristics of the population you serve when you choose standardized tests or any other data collection methods.
Respondents with limited literacy skills will have trouble completing written questionnaires. Those for whom English or French is not a first language can have trouble responding to both written and verbal questions. To avoid embarrassment, these respondents may pretend to understand when they have not really comprehended the question.
Avoid using sophisticated language or jargon. It's also wise to avoid idioms (for example, "feeling blue or downhearted" from our previous example). They are often unfamiliar to new Canadians and sometimes are unique to particular regions or generations.
Pilot test the scales you plan to use to see if they work with the population you serve.
In-depth interviews
In-depth interviews tend to be more qualitative than surveys, but the same rules for developing questions apply.
An interview guide can help to direct the interviewer. The interview guide looks a bit like a survey with the questions the interviewer will ask listed in the order they will be asked. Some interview guides are more flexible than others. They provide general guidance to the interviewer, but he or she is free to expand the list of questions to pursue a particular line of thought or story shared by the respondent. Other interview guides are more restrictive, restricting the interviewer to the questions included in the guide.
Depending on the nature of the interview, the interview guide might include blank spaces for the interviewer to record responses directly on the guide. Forced-choice responses are sometimes listed so the interviewer can simply check the response provided. Sometimes the interviewer is directed to read a list of possible responses to the respondent. Other times the interviewer is asked not to read the responses, but is directed to check the category that best represents the response provided by the respondent. Interview guides sometimes suggest probes to be used when respondents have trouble providing an answer.
What's a probe?
A probe is used to prompt the respondent to provide more information. Some ways to do this include:
- Repeat the question
- Ask for details
- Pause for the answer by giving a nod
- Repeat the reply
- Ask when, what, where, which, how
- Use neutral questions such as Use neutral questions such as "anything else?
Practicing with other interviewers will ensure each of you is consistent in how you interpret the questions.
We recommend that you pilot test the interview guide with a small number of people to identify potential problems. This can help to point out problems related to the interpretation of questions or to the order or the wording of questions. It will also give you an estimate of the amount of time needed to complete the interview.
Interview tips
The following tips are from Prairie Research Consultants (2001). Check out their resource on in-depth interviews at http://www.pra.ca/resources/indepth.pdf.
Before:
- Obtain written consent from the person who will participate in the interview. Ensure they are informed about the purpose and nature of the interview and how their information will be used.
- Provide respondents with an outline of issues to be discussed. Ideally, this should be done a few days before the interview takes place or when you are asking for the person's consent to be interviewed.
- Ensure the interview setting is free of distractions such as outside noise, telephone calls, or other interruptions. If you are interviewing a parent with young children, arrange childcare. Ensure the room is private.
- Ask permission if you wish to tape-record the interview. Don't rely on tape-recording alone. Have a Plan B if the interviewee refuses to be tape-recorded.
During:
- Introduce the general purpose of the research and interview, the time required, and confidentiality provisions. Use the introduction as a time to build rapport and reduce tension. Smile!
- Take notes even if you tape-record. We warned you about this in the "before" tips, but we're saying it again because it is so important. Tape-recorders can malfunction. Even if they don't, your notes will help to remind you where specific information is found on the tape.
- Let the respondent do 90% of the talking. You ask; they talk.
- Rephrase questions not understood or answered incompletely. Sometimes all you need to do is repeat the question. Other times, you may need to rephrase a question because there is a word or phrase that is not understood by the respondent.
- Ask: "Is there anything else you'd like to add?" A general question at the end will ensure the interviewee has a chance to make additional comments. These comments may reveal the need for a new line of questions. Be flexible so you get the complete story.
After:
- Check the tape recorder. You can guess why this is important.
- Write additional notes.
- Promise to get back to the respondent with feedback about the evaluation results. Make sure you do it!
Focus groups
When are focus groups useful ?
- When planning a project, to learn what the project should include
- To learn what is working or not working from key stakeholders (partners, participants, staff)
When are they no useful?
- When there is distrust or disagreement among stakeholders
- When sensitive information will be discussed
In-depth interviewing or self-completed surveys are more appropriate when sensitive information is discussed or when tension exists among stakeholders. Focus groups are used to collect data, not to solve problems.
Focus group tips
- Train facilitators/recorders - The role of the facilitator is to ensure all questions are covered and everyone has a chance to speak. Problems with sound quality can limit the usefulness of tape-recording, so it's a good idea to have someone assigned to the role of recorder. A timekeeper can help to ensure the focus group does not take longer than the amount of time participants were asked to devote to it.
- Number of participants - Less than six and more than 12 participants may inhibit discussion.
- Separate groups for each set of stakeholders - Keep different stakeholder groups separate to isolate different perspectives. When groups have different kinds of expertise (e.g., project partners vs. project participants, volunteers vs. staff, or residents living in public housing vs. those in single-family homes), one group can dominate, resulting in failure to gain all perspectives.
- Time lines - If the focus group goes much longer than 2 hours, participants will have trouble
paying attention. - Privacy - A private room free of distractions will help participants to focus and feel comfortable. It will help to protect the confidentiality of responses.
- Discussion guide - A discussion guide provides guidelines for the questions and probes you will use. Allow enough time to cover everything in the guide while allowing the flexibility to pursue new areas.
- Rapport - As with in-depth interviews, begin your focus group by describing what you are trying to learn from your evaluation or needs assessment, the purpose of the focus group, and the guidelines you will follow to ensure confidentiality of the information provided. Ask participants not to discuss the content of the focus group outside the session. Remind them that confidentiality can only be assured if all agree to this provision.
- Open-ended questions and probes - Allow people to tell stories and provide examples. Probe for specifics when answers are vague.
- Group facilitation – At the beginning of the focus group, ask people to be respectful of each other's feelings and to allow all people to speak. Often there will be a natural leader within the group who is most likely to lead discussion on each item. Watch to ensure this person's view is not influencing all others.
- Food/breaks – Food can be used as a "hook" to draw people to the focus group and to re-energize participants. Childcare and bus tickets or coverage of transportation costs can also make it easier for project participants to attend.
- Pilot test – Use your first focus group as a pilot test. You can still use the results if the focus group goes well. If it doesn't, you might need to revise your questions or other factors for future groups.
- Train facilitators and recorders
- Approximately 6-12 participants
- Hold separate groups for each set of stakeholders
- No more than two hours
- Ensure privacy
- Prepare a discussion guide, but allow flexibility
- Establish rapport/assure confidentiality
- Use open-ended questions and probes
- Don't allow one or more persons to dominate
- Offer food/provide a break midway through
- Pilot test focus group questions
Observation
Observation is often a good way to collect information about how communities or program participants respond to a particular project. Observers should be given some guidelines to help them record their observations. The observations they make can provide rich information that will enliven an evaluation report. But, first, observers should obtain permission to record what they observe.
- In project settings:
- Observers should obtain permission from participants in project settings such as drop-in or support groups. If the participants are too young to provide consent, permission should be obtained from their guardians.
- In the community:
- Permission is not always practical or needed in community settings, depending on what you are observing.
- Some examples of community observations are the amount of graffiti or litter, the number of people on the street at night, or the number of park users.
Observation tips
- Checklists/guides – Guides identify what you should be watching for during your observations. Checklists will help you to quickly tally your observations
- Systematic – It's important to ensure that observations are systematic. You are looking for specific things identified in advance and you record them each time you observe them.
- Inter rater reliability – Pretest observer checklists and guides. Consider doing a mock observation session with more than one observer following the guide and using the checklist or tally sheet to record their observations. Compare the results. Where there are differences between the observers, discuss these differences and how they should be recorded in future observations.
- Recording observations –
- If you videotape activities or events, you can review the tape later and use a checklist to record specific observations. Keep in mind that video is expensive. When people are being videotaped, signed permission should always be sought.
- Photographs are a great way to record changes in things such as the amount of graffiti in an area, the maintenance of public areas, or the use of public spaces. They can be a fun and effective way to present evaluation findings.
- Tally sheets or checklists work well for some kinds of observations (e.g., the number of people using a public space; the proportion of different groups of users such as children, teens, adults, and seniors; or the number of places marked by graffiti)
- Different times – If you are conducting observations to identify changes over time (e.g., changes in the level of use of public space), make observations before, during and immediately after the project, then at a follow-up time a few months after the project has ended. Even when observations are done to assess how effectively a program or activity is running, it is good to conduct observations on more than one occasion.
- Provide recorders with guides and checklists to tally their observations
- Be systematic
- Check "inter rater reliability"
- Consider a variety of ways to record: video, photographs, note taking
- Observe at different times
Multiple methods
You can strengthen your evaluation by collecting information about the same issue from the different groups involved in your project (e.g., partners, participants, staff, managers) and by using different methods (e.g., focus groups, observation, surveys, etc.). When all the data are collected, compare the information you obtained from the various sources and methods to see if they support or contradict each other. This is called triangulation. You will have more confidence in the findings if you know that different stakeholders told you similar things or that various methods pointed to the same results.
If, for example, if you are documenting changes in levels of vandalism, you might want to compare results across sources and methods:
- Police records of vandalism
- A survey of neighbourhood residents, businesses, and school personnel
- Photographs taken of neighbourhood locations frequently targeted by vandals
Ideally, you should collect this information at different times (e.g., before, during, and after the vandalism prevention project).
If all of the sources tell you the same thing, you can be fairly confident in the results you obtained. If there are significant contradictions in what you find, you may be aware of possible explanations for them. Or, you might want to go back to some of your sources to get their opinions on what the contradictions might mean.
Glossary of terms
Focus group
A focus group is a group of selected individuals who are invited to discuss a particular issue in order to provide insight, comments, recommendations, or observations about the issue. Focus groups are a means to collect information and can be used to assist in the evaluation of a particular program.
Interview guide
An interview guide provides structure to research or evaluation interviews. It provides instructions as to how the interviewer should introduce the interview and, if it hasn't already been done, inform the respondent of consent procedures and obtain written consent. It lists the interview questions in the order they should be asked. Interview guides can provide loose guidelines for the interviewer or precise instructions as to how to present interview questions.
Pilot test
A pilot test involves pre-testing evaluation instruments with a few representatives similar to those who will be completing the instruments for the evaluation. Problems with the instruments are noted so the instruments can be revised before the evaluation is implemented.
Probing questions (or probes)
A probe is a question that assists in bringing forth a more detailed response or additional information based on the respondent's original answer.
Social desirability
Respondents sometimes answer questions in a way they believe will please the researcher or in a way that presents their attitudes, opinions, or behaviours in a positive way. They provide what they perceive to be socially desirable responses. Standardized scales have been developed to identify whether respondents are answering questions in a socially desirable rather than a truthful manner. These are known as "social desirability scales."
Standardization
A standardized measure is one that has been administered to a very large group of people similar to those with whom the measure would be used. The data collected from this group serves as a comparison for interpreting results from participants in a program evaluation or research study. Standardized tests allow you to determine if a person's test score is high, average, or low as compared to the norm (Ogden/Boyes Associated Ltd., 2001).
Triangulation
Triangulation is a process that involves collecting information about similar questions or issues using different methods (e.g., interviews, questionnaires, focus groups) or from different sources of information (e.g., staff and participants). Responses from various sources or methods are then compared to determine if they support or contradict each other.
References
Achenbach, T.M., & Edelbrock, C. (1983). Manual for the child behavior checklist and revised child behavior profile. Burlington, VT: Queen City Printers.
Chavis, D.M., Hogge, J.H., McMillan, D.W., & Wandersman, A. (1986). Sense of community through Brunswick's lens: A first look. Journal of Community Psychology, 14(1), 24-40.
Ogden/Boyes Associates Ltd. (2001). CAPC program evaluation tool kit: Tools and strategies for monitoring and evaluating programs involving children, families, and communities. Unpublished report for Health Canada, Population and Public Health Branch, Alberta/Northwest Territories Region, Calgary, AB.
Prairie Research Associates, Inc. (2001). The in-depth interview. Retrieved September 2, 2004, from
http://www.pra.ca/resources/indepth.pdf
Rosenberg, M. (1989). Society and the adolescent self-image (revised ed.). Middletown, CT: Wesleyan University Press.
Statistics Canada. (n.d.) 2001census dictionary. Retrieved October 19, 2004, from:
http://www12.statcan.ca/english/census01/Products/Reference/dict/geo013.htm
Suggested Resources
Websites
American Statistical Association
What is a Survey?
http://www.amstat.org/sections/srms/whatsurvey.html
This electronic brochure discusses issues related to survey research such as planning, data collection, and the quality of the survey.
Bureau of Justice Assistance Center for Program Evaluation
Data Collection
http://www.ojp.usdoj.gov/BJA/evaluation/guide/dc1.htm
This website contains information and links to various data collection strategies.
Innovation Network Online Evaluation Resource Center
http://www.innonet.org/index.php?section_id=62&content_id=142
This website presents information and helpful suggestions related to survey research. Also available is a resource on data collection instruments.
Management Assistance Program for Non-Profits
Basic Guide to Program Evaluation
http://www.managementhelp.org/evaluatn/fnl_eval.htm#anchor1585345
This website provides helpful information about data collection methods including questionnaires, focus groups, and surveys.
University of Wisconsin
Program Development and Evaluation
http://www.uwex.edu/ces/pdande/evaluation/evaldocs.html
This user-friendly website offers many links relating to all aspects of data collection.
Manuals and Guides
Duval County Health Department
Essentials for Survey Research and Analysis: A Workbook for Community Researchers
http://www.tfn.net/%7epolland/quest.htm
This workbook is comprised of 12 lessons ranging from how to identify different levels of data to collecting and reporting data. It focuses on survey research.
National Science Foundation
User Friendly Handbook for Project Evaluation
http://www.nsf.gov/pubs/2002/nsf02057/nsf02057.pdf
This handbook provides detailed information about various data collection methods, including helpful tips and examples.
National Science Foundation
User-Friendly Handbook for Mixed Method Evaluations
http://www.ehr.nsf.gov/EHR/REC/pubs/NSF97-153/pdf/mm_eval.pdf
This user-friendly guide provides information about qualitative and quantitative evaluation designs and the data collection methods associated with each.
Horizon Research Inc.
Taking Stock: A practical guide to evaluating your own programs.
http://www.horizon-research.com/reports/1997/stock.pdf
This practical guide is an excellent resource that explains how to collect both qualitative and quantitative data. It proposes several strategies for data collection.
Textbook
Trochim, William M. (2000).
The Research Methods Knowledge Base, 2nd Edition.
http://www.socialresearchmethods.net/
This on-line textbook covers research methods.
What is wrong with these questions? (see p. 5)
- Vague, ambiguous wording
- Rate the project on what? – satisfaction, quality, accessibility??
- Rate what aspect of the project? – content, staff, location, service, specific components?
- What do the numbers represent? Is 1 extremely satisfied and 5 extremely unsatisfied?
- Some researchers prefer to avoid scales with a midpoint like the one shown in this question (i.e., scales with an odd, as opposed to an even number of responses). When there is a true midpoint, respondents who are uncertain what they think will often choose this middle score. This, unfortunately, doesn't tell the researcher too much. Using a four-point scale can force the respondent to select a response that leans in one direction or another.
- The scale with forced choice responses is not evenly balanced
- The options are unbalanced because there is one positive, one neutral, and two negative responses.
- The response categories are not exclusive
- There is overlap between the age groups (e.g., if you are 30, you could check either of the first two categories).
- The response categories are not exclusive
- The respondent could be pregnant but also a parent with children OR a person with no children. How does she decide which option to check?
- Double-barrelled question
- Ask separately: Did you learn anything new about evaluation? Did you learn anything about developing your crime prevention project?You might also want to change Yes/No to something like: Learned A lot, Learned Some, and Learned Very Little/Nothing Better yet, change it to a qualitative question.
- Leading question
- The question assumes areas are unsafe. It should be preceded by a question asking if the respondent feels unsafe in the housing complex. If not, a note should instruct the respondent to skip this question and move on to the next.
- Leading question
- The question assumes the project should be expanded.
Module 4 Worksheets
Worksheet #1 Survey writing and interviewing
Instructions:
- Review pages 2-10 of this handbook.
- Assign a facilitator, a recorder, and a timekeeper.
- Prepare a survey or interview guide on the assigned topic. If you were assigned to Group 1, you will develop a survey. If you were assigned to Group 2, you will prepare an interview guide.
- Photocopy the recorder's version of the survey/interview guide, making enough copies for each member of your group.
- Group 1 surveys Group 2.
- Group 2 interviews Group 1.
Recorders: You are preparing the survey or interview guide for all group members, so make sure everyone can read your writing.
Surveyors: Include true/false, rated scales, multiple choice, and open-ended questions in your surveys.
Interviewers: Include both open-ended questions (those that leave the response open to the respondent) and close-ended questions (those that provide a fixed menu of responses) in your interviews.
Survey tips
- Ask the right people and the right number of people
- Use simple language
- Be specific
- Measure intensity of opinion, not just the position held
- Pilot test
- Avoid vague, ambiguous wording; scales that aren't evenly balanced; fixed responses that overlap, double-barreled questions, leading questions
Use the space below and the following page to develop your survey or interview guide. Use the back of the page if you need more space.
Interview tips
Before:
- Provide respondents with an outline of issues to be discussed
- Ensure the interview setting is free of distractions
- Ask permission if you wish to tape-record the interview
During:
- Introduce the general purpose of the research and interview, the time required, confidentiality provisions
- Take notes even if you tape-record
- Let the respondent do 90% of the talking
- Rephrase questions not understood or answered incompletely
- Ask: "Is there anything else you'd like to add?"
Worksheet #2 Focus groups and observations
Follow the instructions on the flip chart.
Use the space below to develop your focus group or observation guide. When you are done, photocopy the recorder's version of the guide, making enough copies for each member of your group.
Focus group tips
- Train facilitators and recorders
- Approximately 6-12 participants
- Hold separate groups for each set of stakeholders
- No more than two hours
- Ensure privacy
- Prepare a discussion guide, but allow flexibility
- Establish rapport/assure confidentiality
- Use open-ended questions and probes
- Don't allow one or more persons to dominate
- Offer food/provide a break mid-way through
- Pilot test focus group questions
Observation tips
- Provide recorders with guides and checklists to tally their observations
- Be systematic
- Check "inter rater reliability"
- Consider a variety of ways to record: video, photographs, note taking
- Observe at different times
Module 5: Evaluation desig n
Learning objectives
- Know what is meant by "evaluation design"
- Understand the different levels of evaluation :
- Program monitoring
- Process evaluation
- Outcome evaluation
- Understand the strengths and weaknesses of the main designs used in outcome evaluation:
- Posttest only designs – for single groups and for comparison groups
- Pre-posttest designs – single and comparison groups
- Times-series designs – single and comparison groups
In previous training modules, we reviewed various methods for collecting quantitative and qualitative measures of project performance. In Module 6, we will be taking a more detailed look at the analyses of these measures. The current module focuses on evaluation designs, or the ways in which we estimate the impact of project activities.
What is evaluation design?
An evaluation design involves:
- A set of quantitative or qualitative measurements of project performance and
- A set of analyses that use those measurements to answer key questions about project performance.
Evaluation designs include ways to describe project resources, activities, and outcomes as well as methods for estimating the impact of project activities (Wholey, Hatry, & Newcomer, 1995).
Levels of evaluation
Before we discuss evaluation designs in more detail, we'll review the different levels of evaluation.
Project monitoring involves counting specific project activities and operations. It tracks how or what the project is doing. For example, you might track how many activities you offer, how many staff are involved, how many hours they work, how many participants attend activities, how many partners are involved and whether these things change over time. You probably do this already!
Process evaluation assesses project processes and procedures and the connections among project activities. Process evaluations ask how the project is operating and how to make it better. For example, you might want to know whether your project is reaching who it intended to reach. Are activities occurring in the way they were originally planned? Is the number of participants affecting staff workloads or the amount of service available to participants?
Outcome evaluation assesses project impact and effectiveness. For example, a project working with youth at risk of involvement in crime or victimization might ask questions such as: Did participants stay in school longer? Did they have less contact with police or become victims less often? How can the program be improved to better meet its goals? Good outcome evaluations include some project monitoring and process evaluation.
Most evaluations include components from each level. We are going to focus on designs for outcome evaluations.
Threats to the validity of evaluation results
In Module 3, we talked about the importance of choosing indicators that are valid. The validity of the evaluation design as a whole is just as important as the validity of the specific indicators you choose. There are a few kinds of validity (see sidebar on the next page), but we are going to focus on internal validity.
Internal validity refers to the extent to which we can feel confident that the changes an evaluation identifies in the community or among project participants are, in fact, the result of the project. Choosing an evaluation design that rules out alternative explanations for your results best ensures its internal validity.
We'll show you some of the typical threats to the internal validity of evaluation results. A strong evaluation design will counter these threats. It will increase your confidence that the results you find are due to your project and not to outside factors.
History – Remember Sir John A.? He represents a different kind of history than what we want to tell you about. The kind of history we're referring to is an outside event not related to your project that influences the changes your evaluation is able to track over time. There might have been some "history" in the community that influenced the changes you detect but that is not related to your project.
For example, a project focused on reducing substance use may choose to use police charges as an indicator of change. If changes to police policies about laying charges for simple possession took place during the project time frame, using this indicator could lead to a misinterpretation of the effects of the project. An increase or decrease in the number of charges might be interpreted to mean there was a change in substance use when, in fact, the increase or decrease resulted from a change in police policies.
Maturation – Maturation refers to the changes that occur naturally due to the passage of time. For example, children change as they grow up. Change in their behaviour or attitudes over time might just reflect the normal process of maturation.
Studying developmental changes in children and youth can be especially difficult because they naturally experience change as they mature, regardless of their involvement in projects. To rule out this threat, you could compare the changes experienced by the project participants to those experienced by members of a comparison group not involved in the project. If the project group experienced similar changes to those of the comparison group, it would suggest the changes might simply have been due to maturation. If the changes experienced by the project group exceeded those experienced by the comparison group, you could be more confident that the changes were not the result of maturation alone, but resulted from the project activities.
Other types of validity
Here are definitions of three other types of validity:
- External validity – the extent to which the findings from an evaluation can be generalized – or expected to occur – in other projects or communities similar to the one studied.
- Construct validity – the extent to which the project activities and the setting in which they are offered – as well as the measures used to assess change and the samples of participants selected for assessment purposes – fit with theories about why certain crime prevention activities are expected to produce certain outcomes (Clark, 1999).
- Statistical conclusion validity – the extent to which the analysis and measurement of variables (such as changes in attitudes or behaviours) is done in a way that limits errors that either a) fail to capture real program effects or b) mislead the researcher to believe changes have occurred when they have not.
Too much information!?
If this just seems like "too much information," don't worry. You don't need this level of detail. (We just thought you might be interested!) The main thing to remember is that threats to validity are factors other than participation in project activities that lead to change in the group being studied. Validity threats can lead to false conclusions about your project's ability or failure to obtain the results you anticipated.
Selection - The threat of selection results from the fact that people who choose to join your project activities might be different from those who do not.
For example, a project offering workshops about fraud against seniors might draw seniors who are more likely to seek out information, making them less vulnerable to fraud in the first place. This is another good reason to use a comparison group whenever possible. If you could look at change among those seniors who came out to project workshops and compare them to a similar group of seniors who did not participate, you could rule out the threat of selection.
However, you would want to ensure that no bias was involved in selecting members of the participant and comparison groups. We talk more about ways to avoid selection bias in project and comparison groups at the end of this module when we discuss experimental and quasi-experimental designs.
Experimental designs help to reduce selection bias. Participants are randomly assigned to a project and a comparison group.
When random assignment is not possible, quasi-experimental designs can be used. They use other means to create a comparison group, while still attempting to control for selection biases. For example, a comparison group might be drawn from a waiting list for the project or from a similar community that has members with similar histories to those of the project's participants.
Mortality – Mortality has some similarities to the threat of selection. It results when the analysis of change focuses on participants who complete an activity. Those who complete an activity might be those who were most motivated to succeed, while those who dropped out might have been more at risk in the first place.
For example, let's say a project focusing on anger management asked participants to complete a questionnaire about anger management before and after the program. The handcuffs represent those participants who were charged with offences and incarcerated before the program ended. When it came time to do the post-test, they weren't available to be tested so their scores could not be included in the post-test average. Yet they were likely more at risk to begin with, while those who completed the program were probably most likely to succeed even without the program. For this reason, it is a good idea to collect some additional information about participant history and demographics at pre- and posttests. Then you can compare those who drop out and those who stayed in the project to see if they differed in some way from the outset.
Testing – The more often you measure something, the more familiar participants will be with the test. Their responses might be influenced by how they responded the first time. This is a good reason to avoid doing pre- and post-tests within too short a period of time.
Instrumentation – Sometimes the test or questionnaire you use as an indicator is itself a problem. For example, if your evaluation used two interviewers who asked the same set of questions in different ways or who recorded the responses differently, the results from the interview might differ because of the way the interview was administered rather than because of the effect of the project.
Statistical Regression – Sometimes factors such as having a particularly bad day or not getting enough sleep the previous night might result in some participants scoring lower on a pretest measure than they would score under normal circumstances. This is particularly true when the pretest measure has a low reliability rating. (In Module 4 we explained that reliability means the measure provides consistent information over time). If those participants who had very low scores then complete the posttest measure on a more normal day, their score will likely improve, but at least part of this improvement will not be due to the program or intervention they received. Generally, very high or very low pretest scorers often move closer to the mean score over time. This is called "regression to the mean" or statistical regression. This threat to validity is particularly a problem when participants are placed in an experimental group based on the more extreme scores they received on the pretest.
Evaluation design
In the earlier training modules we have talked about:
- Identifying the questions you want your evaluation to answer
- Selecting indicators that will help you to answer these questions
- Deciding who to collect information about these indicators from (data sources) and how you will do it (methods of data collection).
As you are considering your data collection methods, you will also need to consider the design of your evaluation:
- What design will best suit the project you wish to evaluate?
- How will the design counter potential threats to validity?
Design #1: Single group posttest only
Let's say:
X = your project intervention
O = when you will measure or assess project change
If participants are involved in your project activities and you measure the outcomes afterward, it would look like this:
X: What your project does.
O: When you measure the outcome.
What your project does. When you measure the outcome.
Let's say your project involved activities to increase youth pride in their cultural heritage. This is represented by X.
After these activities, project staff asked youth who participated in the activities to answer some questions to assess their knowledge about their culture, their feelings of belonging, and their pride in their culture. 0 represents this assessment.
Your evaluation involved an assessment of the project outcome at one point only: after the activities occurred.
Some questions:
Looking back at the list of threats to validity, what threats do you think this design might be vulnerable to? What would you compare the outcomes to?
How will you know the outcomes are a result of the project and not from outside factors? What do you know about how much youth knew about their culture and how they felt about their culture before they became involved in the program?
What do you know about the intervention experienced by participants or the activities aimed at achieving the outcomes? What changes would you recommend to the design to help answer these questions?
Design #2: Single group pre- and posttest
Once again, let's say:
X = your project intervention
O = when you will measure or assess project change
If you measure the change before and after the program, it would look like this:
O: Pretest assessment
X: Project activities
O:
Posttest assessment
Let's say this is the same project we discussed on the previous page. This time youths' knowledge of their culture, their feelings of belonging, and their pride in their culture were measured before the project activities and then again afterward.
Here are some questions to help you think further about this design.
Questions:
Is this design better than the posttest only design ?
What threats to validity is it vulnerable to?
What would you compare the outcomes to?
How will you know the outcomes are a result of the program and not from outside factors? What do you know about how much youth knew about their culture and how they felt about their culture BEFORE they became involved in the program?
What do you know about the intervention experienced by participants or the activities aimed at achieving the outcomes? What changes would you recommend to the design to help answer the questions that remain unanswered?
Design #3: Comparison group posttest only
In this design, you measure the results for participants involved in your project after the project activities. You use the same measure with a second group that was not involved in your project. You test the second group at the same time as you test project participants.
O1 = the assessment of project participants
O2 = the assessment of a comparison group
If you were to use the symbols to show how this design works, it would look like this:

There is no X for the comparison group because they did not participate in an intervention.
If we go back to our previous example, in this design the youths' knowledge, feelings of belonging, and pride in their culture were measured after the project activities AND we have a comparison group whose members were not involved in the project and who were tested at the same time.
Questions:
What do you think of this design?
Is it better or worse than the previous designs?
What threats to validity is it vulnerable to?
What would you compare the outcomes to?
How will you know the outcomes are a result of the program and not from outside factors?
What do they know about how much youth knew about their culture and how they felt about their culture BEFORE they became involved in the project?
How do you know that the comparison group was treated differently than the project group? What changes would you recommend to the design to help answer the questions that remain unanswered?
Design #4: Comparison group pretest and posttest
This design involves measuring the results for participants involved in your project before after the project activities. The same measures are used with a second group not involved in your project. You test them at the same times as project participants.
If you were to use the symbols to show how this design works, it would look like this:

As with Design #3, there is no X for the comparison group because they did not participate in an intervention.
Let's go back to our sample project to increase young people's pride in their cultural heritage. In this design, participants' knowledge, feelings of belonging, and pride in their culture were measured before and after the project activities. A comparison group whose members were not involved in the project was tested at the same times.
Questions:
What do you think of this design?
Is it better than the previous designs ?
What threats to validity is it vulnerable to?
What would you compare the outcomes to?
How will you know the outcomes are a result of the program and not from outside factors?
What do you know about how much youth knew about their culture and how they felt about their culture BEFORE they became involved in the project?
How do you know that the comparison group was treated differently than the project group?
Design #5: Time-series designs
Most community groups involved in crime prevention through social development are unlikely to have the resources or time to do a time-series design. But in some cases, these may be possible, so we are providing a brief outline of these designs. Time-series designs are similar to pre-posttest designs except they take measurements a few times before the project takes place and an equal number of times after it takes place. Time-series designs can involve a single group only or a comparison group. Using the symbols we've used to depict the designs on the previous pages, we provide some sample designs.
A single-group time-series design might look like this:
![]()
In this case, assessments are taken at three different times before the project activities and at three times after the project activities.
A comparison-group time-series design might look like this:
![]()
As with the single-group example, the pattern shown here includes pre-assessments at three different times – this time involving both the project and the comparison group – and post-assessments on three different occasions after the project activities are complete.
A single-group interrupted time-series design would look like this:
![]()
Interrupted time-series designs take measurements between components of an intervention or project to get a better sense of how the different parts of the intervention work together to produce outcomes. In this case, assessments are done on two occasions before a project activity or a set of project activities take place. Assessments are again made on two occasions after the activity or set of activities. Another project activity or set of project activities then takes place and assessments are made on two later occasions.
A comparison-group interrupted time-series design would look like this:
![]()
The pattern shown here is the same as that of the single-group design. A comparison group that receives assessments at the same time as the project group is added to this design.
Generally, time-series designs can be stronger than their pre-post counterparts. Analysis of time-series results can give a better idea of trends. For example, if you take measurements every three months, three times before the project occurs and three times afterward, you can see if the period over which the project took place led to a clear change in the outcomes. A comparison-group time-series design will strengthen your ability to attribute those outcomes to the project and not to other outside factors.
These designs face similar threats to validity as their pre-posttest counterparts. Testing can pose a more serious threat to time-series designs when measures such as questionnaires are administered directly to participants because they are taken frequently throughout the evaluation period. This will not be the case if the measures used are school attendance records, grades, or police reports that do not involve participants directly. One thing to keep in mind with time-series designs: Statistical analyses of these designs can be very complex.
A word about comparison groups
It is clear from what we've learned so far that the use of a comparison group in an evaluation will strengthen our ability to draw conclusions about effectiveness. Yet we all know this ideal is not so easy to accomplish. It is often very difficult for evaluations of community-based programs to obtain a reasonable comparison group. So what can be done to strengthen your conclusions in the absence of a comparison group? Here are a few suggestions:
- Collect narrative information about possible outside events that could affect results found in a single-group design.
- Compare results found in the project group to those found in published literature.
- Use standardized tests so you can compare the results of participants to the norms for the test.
Use your creativity to think of other ways to strengthen your findings.
Further words of caution.
If you can find a comparison group to strengthen your evaluation design, it's important to recognize that some comparison groups are better than others. First, here is the "gold standard" in evaluation design:
Random selection is used in what is known as experimental design. Participants are randomly assigned to either the comparison or the experimental (intervention) group. For example, youth who have been in trouble with the law might either be assigned to a program to reduce further conflict with the law or to a non-program group from which comparable information is obtained. They are assigned to either the project group or the
comparison group in a random way (e.g., every second youth goes to the alternate group). This helps to ensure there are no systematic differences between the two groups.
Often random selection is not possible so we instead try to construct a comparison group from a readily accessible group of similar candidates. For example, in the case of the program for youth in conflict with the law, we might ask youth on a waiting list or youth from a similar neighbourhood to participate in the comparison group. This is known as a quasi-experimental design. In quasi-experimental designs it is important to ensure both groups are comparable. Demographic information such as information about age, ethnicity, level of education, income, and previous encounters with the law is collected from both groups to help us determine if the comparison group is comparable to the intervention group.
Glossary of terms
Comparison (or control) group
A comparison group is called a control group in laboratory settings. Since researchers have far less "control" over community-based settings, it is known as a comparison group in this context. The comparison group is made up of people who have similar characteristics to participants in the project being evaluated, but who do not receive exposure to the project.
Experimental group
An experimental group is a group of people who participate in an intervention (or project). The outcomes experienced by the experimental group can be compared to those of a comparison group who do not receive the intervention. The comparison group should have similar characteristics to those of the experimental group, except that they do not receive the intervention under study. The difference of effects between the two groups is then measured.
Pre-post testing
Pre-post testing involves administering the same instrument before and after an intervention or program.
Random selection
Random selection means that people (or communities) have an equal opportunity of being selected to be part of either a comparison or an intervention group. Whether any one individual or community is selected to be part of one group or the other is determined by chance.
Sample
A sample is a subgroup of a larger population. It is studied to gain information about an entire population.
References
Clark, A. (1999). Evaluation research: An introduction to principles, methods and practice. Thousand Oaks, CA: Sage.
Wholey, J.S., Hatry, H.P., & Newcomer, K.E. (1995). Handbook of practical program evaluation. San Francisco: Jossey-Bass.
Suggested Resources
Websites
North Central Educational Regional Laboratory (NCREL)
Evaluation Design and Tools
http://www.ncrel.org/tandl/eval2.htm
This website provides information about evaluation design. It answers three main questions: Why should you evaluate your project? What should you evaluate? How should you evaluate? Common threats to validity are discussed.
Northwest Regional Educational Laboratory
Impact Evaluation
http://www.nwrac.org/whole-school/impact_c.html
This website offers helpful information on various evaluation designs and models.
Manuals and Guides
National Science Foundation
User-Friendly Handbook for Mixed Method Evaluations
http://www.ehr.nsf.gov/EHR/REC/pubs/NSF97-153/start.htm
This user-friendly guide provides information about both qualitative and quantitative research designs.
Treasury Board of Canada
Program Evaluation Methods: Measurement and Attribution of Program Results, Vol. 3
http://www.tbs-sct.gc.ca/eval/pubs/meth/pem-mep_e.pdf
This guide addresses various methodological considerations. It includes an extensive chapter on evaluation designs and strategies.
The Urban Institute
Evaluation Strategies for Human Services Programs
http://www.urban.org/url.cfm?ID=306619
This guide provides insight into various evaluation issues, including a comprehensive section on developing an evaluation design.
Books
Trochim, William M. (2000).
The Research Methods Knowledge Base, 2nd Edition.
http://www.socialresearchmethods.net/
This on-line textbook guides the user through evaluation design and the strengths and weaknesses associated with various designs.
Evaluation design questions (pp. 5 - 9)
Design #1
What threats do you think this design might be vulnerable to?
It may be vulnerable to all threats except testing (unless participants had previously been exposed to the test in some other situation). It's hard to know for sure whether it is vulnerable to problems with instrumentation or statistical regression because we don't know whether the test was a good measure of the outcome, whether it was administered in a consistent manner, or how the participants would have scored before the program.
What would you compare the outcomes to?
There is nothing to which the results can be compared.
How will you know the outcomes are a result of the program and not from outside factors?
There is no way to know this for certain.
What do you know about how much youth knew about their culture and how they felt about their culture BEFORE they became involved in the program?
There is no way to know this for certain.
What do you know about the intervention experienced by participants or the activities aimed at achieving the outcomes?
You won't know this without conducting a process evaluation or doing some kind of project monitoring. If process information about how the intervention was delivered is not collected, it's hard to draw conclusions about what worked or did not work.
Design #2
What threats to validity is it vulnerable to?
It may be vulnerable to all threats to validity. It's hard to know for sure whether it is vulnerable to problems with instrumentation because we don't know whether the test was a good measure of the outcome or whether it was administered in a consistent manner.
What would you compare the outcomes to?
This time you can compare the outcome to the pretest results.
How will you know the outcomes are a result of the program and not from outside factors?
Once again, there is no way to know this for sure.
What do you know about how much youth knew about their culture and how they felt about their culture BEFORE they became involved in the program?
The pretest will tell you something about the youths' knowledge and feelings before their involvement in the program.
What do you know about the intervention experienced by participants or the activities aimed at achieving the outcomes?
Once again, you won't know this without doing a process evaluation or project monitoring.
Design #3
What threats to validity is it vulnerable to?
It is less vulnerable to history, maturation, selection and mortality than the single-group designs. However, there could be a selection bias in determining who is in the comparison group and who is in the program group. Random assignment to these two groups would address this concern. It is likely to be vulnerable to testing only if the participants were previously exposed to the test in some other situation. It is hard to know if it's vulnerable to instrumentation or statistical regression because we don't know whether the test was a good measure of the outcome, whether it was administered in a consistent manner, or how the participants would have scored before the program.
What would you compare the outcomes to?
You can compare the outcomes for the project group to those for the comparison group. If the outcomes are better for the project group than the comparison group, this is an indication that the project has had an effect.
How will you know the outcomes are a result of the program and not from outside factors?
If the project participants do better than the comparison group, it suggests the project made the difference. However, you cannot be certain about this without knowing if there were differences between the comparison and project groups at the outset. It would also help to know something about any influences affecting the comparison group.
What do you know about how much youth knew about their culture and how they felt about their culture BEFORE they became involved in the project?
You won't know this with this design.
How will you know that the comparison group was treated differently than the project group?
You would need to document the project activities and know more about any activities to which the comparison group might have been exposed.
Design #4
What threats to validity is it vulnerable to?
It is less vulnerable to all threats to validity. However, there could still be a selection bias in determining who is in the comparison group and who is in the program group. Random assignment to these two groups would address this concern. This design may be vulnerable to testing if the pre- and posttests are administered too close together in time. It is hard to know if it's vulnerable to instrumentation because we don't know whether the test was a good measure of the outcome or whether it was administered in a consistent manner.
What would they compare the outcomes to?
You can compare the change over time between the project group and the comparison group. This helps to rule out most threats to validity, provided the two groups are comparable at the outset.
How will you know the outcomes are a result of the program and not from outside factors?
If the project participants do better than the comparison group, it suggests the project made the difference. However, some doubt remains unless we know something about the influences affecting the comparison group and the extent to which the program and comparison groups were comparable at the outset.
What do you know about how much youth knew about their culture and how they felt about their culture BEFORE they became involved in the project?
You will have this information from the pretest.
How do you know that the comparison group was treated differently than the project group?
You would need to document the project activities and know more about activities to which the comparison group might have been exposed.
Module 5 Worksheets
Worksheet #1 Evaluation Design
Design Type:
Proposed measures, when they will be administered, and who will administer them:
Strategies/rationales for dealing with threats to validity:
1 – History
2 – Maturation
3 – Mortality
4 – Testing
5 – Instrumentation
Module 6: Analyzing data and reporting resultsFootnote 1
Learning objectives
- Understand the role of art and science in analysis
- Know key steps of analysis
- Understand simple quantitative analysis and main methods of qualitative analysis
- Understand when to use different types of graphs
- Know key reporting requirements and how to focus evaluation reports
The art of interpreting data
Evaluation is part art, part science. If you are analyzing numerical data, it's important to keep in mind that the numbers you obtain are not outcomes in themselves but indicators of the outcome. Need a reminder of what an indicator is?
An indicator is a variable (or information) that measures one aspect of a program or project. It indicates whether a project has met a particular goal.
But indicators don't tell the whole story. They should be reported in the context of the factors that may influence them. This is part of the art of reporting results. Factors that can influence results include:
- Participant influencing factors – These are the characteristics of project participants – or of the communities served by a project – that could influence the project's outcomes. They might include:
- Demographic characteristics of participants such as age, gender, or education;
- Factors that reflect the degree of difficulty of participants' personal lives – for example, participants may have limited incomes, inadequate housing, a history of abuse, medical or health problems, or a history of crime or victimization;
- Characteristics of the residents involved in a community development project or the type of community it serves – for example, whether it is urban or rural, a geographically remote community, or a high-density neighbourhood.
- Program influencing factors – These are the characteristics of the program or project. They include:
- Type of intervention or activities;
- Duration and intensity of the intervention;
- Situational factors such as the extent of staff turnover, the accessibility of the project location, or even the fact that bad weather prevented people from attending project activities.
- Process influencing factors - This refers to factors related to the evaluation itself:
- Size of the sample;
- Completeness of the data obtained;
- Whether data were collected in a consistent way - for example, whether there was a high level of interrater reliability (we discussed this concept in Module 4);
- Timing of data collection - for example, whether data were actually obtained at the time of participants' entry to and exit from the project;
- Methods of data collection - for example, whether the information collected was self-reported by participants, resulted from staff observation, etc.);
- How well the questions asked in the evaluation were understood;
- Relevance of the questions asked to what the evaluation intended to measure.
The art of interpreting data
- Keep in mind that numbers are not outcomes, but indicators of outcomes
- Include the context provided by participant, program, and process-influencing factors
- Consider different methods of analysis
- Consult with others about:
- Most appropriate methods of analysis
- Interpretation/possible explanations of results
It is best to consider how you will analyze your data before you begin collecting it. Your plan of analysis should be part of your evaluation plan. Be open to different methods of analysis. It is always a good idea to consult others who can give you advice about the best way to analyze the data you hope to obtain. As you plan your evaluation, talk to academics, consultants, or others in the field of crime prevention through social development to gain ideas on the most appropriate methods of analysis. Once you have analyzed the data, participants, partners, and staff might be able to shed light on possible explanations for the results you obtain. Include them in your consultations about how to interpret your evaluation results.
The science of analyzing data
While art is involved in the interpretation and reporting of data, there is only room for science when recording and analyzing results. This is one place where accuracy and attention to detail are essential.
Imagine the consequences of mistakenly entering in the wrong column of a database the scores obtained from project participants on measures of behaviour or attitudes. This would lead you to draw conclusions based on inaccurate information. Or think about the consequences of basing conclusions on participants' responses to questions they had consistently misunderstood. These examples give you an idea of why it is important to take care in implementing all aspects of your evaluation.
Here are some things to watch:
- Misunderstood questions - Pilot test questionnaires or interview questions to ensure they are understood, especially when participants speak English or French as a second language or have less than high school education.
- If you added skip patterns in questionnaires (i.e., questions like "if participant has no children, skip to Question X"), make sure they were followed correctly.
- Data entry - Complete quality checks of your data to ensure all figures are correctly entered in databases. Look for out-of-range responses. For example, if you see information for an eight-year-old child entered in your database when your project serves 16-18 yr. olds, you can guess that there was a data entry error. Check that scores have not been entered in the wrong column of a database.
- Reliability checks - If two or more people are completing observations, test their ratings to ensure independent observers would rate the same observation in the same way.
- Quality checks - Check to ensure your data make sense. For example, if program staff are recording the ethnicity of project participants and there appears to be an unusually high number of French and Spanish participants, use your knowledge of your community to verify the information. Are there lots of immigrants from France and Spain or were they misidentified and should rightfully have been recorded as francophone Canadians and Latin American?)
The science of analyzing data
Make sure qualitative and quantitative data are accurate and complete:
- Questions were understood, forms were completed consistently
- Data were entered correctly
- Reliability checks were used
- Quality checks are in place
Key steps in data analysis
- Check data for accuracy and completeness.
- Organize the data. Try a few different ways to organize and describe it.
- Set a benchmark for success. What are you hoping for or expecting?
- Think about the results. Did the results meet your expectations? Were they good or bad?
- Try to explain the results. What could explain the results? Ask staff, participants, or partners for their thoughts. Compare with other projects if information is available. Look for trends if you are collecting data over time.
Analyzing results
As we mentioned in Module 3, analysis involves sorting out the meaning and value of the data you have collected. In that module we provided you with descriptions of basic terms used in data analysis. We have included them again in the box shown on this page.
Frequencies and Percentages
Let's say we asked 472 people whether they agreed, disagreed, or had no opinion on whether they felt safer in their neighbourhood after a community worker had organized a series of workshops that brought neighbourhood residents together to discuss common issues of concern and to get to know each other better.
| Response | Frequency | Percentage |
|---|---|---|
| Agree | 288 | 61% |
| Neutral | 112 | 24% |
| Disagree | 72 | 15% |
| TOTAL | 472 | 100% |
You probably already know how to calculate a percentage. Just in case, we'll use the number of people who agreed to the statement to demonstrate how it is calculated.
The number of respondents who said they agreed with the statement (288) are divided by the total number of respondents (472) then multiplied by 100 to provide the percentage of respondents who agreed that their neighbourhood felt safer (61%).
288 ÷ 472 x 100 = 61%
% of total responses = Frequency of response ÷ total number of responses × 100
- Frequencies - how frequently certain responses were provided (simply count the number).
- Percentages - What percentage of respondents said a rather than b or c. You might even want to get a bit more sophisticated and show how the percentages differed across groups compared to the whole.
- Mean - the average response. This can be influenced by extreme responses (i.e., either much higher or much lower than average). If this is likely to occur, consider providing the median response too.
- Median - the middle response when responses are ordered from highest to lowest.
- Mode - the most frequently provided response.
| Age | Agree % (Freq) | Neutral % (Freq) | Disagree % (Freq) | Total % (Freq) |
|---|---|---|---|---|
| Age 18-29 | 31% (38) | 25% (31) | 44% (55) | 26% (124) |
| Age 30-59 | 58% (114) | 36% (71) | 6% (12) | 42% (197) |
| Age 60+ | 90% (136) | 7% (10) | 3% (5) | 32% (151) |
| TOTAL | 61% ( 288 ) | 24% (112) | 15% (72) | 100% (472) |
You can provide more information by further breaking down the frequencies and percentages by the different categories of people who responded. For example, you could break the neighbourhood residents down by age, gender, level of income, housing type, or any other factor that is likely to influence people's perceptions.
In the table above, we categorized the responses of the neighbourhood group by age. The table shows the percentage and the frequency (in brackets) of responses for each age group. The underlined figure shows the percentage of residents from 18 to 29 years of age who agree that the neighbourhood feels safer. This age group represents 26% of the total group of respondents. The row and the column labeled TOTAL should always add up to 100%.
Statistical significance
If you had collected the opinions of neighbourhood residents before the series of workshops had begun, you could break the responses down by those received before (pre) and after (post) the project. This would show you whether residents' views changed from before to after the project. Of course, as we know from Module 5, you would have to be cautious in attributing this change to the workshop series without having similar information from a comparison neighbourhood that was not exposed to the workshops. There are more sophisticated statistical calculations that can tell you whether the differences in opinions before and after a program or intervention are "statistically significant" and unlikely to have occurred due to chance.
The higher the level of significance, the less likely the result is due to chance. If a result is significant at the .01 level, there is a one-in-100 likelihood (or probability) that it is due to chance.
Why .01? Because 1 ÷ 100 = .01 Thus, .01 represents a one-in-100 likelihood of being due to chance.
1 ÷ 1000 = .001 or a one-in-1,000 likelihood of being due to chance.
1 ÷ 20 = .05 or a one-in-20 likelihood of being due to chance.
You will often see results from a research study or evaluation listed at a certain level of significance. For example, you might see: p < .01. This means the probability of a result being due to chance is less than one in one hundred.
General practice in professional journals has been to report findings with a minimum .05 probability level. Someone with expertise in statistics can advise you on the recommended probability level for your analysis. If your sample size is very large, there is a greater likelihood of results being due to chance, so higher levels of significance are generally required.
Most statistical tests require that certain assumptions about the data being analyzed be met. For example, when comparing means from two separate groups using a t-test, we assume the samples are drawn from populations with a normal distribution and equal standard deviations. A normal distribution means most scores fall around the centre with a smaller, but equal proportion falling toward either end of the range of scores. A graph of a normal distribution looks a bit like a bell, so it is sometimes referred to as a "bell curve."
Normal distribution or "bell curve"

We won't get into the specifics of what a standard deviation is. A simple definition is that it is a measure of the extent to which scores are spread between the highest and lowest scores and deviate from the mean or average score. The standard deviation increases in proportion to the spread of the scores.
Rather than make things too complicated here, we have included some resources at the end of this chapter to help you learn more about variance and standard deviations. We have also provided a more technical definition of a standard deviation in the glossary. The recommended resources included in this chapter will be helpful if you are interested in doing tests of significance. The use of tests of significance requires some expertise to ensure you are making the correct calculations and are using data that follow the assumptions needed for specific tests. A consultant can help you with this.
The three Ms
The three Ms – the Mode, Median, and Mean – are formally known as Measures of Central Tendency. You are probably familiar with these measures. We introduced them in Module 3. The three Ms, or measures of central tendency, are three different ways of summarizing where most responses from a group of people fall. The table below shows the level of satisfaction of 51 people who indicated on a five-point scale how satisfied they were with a training workshop on evaluating community-based projects. A score of 1 indicated they were not at all satisfied and a score of 5 indicated they were very satisfied.
| Level of Satisfaction | Frequency | Percentage |
|---|---|---|
| 5 | 5 | 9.8% |
| 4 | 15 | 29.4% |
| 3 | 19 | 37.3% |
| 2 | 10 | 19.6% |
| 1 | 2 | 3.9% |
| TOTAL | 51 | 100% |
The mean is the "average" score. It is calculated by adding all the values, then dividing by the total number of values. To calculate the mean for the example on the chart above, we determine the total value of all of the scores indicated by respondents, then divide by the total number of scores (51) to obtain a mean score of 3.22:
Mean = (5x5 + 4 x 15 + 3 x 19 + 2 x 10 + 1 x 2) ÷ 51 = 3.22
The median tells you where the midpoint of the scores is found. You obtain the median by ranking all responses from highest to lowest, then finding the middle response (in this case, the 26th response). If there is an even number of cases, the median is the point halfway between the two middle cases. For example, if there were 52 responses to the satisfaction scale, the median point would be half way between the score of the 26th and 27th cases, if they were different.
Median = the 26th response (the midpoint) from highest to lowest = 3
The mode is the response most frequently given. In this case most people (19 of 51) rated their satisfaction as 3.
Mode (the most frequent response) = 3
Which one do I use? Mean, median, or mode?
Here are some hints about when to use each:
- Use the mode when reporting categories of information (e.g., male/female, ethnicity, etc.). What was the most frequent category?
- Use the median when portraying the most typical score.
- Use the mean to reflect the value of each score and not just the number of scores. Unlike the other measures of central tendency, the mean can be further manipulated. For example, the means of two groups can be added together, then divided by two to obtain the mean for the combined group.
Of the three measures of central tendency, the mean is most affected by outlying responses. In the satisfaction example we have used, the scores fall in what is known as a normal distribution or bell curve (i.e., most scores fall in the middle, with a relatively equal but smaller number at the high and low end). As a result, all three measures – the mode, mean, and median – are close to each other. Sometimes a few scores at either the high or low extreme can influence the mean, making the median a better measure of the central point. In this case, there is a slight influence on the mean resulting from the higher number of people who rate their satisfaction level as 5. Thus, while the mode and median are 3, the mean is 3.22.
Analysis tips
- No fishing! " Fishing" refers to doing all kinds of statistical tests on the data you collect until you find significant results. The more tests you do, the more likely it is that something will turn out to be statistically significant by chance. Instead of fishing, you should have a clear plan of analysis before you collect your data. Your plan should be based on your assumptions about the population you are studying and your expectations about what outcomes the project is likely to achieve. Stick to your planned analysis unless there is new evidence that a different form of analysis would be more relevant.
- Levels of significance should reflect sample size. In our discussion of statistical significance, we mentioned that very large sample sizes sometimes appear to show statistically significant results that may actually be due to chance. Generally, it's a good idea to hold to a higher level of significance when analyzing data from a very large sample.
On the other hand, it is often difficult to detect significant change in small samples, so lower levels of significance can be used. If you are working with a very small group of participants (e.g., 25 or less), it's better to collect data from everyone than to draw a sample from your participant population. It is very difficult to draw conclusions from such small samples.
When to seek help
We have mentioned that consultants can help you with your analysis. You may be wondering when you can do the work yourself and when you should hire someone to help you with it. We recommend that you hire someone who understands statistics to help with more sophisticated analyses such as tests of statistical significance. A consultant can also help you determine what kind of data you'll need, the sample size required, and other things to consider before collecting your data.
When conducting more sophisticated statistical analysis, consultants can help to ensure:
- Required assumptions are met,
- Appropriate statistical tests are used,
- The most appropriate level of significance is applied, and
- Interpretation of the result is reasonable.
Standardized tests
In Module 4 we discussed standardized tests. Standardized tests are often used to assess individual knowledge, attitudes, and behaviours. They generally involve a number of statements each of which is followed by a scale (e.g., a four-point scale ranging from strongly agree to strongly disagree) on which the respondent indicates the perspective that most applies to him or her. The process of standardizing a test involves administering it to a large group of people who, ideally, are similar to those who will complete the measure when it is used in the field. The data collected from this large group serve as a comparison to help interpret respondents' scores. Standardization allows you to determine if an individual's score is high, average, or low compared to the "norm."
Because standardized scales are constructed so that a number of items contribute toward the assessment of one attribute or concept, the results of individual items should generally not be reported on their own. In Module 5, we talked about validity, the ability of a measure to assess what it is intended to measure. We also talked about reliability, the ability of a measure to provide consistent information over time and when completed by different groups. A single item on a standardized scale is likely to have low validity and reliability when used on its own. It might be subject to misinterpretation by the respondent or may be more likely to result in some respondents providing socially desirable responses. The use of a total score on a scale or subscale is less likely to be vulnerable to these forms of response bias. For this reason, it is best to report results from standardized scales based on the total result of a scale or subscale.
- When a test has been standardized, results can be compared to the standardized scores. These scores represent the "norms" for the test.
- Use the total score or, where subscales exist, subscale scores for analysis.
- Analysis based on responses to individual items can result in misinterpretation.
Qualitative dataFootnote 2
You can analyze small amounts of qualitative data by summarizing the responses in order to provide an overall picture of what was said.
When you have large amounts of qualitative data, a more systematic method of analysis should be used. Content analysis is a process where patterns in qualitative data are identified, given a code or name, and categorized (Patton, 1990).
- Small amounts of data can be summarized to provide an overall picture of what was said.
- Tally the frequency of similar responses (e.g., those who felt the project should be longer, the location should be closer, etc.)
Analyzing qualitative data is usually a time-consuming process, but software programs such as NUD*IST and NVIVO (see http://www.qsrinternational.com/) have been developed to help with the coding of qualitative data.
If you are going to analyze your qualitative data by hand using paper copies of the data (e.g., transcripts of interviews or copies of open-ended responses to written questions), make at least four copies before you begin your analyses (Patton, 1980). If you are analyzing transcripts of interviews, ask the transcriber to leave wide margins on each page to allow for coding. Interview transcripts should always be transcribed verbatim. They should never be summarized before the analysis stage.
Tips for preparing paper
- Leave wide right margins on paper to allow for coding
- Ensure transcripts are verbatim reports of what was said
- Make four copies of each transcript
The four copies of your data will be used as follows:
- Safe storage
- To be referred to throughout the analysis
- For coding margins
- (or more copies) For cutting and pasting onto memos
After the data are collected, transcribed, and copied, you are ready for analysis. The following is a brief summary of steps used in content analysis:
- Review and organize data – Review the transcripts (or written responses to questions). Make notes about emerging themes and the main categories into which data seem to fit.
- Code data – Go through the transcripts (or written responses) carefully. Look for information relevant to the evaluation questions generated at the beginning of the evaluation process and for emerging themes and categories. "Code" the data by writing the topic, category, or theme in the right-hand margin of the page.
Example:
Let's say you are coding the responses of teen project participants to a question about what they learned about problem solving. You might code the responses as to whether they fell into the general categories of ignoring the problem, seeking support from others, escaping or avoiding the problem, or actively seeking a solution to the problem. - Construct memos – Now that all of the data are coded, use the codes you have placed in the right-hand margins of the transcripts or interview responses to review your data by category. You should be looking for contradictions, themes consistent within categories, or linkages between categories. Summarize these in written memos.
Example
Let's say you have interviewed project staff and staff from partner organizations. One of the interview questions asked respondents about their perceptions of how the partnership was working. You might have coded these perceptions under the general title "perceptions of partnership." Within this category you might notice contradictions in how different groups perceive the partnership. You could develop a memo describing the contradictions you identified. Another memo might describe any other patterns you identified in how respondents viewed the partnership.
Miles and Huberman (1984) note that memos "do not just report data, but tie different pieces of data together in a cluster, or they show that a particular piece of data is an instance of a general concept" (p. 69). Memos help to frame the way in which you will present the results of your analyses. They outline the major themes, contradictions, linkages, and categories of data. - Cut and paste – Cut and paste directly onto the memos quotes from the raw data that pertain to the themes or concepts the memos present. These quotes will act as examples of the concepts or themes you are identifying. Always remember to code the quote with information as to its source (not the person's name, but the type of respondent – a participant, partner, staff person, etc.) and page number.
- Check conclusions – When possible, use questions arising from the memos you have constructed as a basis for further interviews with participants. These interviews will be more successful if you provide participants with a summary of your preliminary conclusions before the interview. Miles and Huberman (1984) and Guba and Lincoln (1985) recommend these checks as a way to correct and verify the data.
- Revise your original assertions – Transcribe and analyze the follow-up interview data following steps 1 to 4 above and use the resulting information to revise your original assertions.
Reporting your results
How you choose to present your data is to some extent a matter of preference. Some people prefer tables and others prefer graphs. Sometimes one method is better suited to presenting a particular kind of information than another. Here is some general information about the strengths of different methods of presentation:
- Graphs and charts show trends better than tables
- Bar charts are easy to read and a good way to compare differences between similar information
- Line graphs can show different sets of information at the same time
- Pie charts show pieces of a whole and are easy to read
- Tables are most effective when presenting only a few pieces of information
Let's review in more detail these different methods of reporting results.
Bar charts
Participant-reported feelings of safety in 2001 (n =90) and 2003 (n =88)

Bar charts are good for comparing two sets of data. For example, the chart shown above presents values across categories (e.g., always, sometimes, never) and over time (e.g., 2001 and 2003). Bar charts are also useful for comparing pre-post data. The horizontal axis represents the categories (always, usually, etc.), while the vertical axis represents the frequency of occurrence of the responses (in this case in percentages).
When you prepare a bar chart, remember to include a "legend." The legend is the box on the right that explains how the colours or patterns used on the bars relate to the year the data were collected. Label both axes and give the graph a title that fully explains its contents. Indicate the sample size. In this case, the sample size differs from one time to another, so both are shown.
Bar charts can be misleading.
The bar chart below presents the same data as those shown in the chart on the previous page. The chart on the previous page shows a vertical axis that is cut off at 50% rather than 100%. The proportions between the bars stay the same, but the reduced size of the vertical axis allows the bars to better fill the graph. This presentation can mislead the eye to think more people usually or sometimes feel safe than actually do. But it is not incorrect to present the data in this way. The reader should always review the vertical axis to see if it presents the full scale or only a portion of the scale. While you can get away without presenting the top range of a scale on a vertical axis, you should always start the scale at zero.
The maximum score on the vertical axis on the graph shown below is 100%. It is less likely to trick the eye than that on the previous page. But it doesn't fill the page as nicely! Pay attention to the vertical axis. Don't let your eye be tricked to thinking more people responded in a certain way than actually did.
Participant-reported feelings of safety in 2001 (n=90) and 2003 (n=88)

Line graphs
Line graphs are a good way to show continuous change such as how feelings of safety increase and decrease over time. Line graphs are especially useful for reporting trends. They can be used to compare change experienced by more than one group or in more than one area by including different lines in the graph.
The horizontal axis on the line graph shown below represents the points at which the data were collected. The vertical axis represents the frequency of responses (in this case, the percentage who perceived the area to be safe).
Remember to include a descriptive title and legend and to label the axes of your line graph. Use equal increments on the scale.
Resident Perceptions of Safety in Areas of the Housing Complex: 1998 (n=200), 2000 (n=192), 2002 (n=216) and 2004 (n=230)

On the next page we show another example of playing with the vertical axis. In this case, we presented the same data as in the previous graph, but we narrowed the range of the vertical axis to start at 30 and end at 90. As we mentioned earlier, it is not a good idea to have the vertical axis start higher than zero. As you can see from the graph on the next page, this misleads the eye by exaggerating the extent to which there was change in the perception of safety over the six-year period.
Resident Perceptions of Safety in Areas of the Housing Complex: 1998 (n=200), 2000 (n=192), 2002 (n=216) and 2004 (n=230)

Pie charts
Pie charts are a good way to show the various components that make up a larger group. They should be used when the data are portrayed as a percentage of the whole. If, for example, you are describing the demographic make up of your participant population, a pie chart is a good way to present the population by level of education, income group, or marital status.
Pie charts should be presented with a legend. Each category should be identified with a value label that shows what percentage of the whole it represents.
Level of education (n =100)

Tables
Tables are a good way to present the relationships between information. They can also be used to present work plans and progress in activities.
Give the table a complete title. Label all rows and columns within the table. If symbols are used, provide a legend to explain them. The table below presents the differences in demographic characteristics of a treatment (or intervention) group and a comparison group.
| Treatment (n =54) | Comparison (n=47) | |
|---|---|---|
| Mean age | 27 | 24 |
| Mean education (in years) | 14 | 12 |
| Mean income (monthly) | $1400 | $1250 |
| % Female | 55% | 52% |
One more tip...
Correlation ≠ Causation
This is one of the most important things to remember as you report the results of your analysis. The fact that two things are correlated does not necessarily mean one thing caused the other.
For example, if adolescents who smoke also have higher levels of dropping out of school, that does not mean they are more likely to drop out of school because they smoke. What does it mean? It means that those who smoke are more likely to drop out. Nothing more.
Likewise, even if there is a correlation between reduced involvement in crime and program participation, we can't say with absolute certainty that participants in the program were less involved in crime because of that program. We can say that participants in a particular program were less likely to be involved in crime. If you've done your research right and have eliminated other possible explanations for the reduced involvement in crime of project participants, you can say your results are promising. You can suggest the program may be having an effect.
Questions to consider in your report
When reporting the results of your evaluation, try to answer the questions your key stakeholders will want to know. Here are some questions to consider:
- What worked well? What needed improvement?
- If there were problems, what were they?
- Can the problems be fixed with existing resources?
- What strengths stand out and should be further enhanced?
- Did the project accomplish its goals efficiently and, if so, through what means?
- Overall, is the project worthwhile? (Ottawa Police Services, 2001)
Match your presentation style to your audience
- Think about your audience - Is it program participants? Funders? Other community projects? Policy analysts? Government?
- Include an executive summary
- Include copies of your evaluation instruments in the appendices
- Discuss the implications of the results - What do they mean for project change?
Writing a report can be a good way to summarize the results of your evaluation, but it is not the only way. How you communicate your results will depend on the audience you are trying to reach. Your funder might prefer a written report. A fact sheet written in plain language or a community forum might work best for project participants.
If you are providing a written report, make sure you provide an executive summary. An executive summary can be shared more widely than a full report. It is a good way to reach interested readers who do not have time to read a long report.
Videos or photographs that show aspects of community change are another effective reporting technique. Let's say you wanted to show the extent to which your project resulted in changes to the amount of graffiti in your community. A series of photographs showing the changes over time would be an ideal way to present your project's results. Another project might want to show how community action resulted in greater pedestrian traffic in an area that was formerly avoided by neighbourhood residents. A series of photographs or videos taken over time would make a compelling statement.
Glossary of terms
Correlation
Correlation refers to the relationship between two variables. It does not mean that one variable causes the other, but simply that one variable is related to another. From a statistical perspective, correlation is measured through a correlation coefficient (r). It measures the similarity or the strength of association between two variables. Statistical correlations range from minus one to plus one. The further the value is away from zero, the more the two variables are related (Worsley, Hoen, Thelander, & Women's Health Centre at St. Joseph's Health Centre, 2002).
Indicator
An indicator is a variable (or information) that measures one aspect of a program or project. It indicates whether a project has met a particular goal. There should be at least one indicator for each significant element of the project (i.e., at least one for each outcome identified in the logic model).
Inter-rater reliability
Inter-rater reliability is used to examine the extent to which different raters or observers agree when measuring the same phenomena (Aspen Institute of Comprehensive Community Initiatives, 1999).
Normal distribution
A normal distribution means the responses or scores from a particular population are distributed in a way in which most responses fall around the centre with a smaller but equal proportion falling toward either end of the range of scores. A line graph showing a normal distribution looks a bit like a bell, so it is sometimes referred to as a "bell curve."
Norms
Norms indicate the average scores on survey items. The scores of respondents to a survey can be compared to the survey's norms in order to determine how they compare to the average population or to a population with characteristics similar to their own.
Pilot test
A pilot test is a way to test out a particular instrument before it is used in a study or evaluation. For example, you might want to try out a survey you have developed with a few potential respondents to see if they understand it and if the questions provide you with the kind of information you are hoping to obtain.
Scale/subscale
A scale is a test where questions that measure the same thing, or different aspects of the same thing, are linked together (Rittenhouse, Campbell, & Dalto, 2002). A subscale measures one aspect of the larger scale. For example, if a scale were used to measure problem-solving skills, one subscale might assess the person's ability to seek the support or advice of others when faced with a problem.
Socially desirable
Sometimes respondents provide responses to a survey or measure that they believe are most favourable to their self-esteem, are most in agreement with perceived social norms (Polland, 1998), or that the researcher will want to hear. These are considered socially desirable responses.
Standard deviation
A standard deviation is a measure of the extent to which scores are variable or are spread around the mean or average score. The statistical definition of a standard deviation is the square root of the variance of the scores. Variance is the extent to which each individual score in a set of scores deviates from the mean of that set of scores. The higher the standard deviation, the more widely the scores are spread around the mean.
Standardization
A standardized measure is one that has been administered to a very large group of people similar to those with whom the measure would be used. The data collected from this group serve as a comparison for interpreting individual, small-group, or program measure results. Standardized tests allow you to determine if an individual's test score is high, average, or low as compared to the norm (Ogden/Boyes Associates Ltd., 2001).
Statistical significance
Tests of statistical significance are done to determine if results are due to chance or are likely to reflect a real difference or change.
T-test
A t-test is a statistical test used to test the difference between the means obtained from two different populations or from the same population but under different conditions. For example, a t-test might be used to determine if the difference in the mean scores obtained on a test administered to participants in a project and that obtained by members of a comparison group is statistically significant (i.e., unlikely to be obtained by chance). It might also be used to test the statistical significance of the difference in the mean scores obtained on a test administered to participants before and after a project.
References
Aspen Institute Roundtable on Comprehensive Community Initiatives. (1999). Measures for community research. Retrieved November 2, 2004, from
http://www.aspenmeasures.org/html/glossary.htm
Guba, E.G., & Lincoln, Y.S. (1985). Naturalistic inquiry. Beverly Hills, CA: Sage.
Miles, M. B. , & Huberman, M. A. (1984). Qualitative data analysis: A sourcebook of new methods. Beverly Hills, CA: Sage.
Ogden/Boyes Associates Ltd. (2991). CAPC program evaluation tool kit: Tools and strategies for monitoring and evaluating programs involving children, families and communities. Unpublished report for Health Canada, Population and Public Health Branch, Alberta/Northwest Territories Region, Calgary, AB.
Ottawa Police Services. (2001, August). You can do it: A practical tool kit to evaluating police and community crime prevention programs. Retrieved October 6, 2004, from http://www.ottawapolice.ca/en/resources/publication/pdf/you%5Fcan%5Fdo%5Fit %5Fevaluation%5Ftoolkit.pdf
Patton, M. Q. (1980). Qualitative evaluation methods. Beverly Hills, CA: Sage
Patton, M. Q. (1990). Qualitative evaluation and research methods. London: Sage.
Polland, R.J. (1998). Essentials of survey research and analysis: A workbook for community researchers. Retrieved November 4, 2004, from
http://www.tfn.net/%7Epolland/quest.htm
Rittenhouse, T., Campbell, J., & Dalto, M. (2002, February 15). Dressed-down research terms: A glossary for non-researchers. Retrieved November 4, 2004, from the Missouri Institute of Mental Health Web site: http://www.cstprogram.org/PCS&T/Research%20Glossary/Dressed_Down_Glossar y.pdf
Worsley, J., Hoen, B., Thelander, M., & Women's Health Centre at St. Joseph's Health Centre. (2002, September). Community Action Program for Children: Ontario regional evaluation final report. Toronto, ON: Health Canada, Population and Public Health Branch, Ontario Region.
Suggested Resources
Websites
Centre for Substance Abuse Prevention
Prevention Pathways
http://pathwayscourses.samhsa.gov/courses.htm
This series of online tutorials provides information about data analysis. The on-line course titled "Wading through the Data Swamp" includes topics such as descriptive statistics, correlation coefficients, t-tests, and chi-square analysis.
Corporation for National and Community Service
Project Star : AmeriCorps Program Applicant Performance Measurement Toolkit
http://www.projectstar.org/star/AmeriCorps/pmtoolkit.htm
This website includes easy-to-use step-by-step tools for analyzing performance measurement data. A reporting checklist provides guidelines on what to include in an evaluation report.
Innovation Network Online
http://www.innonet.org/
Free registration on this website entitles you to a number of excellent resources, including a statistics tutorial and a sample outline for a final evaluation report. Once you have registered, go to the resources section for these tools.
Microsoft Education
Analyzing Data with Excel 2002
http://www.microsoft.com/Education/Excel2002Tutorial.aspx
An on-line tutorial demonstrates how to analyze data using the Excel program.
Plain Language Network
Plain Language Online Training Program
http://www.plainlanguagenetwork.org/plaintrain/index.html
This network offers information on using plain language in various subject matters. Also available in French: http://www.plainlanguagenetwork.org/plaintrain/Francais/
Robert Niles.com
Statistics Every Writer Should Know
http://nilesonline.com/stats/
This excellent website is intended to help reporters better understand the statistics they encounter as journalists. As such, it is easy-to-use and intended for the lay reader. The site includes simple lessons on basic statistics and a table to help you determine appropriate sample sizes. The site also provides links to recommended reading on statistics; again, for the lay reader.
University of Wisconsin Program Development and Evaluation
http://www.uwex.edu/ces/pdande/evaluation/evaldocs.html
This is an excellent website that offers learning tools on the analysis of qualitative and quantitative data and on reporting evaluation results. It provides tips for preparing graphs and charts.
Western Centre for Substance Abuse Prevention
Step 7: Evaluation
http://casat.unr.edu/bestpractices/eval.htm
This website provides information on best practices in setting up a prevention program, including the implementation of an evaluation. It includes a useful section on analyzing, using, and interpreting data, both qualitative and quantitative.
Journals
Practical Assessment, Research and Evaluation
http://pareonline.net/
This on-line Journal includes articles on data analysis and interpreting results.
Books/Manuals
Crime Prevention is Everybody's Business: A Handbook for Working Together
Pages 76-79 of this manual provide information about how to organize your final evaluation report.
Bigwood, S., & Spore, M. (2003 )
Presenting numbers, tables and charts. New York: Oxford University Press.
This is a good reference book to help you present your data.
Trochim, W. (2000).
The Research Methods Knowledge Base, 2nd Edition.
http://www.socialresearchmethods.net/
This on-line textbook provides extensive information about data analysis and the reporting process.
Ottawa Police Services. (2001, August).
You can do it: A practical tool kit to evaluating police and community crime prevention programs. http://www.ottawapolice.ca/en/resources/publications/pdf/you%5Fcan%5Fdo%5Fit%5Fev aluation%5Ftoolkit.pdf
Pages 78-79 of this manual provide information about how to organize your final evaluation report.
Module 6 Worksheets
Worksheet #1
Analysis of results
Worksheet #2
Reporting resultsFootnote 3
- Prepare a three-minute presentation of the results of your analysis.
- Suggest what factors may have influenced the results (participant, project, process).
- Use at least one graph, chart, or table.
- Draw some conclusions: From these data it looks like.
- If the results were different from what you expected, why do you think that is?
Module 7: Evaluation challenges and solutions
Learning objectives
- Identify challenges in evaluating community-based projects :
- "Buy-in" of staff & partners
- Participant involvement
- Ensuring data collection takes place
- Realistic outcomes
- Data analysis
- Finding a good evaluator
- Ethical issues
- Evaluation in aboriginal communities and in multicultural settings
- Be prepared with potential solutions
- Know about resources in your community
This module describes some of the key challenges faced in evaluating crime prevention through social development projects. The description of each challenge is followed by some potential solutions to get your evaluation on its way.
Challenge #1: Getting "buy-in"
In order for any evaluation to succeed, it will need the support of partners, project managers, front-line staff, and participants. First, let's look at some of the challenges you might face in getting the buy-in of project staff and partners. We'll talk about participant involvement in Challenge #2.
Project staff
Project staff may have many reasons for being reluctant to support an evaluation of the programs or project in which they work. As you review the challenges we have listed below, remember that staff working in your project may share some but not all of these anxieties. Or, they may not share them at all: Some staff will be excited at the opportunity to participate in an evaluation, learn new skills, and demonstrate that the activities in which they are involved make a difference in the lives of others.
- Anxiety/fear – For many people, evaluation is a scary word. Front-line staff and project managers may feel that they – as opposed to the project – are being assessed.
- Concern about the project's fate – Project staff are often concerned that the project will not be able to obtain funding if evaluation results are negative.
- Competing workload demands – It's important to acknowledge that staff in community-based projects often face heavy workloads. If they are forced to choose between service to participants and evaluation tasks, they will generally choose service first.
- Lack of – or lack of confidence in – evaluation skills – Project staff are hired to deliver a program and often do not anticipate being asked to conduct evaluation interviews, to complete evaluation instruments, or to track information on project activities. The prospect of participating in an evaluation can be intimidating for those who have never received training in research or evaluation skills.
- Evaluation tools will not capture change – Working in community-based projects can be very rewarding. One of the greatest rewards is seeing changes take place in communities or in the lives of participants. It's not unusual for project participants and community members to tell stories about the differences community-based projects have made in their lives. For this reason, project staff may say, "We already know it works, so why do we need to evaluate it?"
- Feeling of being "over evaluated" – As funders increasingly require projects to conduct outcome evaluations, project staff are expressing frustration that their interventions are being "evaluated to death."
Partners
Community-based projects involved in crime prevention through social development generally work in partnerships or coalitions. Your organization may co-deliver project activities with other community groups, human service agencies, the educational system, police, and voluntary groups. Your partners might receive funding from different sources to support these activities. As a result, all of your partners and their funders will likely have an interest in your project's evaluation. Sometimes partners are a key source of information about project activities and outcomes. Their support – and often their active participation in the evaluation – is essential.
- Competing requirements of different funders – Your partners are likely to have evaluation or administrative obligations to other funders or partnerships. If they are struggling to meet requirements from within their own organizations, requests for information from your project may be overwhelming.
- Differing definitions of success – When different groups play a role in a project, they sometimes disagree about how success should be defined. For example, while schools may define success in a project that teaches leadership and life skills to youth as reducing school absenteeism and drop out, a youth service agency might see it as increasing youth's resilience and leadership abilities, a neighbourhood group might see it as preventing youth from hanging out in certain locations, and youth themselves may see it as changing police and community stereotypes about youth.
Solutions
Create a shared vision - Involving staff, partners and participants in evaluation planning can help to reduce anxiety and fear. If all of your key stakeholders are involved in identifying outcomes and potential indicators of success, they are more likely to support the evaluation. Consult with staff, partners, and participants about how to capture the kinds of change they see and experience.
- Involve staff, partners, and participants in planning the evaluation
- Develop a logic model together to create a shared vision and goals
- View evaluation as research and development
- Embed evaluation in project activities
- Use templates and tracking sheets to record evaluation information
- Provide training and support
- Consult funders where competing evaluation demands exist
- Recognize that success can be defined in more than one way
View evaluation as research & development - Project staff are often concerned about how evaluation will affect the project's long-term prospects. It's important to take time to answer questions about the evaluation and address concerns. Explain that evaluation is intended to show what works and where improvements can be made. We should not expect that everything we do in community and human services will succeed, especially when we're working in the complex area of human behaviour. Successful businesses invest much time and resources in research and development (or "R&D") before they get their products right. Evaluation can help us learn from and refine what we do. It's not meant to judge anyone's work, but to advance our ability to make a difference in community life.
Embed evaluation in project activities - When evaluation is seen as a way to improve our ability to make change, we tend to see why it needs to be an integral part of project activities. It should not be considered an "add-on" responsibility, but a part of our day-to-day work. Integrating evaluation tools into project activities can help to address concerns about workload. Here are some ways to do it:
- Create simple ways to support data collection such as:
- sign-in sheets for participant activities,
- tracking sheets for volunteers to record their time, and
- tracking sheets for staff to record referrals.
- Incorporate evaluation into program activities:
- Obtain "pretest" data as part of an intake interview with participants, allowing staff to get to know them better and to identify referral and program needs;
- Obtain "posttest" data as part of an exit interview that helps staff identify what worked, why some participants drop out, and other valuable information;
- Involve participants in filming or photographing community changes such as the number and diversity of people using a local park. Use the results to celebrate changes or to hold a community forum to discuss the results;
- Involve staff in identifying ways to integrate evaluation into project activities.
Provide training and support – Ensure staff get the training and support they need to feel confident in their skills and ability to do all aspects of their job, including evaluation. Identify those who need assistance. Employ experienced or knowledgeable staff as mentors to those who need help. Seek support from local universities or colleges to help with staff preparation. Local health units and foundations may also be able to help. Use this handbook and some of the exercises you learned in these training sessions at in-service staff training opportunities.
Consult funders – Funders can be flexible. (It's true!) If you and your partners have multiple funders, each with their own evaluation requirements, there may be creative ways to make these requirements fit together. If they truly compete with each other, approach your funder about the problem. Be prepared with some ideas about how you can meet them part way.
Define success – If partners have different views about what represents "success," include indicators for different success outcomes. But be careful not to measure more than you can realistically collect and analyze.
Challenge #2: Participant involvement
No one wants to appear like this fellow when recruiting participants for an evaluation. But maintaining participant involvement can be a challenge. While it is often simple enough to obtain participant consent in the first place, as time goes on, it can be difficult to maintain participation in follow-up surveys or interviews.
Solutions
Evaluation planning – Include participants in evaluation planning. A good way to start is to involve participants in developing a logic model. Use participatory methods – like the one we used in Module 2 – to involve participants in identifying what they see as the outcomes for the project. Involving them in project and evaluation planning ensures participants have a say in what the project is doing. After all, if you want to encourage community or individual change, you'll want to know whether these changes fit with what participants want for themselves. Involving them in the design phase will increase their "buy in" both for the project and the evaluation.
Consent forms and scripts for staff – Obtaining participant consent is an important part of doing evaluation. We'll talk more about this when we discuss research ethics. Projects can give their staff a script to help them explain the purpose of the evaluation and the important role of participants in identifying what works in social development projects. Written consent forms should be worded in plain language. Staff should read the consent form aloud in case participants have literacy problems. Projects that serve people who speak English or French as a second language should have the consent form translated.
- Involve participants in evaluation plans
- Use plain-language consent forms
- Give staff "scripts" to help explain the evaluation
- Use incentives or rewards
- Make participation convenient - go to participants or fit survey completion into program times; keep surveys short
- Select a big enough sample to allow for drop-out
- Provide feedback on evaluation results
Incentives - Token gifts, cash incentives, or food vouchers can be offered as a way to acknowledge the time participants take to complete questionnaires or to participate in interviews or focus groups. If your budget doesn't allow for this, consider approaching local businesses for donations. This is a good way to let local businesses know about your project and the importance you place on learning whether it works. At the same time, it's a good way for businesses to let project participants know what they have to offer.
Convenience – Arrange for participants to complete surveys or interviews at home or just before or after project activities. Phone interviews can work if the participant has a private place to talk. Focus on what you "need to know" and avoid information that would simply be "nice to know." This will help to keep surveys short and avoid respondent fatigue.
Larger samples – There will always be a certain number of participants who drop out of the project or who choose not to participate in follow-up interviews or surveys. Select a large enough sample to ensure there are enough completed surveys or interviews at the end of your data collection period.
Feedback – Participants can be kept in the loop by providing updates on evaluation results. Projects can do this in many ways – fact sheets and community forums are well suited to keeping participants informed.
Challenge #3: Data collection
An evaluation's success rests on getting accurate and complete information. It is often too late to go back for information if you later realize it is missing. Yet despite the crucial role of good data in evaluations, there are often many players involved in data collection, resulting in less control over this aspect of the evaluation than you might like.
Consider an evaluation where front-line staff collect participant information and record notes about project activities, partners provide information about the people they refer to the project and, when they have continued contact with participants, they provide assessments of the changes those participants experience. (Some crime prevention projects affiliated with schools, for example, ask teachers to report on any changes they have seen in the behaviour of students who participate in project activities.) Community workers and neighbourhood leaders are asked to participate in interviews and focus groups to share information about community perceptions of a project. As you can see, this evaluation relies on a variety of players to provide accurate and complete information.
Control over data collection becomes even more challenging when projects rely on partners to offer components of their project activities. In these situations, the project sponsor must rely on partner organizations to provide basic attendance information or to obtain baseline information from participants at the time they enter the program and outcome information at a follow-up time.
Needless to say, the challenge of obtaining accurate and complete data is closely linked to the challenges of obtaining staff and partner and participant support for an evaluation.
Solutions
If partners are involved in collecting data, develop signed protocols outlining how participant consent will be obtained, what information will be collected, and how the information will be stored and exchanged. Put systems and agreements in place at the outset and not midway through the project.
- Ensure partners, staff, and participants are aware of the information needed to evaluate the project
- Start the project with systems in place to collect appropriate data on a timely basis
- Review the data for accuracy and completeness on a regular basis
Of course, even the best-laid plans can fall into disarray. A common problem is that evaluators or program planners fail to review evaluation information until they need to analyze it. At that point, it's too late to remedy common problems such as misunderstood questions, incomplete forms, or the failure to provide identifying information that links pre- and posttest results. Make sure you try out your data collection instruments with a small group before you start formal data collection. Review completed instruments regularly to ensure questions were understood and the information is complete. This will avoid surprises at the analysis stage.
Challenge #4: Realistic outcomes
Success = reduced crime and victimization
It seems pretty straightforward, doesn't it? The best way to evaluate the success of crime prevention projects is to look at the extent to which they prevent crime and victimization in their communities.
But linking reduced crime and victimization to a particular project can be difficult. Crime and victimization rates are affected by many factors outside of the control of a community project:
- Social factors – Rates of unemployment and poverty and the extent to which there is social cohesion in a community can influence the extent to which crime takes place.
- Legislation – Activities that are crimes today may not be considered crimes in the future. Other things not typically prosecuted today may receive a greater focus in the future. You may have heard about the potential decriminalization of marijuana possession, for example. While it appears in crime statistics today, it may not appear in them in the future. Child neglect, on the other hand, is more likely to be reported and dealt with in the courts today than it was in the past.
You can probably think of many more examples of the difficulties of linking crime prevention to particular project activities.
So, if community rates of crime and victimization are not realistic outcomes, what are? You might decide that you at least have more control over crime reduction among the people directly involved in your project's activities.
Thus, success = reduced crime by project participants.
You can request access to court and police records to see if participant involvement in crime changes over time (with the written permission of participants, of course). Many projects involved in crime prevention through social development use this as an outcome. It can be a very useful way to determine what changes result from a project. But some caution is needed here too. Let's look at some of the difficulties associated with different sources of information about participant involvement in crime.
- Self-reported behaviour is vulnerable to socially desirable responses.
- Police contact – Participants known to police may be more likely to have further contact even if they haven't re-offended. And, of course, crime and victimization can occur without police contact.
- Arrests/charges can be influenced by police policies (e.g., crackdowns on certain activities, a focus on specific geographic areas, etc.). And, similar to the problem associated with police contact data, crime and victimization can occur without ever resulting in arrest.
- Convictions – Even convictions can be influenced by factors unrelated to whether an offence actually took place. You can probably think of examples where people were wrongfully convicted or, alternatively, were not convicted – or even charged – when it appears they should have been.
Solutions
First, remember that you must decide at the start of your project what information (indicators) you will use to assess success. If you wait until the project is underway, you might find that it's too late to get some of the information you would have needed.
If your project is based on a solid logic model, you might not need to measure actual change in crime or victimization. You can instead measure change in some of the short-term outcomes that the logic model suggests will eventually lead to change in crime and victimization.
Below we have listed some alternatives to measures of crime and victimization, but these will depend on the type of intervention you have planned. We have also provided some suggestions to help you if you choose to use measures that assess reduced involvement in crime and victimization.
Consider:
- Are there alternatives to using criminal involvement as a measure of success?
- Use more than one measure of criminal involvement to control for problems with any one measure
- Report type of offences to avoid a simple success/failure outcome based on offending alone
Alternative measures to assess participant or community change might include:
- Attitudes toward authority
- Opinions about responsibility
- Participants' perceptions of their role in the community
- Anger management
- Employment/volunteering
- Perceptions about the extent of crime and fear of victimization in the community
- Number of calls to police or crisis lines
- System changes resulting from project activities (e.g., responsiveness of local services to the needs of youth, changes in approaches to policing, etc.)
More than one measure – Imagine you were planning to look at changes to the number of contacts with police among youth involved in your gang-exit program and among a comparison group. You believe the fact that youth in your project had previous contact with police might make them more likely to be the subject of police interest in the longer term. This could lead to continued contact with police regardless of whether they commit offences. Collecting information about the number of convictions as well as police contacts will help to determine if the youth involved in the project were judged by a court to have been involved in crime or were simply the subject of continued police interest.
In another example, you may be concerned that participants in an anti-bullying program are providing socially desirable responses on your pre-post questionnaire about their involvement in bullying activities. You could use school records about behaviour in school and suspensions or expulsions from school to corroborate the results of the questionnaire.
The measures you choose do not have to relate directly to crime, but can provide information about outcomes such as anger management or peer relations that are related to progress toward the longer-term outcome of reduced involvement in crime or reduced victimization.
Collect information about the type of offence – This is particularly a good idea if you want to look at recidivism. Even if participants do re-offend, these offences may not be as serious as earlier ones, suggesting some progress toward change.
Other important considerations – When using criminal involvement as an indicator of success, consider the following suggestions:
- Use the same follow-up period for all participants. This will ensure some participants do not have a shorter time to re-offend than others.
- Collect information about incarceration during follow-up periods. Offenders who are incarcerated are obviously less able to offend than those who are free, so this is an important consideration when looking at recidivism data.
Challenge #5: Data analysis
Analyzing the information you collect in your evaluation might seem like an intimidating task. If so, you are not alone. Community and human service workers don't often have training or experience in data analysis, whether qualitative or quantitative. Who isn't intimidated when they are asked to do something they do not feel qualified to do?!
Solutions
First, just as you should decide at the start of your project what indicators you will use to assess its outcomes, you should decide at the start of your project how you will analyze the data you plan to obtain.
If you have chosen to hire an external evaluator, you can ask them to analyze the data that is collected. If you're completing your evaluation on your own, here are some suggested resources to help you analyze your data.
- Colleges or universities may have faculty or students who are interested in crime prevention through social development and may be able to help you plan and implement your evaluation project. Students may be able to analyze results as a summer project or as a part of their course work. Contact local educational institutions before you begin the evaluation to see how they can help. Don't leave it until you're staring down a mound of data that you don't know what to do with!
- NCPC staff may be able to connect you to other projects doing similar work. They can give you suggestions about what to collect and how to analyze it.
- This training session is part of a series. Module 6 of the series discusses how to do basic data analysis. Ask your regional NCPC staff if they will be offering this training session in the future. If not, ask for a copy of the handbook that goes with that module. It gives some basic information about data analysis and has a guide to Internet sites and other resources that can guide you through the steps of analysis.
- Finally, a word of advice: Collecting too much data, especially lots of qualitative data, can be overwhelming. Make sure you have the capacity to analyze the data before you collect it. It's important to be selective in deciding what to collect: Focus on what you need to know as opposed to what it would be nice to know.
- Remember to plan from the start of the project what data you will analyze and how you will do it.
- Seek advice from local college/university faculty or students
- Ask for help from other projects doing evaluation
- Participate in a NCPC training session on data analysis
- Be careful not to collect more data than you can realistically analyze
Challenge #6: Finding an evaluator
You may not have the financial resources within your budget to pay for an outside evaluator. But even if you are lucky enough to have money to hire an evaluator, you might find it's a challenge to find someone who is suited to your evaluation project and who will provide quality work. This is particularly a problem in rural and remote communities.
Solutions
Even if you don't have the resources within your budget to hire an outside evaluator, don't give up. Partner organizations and local universities or colleges may have staff or students who are interested in the work you are doing and can help with the evaluation.
Here are some options for finding external evaluators, both paid and unpaid.
- Ask the Canadian Evaluation Society for a list of evaluators in your area (http://www.evaluationcanada.ca).
- Seek referrals from groups with which you've worked.
- Contact criminology, applied psychology, or sociology departments at local universities.
- Look for someone with:
- Competence in research design, data collection, database design, and statistical analysis
- Knowledge of legal and professional standards for research
- Familiarity with the literature relevant to your project work
- Good management, public relations, writing, and interpersonal skills
- An action orientation
- Evaluators with an action-research orientation will be more likely to suggest practical solutions to any problems identified in your evaluation.
Challenge #7: Ethical considerations
Ethical issues can arise when conducting research. We have listed some of them here. You may be aware of others that are particular to the population you serve.
- Limits to confidentiality – There are some limits to the confidentiality of information. For example, courts can subpoena project records and project staff must report to child welfare authorities any information that leads them to believe a child is at risk of abuse or neglect.
- Privacy – Some things not considered private in one culture, may be considered private in another. People from some cultures might consider it inappropriate to discuss with strangers issues or information that other cultures are willing to discuss.
- Participant observation – Sometimes evaluators use participant observation as a way to collect information about how the project is implemented and how participants react to project activities. Project staff and participants may not be comfortable with this method of collecting information.
In a related issue, you may decide to conduct observations without first informing participants that they are being observed so that the knowledge they are being observed will not influence their behaviour. These situations are of particular concern from an ethics standpoint.
- Random assignment – Random assignment involves selecting members of comparison and "treatment" or intervention groups in a way that ensures everyone has an equal chance of being referred to one group or the other. Project staff are often concerned about the use of random assignment to develop "treatment" and "comparison" groups. They aren't comfortable withholding services for a comparison group and they prefer to select project participants based on need or on a first-come, first-served basis.
- Language used in reports – Evaluators and project staff sometimes use terms such as "at risk," "high risk," "disadvantaged," and "generational poverty." This language may offend project participants.
- Working with youth and marginalized groups – Extra precaution should be taken when working with youth and marginalized groups. Parent consent is needed before youth can participate in evaluation studies. Sometimes this is difficult to obtain if parents are not directly involved in the project. When working with marginalized populations, researchers must pay particular attention to ensuring the rights of respondents are protected.
Solutions
Many resources exist to help you conduct your evaluation in a way that respects participants and follows guidelines for research ethics. Make sure you follow the key principles of research ethics:
- voluntary participation,
- informed consent, and
- confidentiality.
Community research ethics boards (REBs) are available in some provinces to help community groups review the ethics of research activities. Ensuring your evaluation has passed an ethics review by a REB can help to relieve concerns about ethics. For example, while project staff may be concerned about random assignment, ethics boards may not share their concern. When the effectiveness of an intervention is not known, random assignment may be considered the most ethical way to determine who gets service and who is assigned to a waiting list or a comparison group. Bear in mind that, because we can't assume that project activities are effective, withholding a service may be less harmful than providing it. Even when evaluating new drugs that may help to save lives, random assignment is used to determine if the drug is effective.
Research ethics boards follow the Tri-Council Policy Statement: Ethical Conduct for Research Involving Humans in their review of research studies. It includes guidelines for handling situations such as naturalistic observation, one of the challenges we listed earlier. If a REB is not available in your community, reviewing your evaluation plan in light of the Tri-Council Policy Statement is a good way to ensure you are following standard guidelines for research ethics (see http://www.pre.ethics.gc.ca/english/ policystatement/policystatement.cfm for a copy of the Tri-Council Policy Statement).
University research offices can provide sample resources related to research ethics such as consent forms and scripts for recruiting research participants in an ethical manner. The web site of the University of Waterloo Office of Research is a good example (see http://www.research.uwaterloo.ca).
Voluntary participation is a cornerstone of evaluation research. Always explain to participants that they can choose not to participate in the evaluation, they may refuse to answer any questions they do not wish to answer, and they can withdraw their consent to participate at any time. Reassure participants that if they decide not to participate in the evaluation or to withdraw from it at any time, their decision will not affect their ability to participate in project activities.
- Have an ethics review board review your evaluation plan
- Use existing research ethics guidelines and resources to guide your plan
- Ensure participation in the evaluation is voluntary
- Obtain signed consent forms indicating participants have given their informed consent
- Guarantee confidentiality to the extent possible
- Respect and inform yourself about cultural differences
- Write reports with project participants in mind
Fully inform participants about what they will be asked to do as part of the evaluation. Explain whether the evaluation will include surveys, observation, requests to obtain school or court records, interviews with referral sources, or any other personal information. Let them know how this information will be used. When informing participants about evaluation activities, stress the role of the evaluation in project improvement. Ensure participants understand the intent is to evaluate the program, not them.
Obtain written consent. Obtain parent consent when children or youth under the age of 17 are involved.
All personal information should be kept confidential. Evaluation findings should always be reported in a way that will not reveal individual identities. But be clear about the limits to confidentiality and explain these limits to project participants. This applies not just to information obtained through an evaluation, but to information obtained during project activities too. Provinces and territories have legislation that requires staff in social or community services to report to child welfare authorities information that suggests a child is at risk of abuse and/or neglect. Review the child welfare legislation in your province or territory.
Where participants are involved in the judicial system, courts can subpoena records that might provide further information about the defendant's personal circumstances. Evaluation (and project) participants should be made aware of these limits to confidentiality.
Ensure you are informed about cultural practices and traditions that will need to be respected both in the evaluation and in your project activities. The Tri-Council Policy Statement: Ethical Conduct for Research Involving Humans includes a section with recommended practices for research involving aboriginal people (see http://www.pre.ethics.gc.ca/english/policystatement/section6.cfm).
Use language that is respectful of project participants in your evaluation reports. Evaluation results should be written or delivered in a way that is accessible to project participants.
Challenge #8: Reflecting cultural and community differences
Some communities and cultural groups have unique histories and circumstances that can provide additional challenges to evaluation planners.
- Distrust of government record keeping – Aboriginal communities have faced long histories of abuse and oppression at the hands of officials, including those associated with residential schools, government, and churches. Immigrants and refugees sometimes come to Canada from totalitarian states where governments routinely misuse personal information to maintain their hold on power. Both of these groups may understandably be distrustful of requests for personal information.
- Oral traditions – Aboriginal peoples and some other cultures have oral as opposed to written traditions. These traditions have implications for the use of written surveys for data collection and written reports for sharing results.
- Cultural differences – Standardized instruments have often been tested on middle-class populations of European origin. Some of the concepts they assess might be foreign to people from other backgrounds, thus reducing their validity when used with these groups.
- Small participant numbers – Projects focusing on small or remote communities may involve small numbers of participants, making it difficult to find statistically significant results using quantitative pre-post data.
- Experience with project management – Grassroots groups, particularly those in remote communities or those new to Canada, may have limited experience in planning projects in a way that is conducive to outcome assessment.
- Confidentiality – In small communities it is especially important to ensure confidentiality of personal information. When project staff may be relatives or neighbours of project participants, participants may be reluctant to share personal information. This can happen even when projects take place in large urban areas. For example, within immigrant groups new to Canada, there are often small numbers of people in any one community who speak English or French and the native language of participants. Because of the small size of these communities, members are sometimes reluctant to share personal information with translators or interpreters.
- Language – New immigrants to Canada may have limited knowledge of spoken and/or written English or French.
Solutions
Participatory methods – Involving community members in evaluation planning can go a long way toward overcoming resistance to evaluation. If participants are involved in planning the project and determining the indicators of success, they are likely to be more willing to participate in data collection. Participatory methods have the advantage of involving potential participants in the selection of evaluation measures.
- Use participatory methods of evaluation
- Include qualitative measures
- Use culturally appropriate measures
- Employ multiple measures
- Offer staff training in project management and evaluation, if needed
- Translate evaluation measures into the language of participants or hire interpreters to provide oral translations
Qualitative methods - Qualitative measures are well suited to story telling and an oral tradition. As such, they are particularly suited to aboriginal cultures. While quantitative measures may still be required to tell the full story of a project's ability to achieve its outcomes, the use of qualitative measures will provide an in-depth and rich context to the evaluation.
Culturally appropriate measures - While many standardized measures are inappropriate for some cultures, some measures have been tested with a variety of cultures. Others, such as those developed for the Aboriginal Head Start (AHS) programs in Canada and the U.S., have been developed with particular groups in mind. The AHS programs would be good starting points for culturally appropriate measures used with aboriginal children. If it is not possible to find measures specifically developed for a particular population, ask representatives from the cultural groups you serve to review potential survey questions for evidence of cultural bias.
Multiple measures - When sample sizes are small, use more than one method of data gathering. You can use the results from various methods to corroborate each other.
Training – Remote communities and groups new to Canada may have limited experience not just with evaluation, but with developing community-based projects. In such cases, look for ways to obtain training in project planning and design. These evaluation modules developed by the NCPC may be a good start. Modules 2 and 3 focus on techniques that are useful both for evaluation planning and for project planning.
Interpreters – If your project serves new immigrants and/or refugees who have limited knowledge of English or French, set aside some money for translators/interpreters or make provisions to access volunteers who can help with these tasks. This is important not just for your evaluation, but for project activities too. Because it is not always possible to assess the accuracy of translation when oral interpretation is provided, ensure the interpreters you hire have a sound knowledge of both languages.
Translation – Translations used for evaluation purposes should ideally be translated into the language to be used, then reverse translated back to the original language. This will allow you to assess the accuracy of the translation. We know that few projects will have the resources to do this, however. At a minimum, ensure that more than one person reviews the translation for accuracy.
What other evaluation challenges come to mind?
You have undoubtedly encountered or can anticipate other challenges in evaluating community-based social development projects. Take some time to think about what they include. What are some possible solutions? We've left some space for you to record them.
Resources and supports
- Crime prevention/Community safety councils – may compile information about crime and safety issues and public perceptions of crime in your community.
- Social Planning Councils – often do studies on community trends, service needs, and other topics that may be useful.
- Public/Community Health Departments – have evaluation staff who may be able to help you develop an evaluation plan.
- Local police, provincial police, or RCMP detachments – have information about crime in your community.
- Local foundations – Some United Way branches and community foundations provide evaluation support.
- Colleges/universities – Faculty and students in criminology, applied psychology, social work, or sociology departments may be able to help with your evaluation plan and research methods.
- Web sites – see the list of resources provided at the end of this section of your handbook.
Because resources available in different locations across Canada can differ widely, this list is far from comprehensive. You may know other resources unique to your province or community that can help with various aspects of your evaluation. Talk to your partners and other stakeholders to learn about sources of support in your community.
Glossary of terms
Indicator
An indicator is a variable (or information) that measures one aspect of a program or project. It indicates whether a project has met a particular goal. There should be at least one indicator for each significant element of the project (i.e., at least one for each outcome identified in the logic model).
Logic model
A logic model is a way of describing a project or program. It is a tool to help in project planning and evaluation. A logic model describes the resources and activities that contribute to a project and the logical links that lead from project activities to the project's expected outcomes. Logic models are often depicted as a flow chart that includes the project's inputs, activities, outputs, and outcomes.
Naturalistic observation
Naturalistic observation is a method of data collection in which the researcher or evaluator observes project activities and records information about them in a structured and systematic way. Observation as a data collection method is discussed further in Module 4 of this handbook.
Respondent fatigue
Respondent fatigue can occur when participants in an evaluation are asked to respond to too many questions at once. The questionnaire, interview, or focus group becomes tedious and respondents pay less attention to their responses in an effort to complete the questionnaire or to end the interview or focus group.
Socially desirable
Sometimes respondents provide responses to a survey or measure that they believe are most favourable to their self-esteem, are most in agreement with perceived social norms (Polland, 1998), or that the researcher will want to hear. These are considered socially desirable responses.
Standardized measures
A standardized measure is one that has been administered to a very large group of people similar to those with whom the measure would be used. The data collected from this group serve as a comparison for interpreting individual, small-group, or program measure results. Standardized tests allow you to determine if an individual's test score is high, average, or low as compared to the norm (Ogden/Boyes Associates Ltd., 2001).
References
Interagency Advisory Panel on Research Ethics. (1998). Tri-Council policy statement: Ethical conduct for research involving humans (with 2000, 2002 updates). Retrieved October 12, 2004, from
http://www.pre.ethics.gc.ca/english/policystatement/policystatement.cfm
Ogden/Boyes Associates Ltd. (2991). CAPC program evaluation tool kit: Tools and strategies for monitoring and evaluating programs involving children, families and communities. Unpublished report for Health Canada, Population and Public Health Branch, Alberta/Northwest Territories Region, Calgary, AB.
Polland, R.J. (1998). Essentials of survey research and analysis: A workbook for community researchers. Retrieved November 4, 2004, from
http://www.tfn.net/%7Epolland/quest.htm
Resources
Websites
American Evaluation Society
Guiding Principles for Evaluators
http://www.eval.org/Guiding%20Principles.htm
This document was prepared by the American Evaluation Society, a professional body that represents evaluators in the United States. It provides information on professional conduct in program evaluation.
Canadian Evaluation Society
Guidelines for Ethical Conduct
http://www.evaluationcanada.ca//site.cgi?s=5&ss=4&_lang=an
This document outlines ethics guidelines for members of the Canadian Evaluation Society (CES), the professional body of evaluators in Canada.
Interagency Advisory Panel on Research Ethics
Tri-Council Policy Statement: Ethical Conduct for Research Involving Humans
http://www.pre.ethics.gc.ca/english/policystatement/policystatement.cfm
The Tri-Council Policy Statement provides ethics guidelines for research funded by three federal granting agencies: the National Sciences and Engineering Research Council, the Social Sciences and Humanities Research Council, and the Canadian Institutes of Health Research.
Government of Canada – Evaluation and Data Development
Evaluation Forum Newsletter
http://www11.hrdc-drhc.gc.ca/pls/edd/evalForNews.main
The Evaluation Forum Newsletter addresses topics such as cultural sensitivity in evaluation and conducting evaluations with Aboriginal communities.
National Council on Ethics in Human Research
http://www.ncehr.medical.org/english/home.php
This website provides various resources on ethical issues in research.
University of Michigan
Program Evaluation Standards
http://www.eval.org/EvaluationDocuments/progeval.html
Standards of conduct for individuals conducting evaluation research are listed on this site.
Manual and Guides
Holt, J.D. (1993).
"How About Evaluation: A Handbook about project self evaluation for First Nations and Inuit Communities." Department of National Health and Welfare, Medical Services Branch.
This guide is geared toward First Nations and Inuit communities that are evaluating projects and programs.
Ministry of the Solicitor General of Canada. (1998).
This manual is useful not just for First Nations communities involved in evaluation research, but for anyone interested in evaluating a crime prevention project. The self-evaluation manual leads the reader through the steps of evaluation.
National Evaluation of Sure Start
Conducting Ethical Research
http://www.ness.bbk.ac.uk/documents/GuidanceReports/165.pdf
This guide provides advice on conducting research in a way that reflects research ethics.
University of Victoria
Protocols and Principles for Conducting Research in an Indigenous Context
http://web.uvic.ca/igov/programs/masters/igov_598/protocol.pdf
This guide provides information on ethical conduct in research involving Aboriginal communities.
Textbook
Trochim, W. (2000).
The Research Methods Knowledge Base, 2nd Edition.
http://www.socialresearchmethods.net/
This on-line textbook provides a simple overview of ethical considerations in evaluation research.
Module 7 Worksheets
Worksheet #1
Challenge #1: Getting staff and partner buy-in
Solutions:
Worksheet #2
Challenge #2: Participant buy-in
Solutions:
Worksheet #3
Challenge #3: Data collection
Solutions:
Worksheet #4
Challenge #4: Realistic outcomes
Solutions:
Worksheet #5
Challenge #5: Data analysis
Solutions:
Worksheet #6
Challenge #6: Finding an evaluator
Solutions:
Worksheet #7
Challenge #7: Ethical considerations
Solutions:
Worksheet #8
Challenge #8: Reflecting cultural and community differences
Solutions:
General Resource List
Websites
American Evaluation Association
http://www.eval.org/
This is the web site for the U.S. equivalent of the Canadian Evaluation Society. The site provides information, links, and products related to evaluation.
Canadian Evaluation Society
http://www.evaluationcanada.ca
This is the website for the national organization of Canadian evaluators. It offers information, links, journals, and newsletters in both English and French.
Innovation Network Online
http://www.innonet.org
This site provides useful resources for evaluation research, ranging from general information to specific topic areas.
Management Assistance Program for Non-profits (MAP)
Basic Guide to Program Evaluation
http://www.mapnp.org/library/evaluatn/fnl_eval.htm
This website is relevant to community organizations that are conducting program evaluation. Topics range from basic evaluation concepts to challenges and issues.
Research and Statistics
http://www.ed.gov/rschstat/landing.jhtml?src=rt
This site provides a variety of resources related to research, evaluation, and best practices for education and prevention programs.
United Way of America
Outcomes Measurement Resource Network
http://national.unitedway.org/outcomes/
This site is an excellent source for an introduction to outcome measurement. It lists useful resources related to evaluation research.
United Way of Toronto
PEOD Evaluation Clearinghouse
http://www.unitedwaytoronto.com/PEOD/index.html
This site is highly recommended as a clearinghouse for evaluation guides and instruments appropriate for evaluation research.
University of Wisconsin – Extension
Program Development and Evaluation
http://www.uwex.edu/ces/pdande/evaluation/index.html
This website includes extensive coverage of evaluation information, publications, instruments, and suggestions.
Western Michigan University
Key Evaluation Checklist
http://www.wmich.edu/evalctr/checklists/kec.pdf
This document provides a checklist to help in evaluation planning and implementation.
W. K Kellogg Foundation
Evaluation Toolkit
http://www.wkkf.org/Programming/Overview.aspx?CID=281
This website provides access to downloadable publications and resources related to evaluation design.
Manuals and Guides
Child Survival
Participatory Program Evaluation Manual: Involving Program Stakeholders in the Evaluation Process
http://www.childsurvival.com/documents/PEManual.pdf
This is a comprehensive manual that thoroughly covers the processes of program evaluation. Additional features of this manual include addressing program evaluation challenges.
Health Canada
Guide to Project Evaluation: A Participatory Approach
http://www.phac-aspc.gc.ca/ph-sp/phdd/resources/guide/index.htm
This is an excellent guide for beginners in evaluation. It outlines all aspects of evaluation research.
Management Assistance Program for Non-Profits (MAP)
Basic Guide to Outcome Evaluation for Non-profit Organizations with Very Limited Resources
http://www.mapnp.org/library/evaluatn/outcomes.htm
This guide provides an overview of the basic steps in outcome evaluation. It is geared to non-profit agencies with limited resources.
National Science Foundation Directorate for Education and Human Resources
User-Friendly Handbook for Project Evaluation
http://www.nsf.gov/pubs/2002/nsf02057/nsf02057.pdf
This handbook provides an excellent overview of program evaluation, from planning to reporting results.
Horizon Research, Inc.
Taking Stock: A Practical Guide to Evaluating Your Own Programs.
http://www.horizon-research.com/reports/1997/stock.pdf
This guide provides a comprehensive overview of program evaluation.
Journals
Canadian Journal of Program Evaluation
c/o Canadian Evaluation Society, 1485 Laperriere Ave., Ottawa, ON K1Z 7S8
http://www.evaluationcanada.ca/site.cgi?s=4&ss=2&_lang=an
This journal covers a wide range of evaluation topics. Electronic access is restricted to members of the Canadian Evaluation Society (CES). Non-members can access the document at some university libraries. Memberships can be obtained through the CES website.
Practical Assessment, Research and Evaluation (Pare)
http://pareonline.net
This on-line journal provides articles pertaining to various evaluation research subjects.
Textbooks
Trochim, W.M. (2002).
Research Methods Knowledge Base, 2nd Edition
http://www.socialresearchmethods.net/
This on-line textbook introduces the user to evaluation, its basic definitions, goals, methods, and the overall evaluation process. It includes answers to frequently asked questions about evaluation.
Newsletters
Harvard Family Research Project
The Evaluation Exchange: Emerging Strategies in Evaluating Child and Family Services
http://gseweb.harvard.edu/~hfrp/eval.html
This free newsletter provides insight into various emerging issues and topics related to evaluation research.
Community/Crime Prevention Resources
Websites
These websites provides information relating to crime prevention and evaluation in First Nations communities.
National Crime Prevention Strategy
www.publicsafety.gc.ca/ncpc
The National Strategy's website offers information regarding evaluation and examples of prevention programs that have undergone evaluation. (Available in French)
Manuals and Guides
International Centre for the Prevention of Crime
From Knowledge to Policy and Practice: What Role for Evaluation?
http://www.crime-prevention-intl.org/publications/pub_4_2.pdf
This publication explores evaluation in the context of prevention. Various government frameworks for evaluation and prevention are illustrated.
National Strategy on Community Safety and Crime Prevention
You Can Do It: A Practical Tool Kit to Evaluating Police and Community Crime Prevention Programs
http://dsp-psd.pwgsc.gc.ca/Collection/J2-180-2001E.pdf
This tool kit, developed by Ottawa Police Services, provides an overview of evaluation and information for planning and implementing an evaluation and communicating results.
Northern Territory Department of Justice, Office of Crime Prevention
Guide for Community Crime Prevention Partnerships
http://www.nt.gov.au/justice/ocp/docs/guide.pdf
This guide provides insight into assessing the need for crime prevention, creating prevention partnerships, and implementing an action plan.
Footnotes
- 1
Special thanks to Brenda Simpson who graciously shared the contents of her workshop entitled Analysing, Interpreting and Reporting Outcomes. Some of the ideas in this module are taken from her workshop.
- 2
This section is adapted with permission from Kenton, N., & Sehl, M. (2002). Community Action Program for Chidren (CAPC) regional evaluation tool kit. Toronto: Health Canada.
- 3
This exercise is adapted from: Analysing, Interpreting and Reporting Outcomes Workshop by Brenda Simpson.
- Date modified: