Adapting to Rising Flood Risk
An Analysis of Insurance Solutions for Canada
A Report by Canada's Task Force on Flood Insurance and Relocation (August 2022)
Table of contents
- Glossary of General Terms
- Glossary of Insurance Terms
- Acronyms
- Executive Summary
- 1. Introduction
- 2. Flood Risk Management in Canada
- 3. Flood Hazard and Damages in Canada
- 4. Equity and Social Vulnerability Analysis
- 5. Building Policy Options for Canada
- 6. Results of Model Analysis.
- 7. Discussion
- 8. Key Findings
- 9. Conclusion and Way Forward
- 10. Annexes
Acknowledgements
This report would not have been possible without the partnership and commitment of all members of the Task Force on Flood Insurance and Relocation. These dedicated individuals representing provinces and territories, the federal government, and the private sector, worked tirelessly under tight timelines to collaborate on the various elements that culminated in this complex body of work.
The Task Force would also like to thank the many individuals and organizations who contributed extensively to this report. Researchers Dr. Jason Thistlethwaite and Dr. Daniel Henstra from the University of Waterloo, and chief actuaries Dr. Mathieu Boudreault from University of Quebec in Montreal and Dr. Michael Bourdeau-Brien from Laval University all provided their time and significant expertise to advance this work. The Task Force also gratefully acknowledges the input into the work from Indigenous communities and individuals whose perspectives on these topics help to shape the findings, and thanks Kuwingu-neeweul Engagement Services for their assistance with this engagement. Partners for Action was also instrumental in helping the Task Force to understand key considerations for relocation. The Task Force would like to thank Dr. Daylian Cain, Senior Lecturer at the Yale School of Management, for his expertise in identifying insights from the field of behavioural economics.
Finally, the Insurance Bureau of Canada has been an important partner in this endeavor from the very early stages of planning, helping to coordinate the participation of the private sector in the work of the Task Force, and along with the many industry partners, providing thoughtful and constructive feedback on each piece of analysis.
Introductory Letter from the Task Force Principals Committee
June 10, 2022
Rob Stewart
Deputy Minister of Public Safety Canada
269 Laurier Avenue West
Ottawa ON K1A 0P8
Romy Bowers
President and Chief Executive Officer
Canada Mortgage and Housing Corporation
700 Montreal Road
Ottawa ON K1A 0P7
Dear Rob Stewart and Romy Bowers,
On behalf of the Task Force on Flood Insurance and Relocation (the Task Force), we are pleased to present to you the culmination of our work in the enclosed report: Adapting to Rising Flood Risk: An Analysis of Insurance Solutions for Canada.
As you are both aware, Canada is flooding more often, more severely, and with growing social, housing, environmental, and economic impacts. Flood-related disaster costs are at an all-time high and projected to keep rising, exacerbated by climate change and continued development in high risk areas. It is a complex challenge that must be met with multiple interconnected solutions and requires collaboration across whole-of-society partners.
In his December 2021 mandate letter to the Minister of Emergency Preparedness, the Prime Minister of Canada re-affirmed the federal commitment to advance work on one such solution: to bring affordable flood insurance to homes in high risk areas that cannot currently access this kind of protection. Over the past eighteen months, the Task Force, under our guidance as the Principals committee, has taken on this complex work collaborating with federal, provincial and territorial governments, the insurance industry, Indigenous representatives, municipalities, academics, consultants, researchers, and actuarial experts. We are particularly grateful to the tireless efforts of provincial/territorial, federal and industry Task Force members (full membership list in Annex A of the report) who gave their time, energy, and expertise to this work.
This Report presents the facts and the evidence-based analysis of diverse academics, actuaries, researchers and Task Force members. The Task Force brought a variety of skillsets to this work, including a range of technical, policy, and operational backgrounds, and while individual members did not all have the expertise to input into each area equally, every effort has been made to accommodate and include all perspectives. The Report is not intended to represent universal consensus among all organizations or professionals engaged in the process, but to provide the foundational information gathered by the Task Force to advance a national flood insurance solution in Canada.
While important progress has been made in this report, continuing to advance this work will require coordination and commitment from each stakeholder to exercise their jurisdictional role and develop a way forward for implementation. Doing so will help to better protect Canadians, and ensure that flood risk is at the forefront for housing, communities, industry and governments as we strive for a more resilient future.
Yours sincerely,
Principals Committee
Flood Insurance and Relocation Task Force
Trevor Bhupsingh
Assistant Deputy Minister
Emergency Management Programs Branch
Public Safety Canada
Amy Graham
Senior Market Underwriter, VP Americas
Swiss Reinsurance Company
Dave Peterson
Assistant Deputy Minister
Community Disaster Recovery
Emergency Management BC
Steven Mennill
Chief Climate Officer
Canada Mortgage and Housing Corporation
Jordan Brennan
Vice President, Policy Development
Insurance Bureau of Canada
Helen Collins
Director (A)
Municipal Programs and Analytics Branch
Ministry of Municipal Affairs and Housing
Government of Ontario
Glossary of General Terms
- All-hazards
- An emergency management approach that seeks to comprehensively address vulnerabilities exposed by both natural and human-induced hazards and disasters. This approach increases efficiency by recognizing and integrating common emergency management elements across all hazard types, and then supplementing these common elements with hazard specific sub-components to fill gaps only as required. By assessing the risks associated with all hazards in an integrated way, efforts may be broadly effective in reducing the vulnerability of people, property, the environment and the economy.
- Canadian
- This term is used informally throughout the report to signify any person residing in Canada.
- Core Housing
- Households which occupy housing that falls below any of the dwelling adequacy, suitability, or affordability standards and which would have to spend 30% or more of their before-tax income to pay for the median rent of alternative local market is considered in core housing need.
- Critical infrastructure
- The processes, systems, facilities, technologies, networks, assets and services essential to the health, safety, security or economic well-being of Canadians and to the effective functioning of government.
- Decile
- Each of ten equal groups into which a population can be divided according to the distribution of values of a particular variable.
- Disaster
- An event that results when a hazard impacts a community in a way that exceeds or overwhelms the community's ability to cope and may cause serious harm to the safety, health or welfare of people, or damage to property or the environment.
- Disaster risk reduction
- The concept and practice of reducing disaster risks through systematic efforts to analyze and manage the causal factors of disasters.
- Emergency
- A present or imminent event that requires prompt coordination of actions concerning persons or property to protect the health, safety or welfare of people, or to limit damage to property or the environment.
- Emergency management
- The management of emergencies concerning all hazards, including all activities and risk management measures related to prevention and mitigation, preparedness, response and recovery.
- Exposure
- The people, property, systems, or other elements present in hazard zones that are thereby subject to potential losses. Exposure data sets for flooding include location data and detailed property information (e.g., presence of a basement in a residential structure).
- Financial sector policy tools
- Tools at the disposal of federal, provincial, and territorial governments with respect to the regulation of the financial sector. These may include measures that could impact aspects of insurance, including the standardization of insurance policies, rules covering the offer, take-up, or purchase of insurance (including but not limited to insurance and mortgage-related requirements), among others.
- Flooding (Pluvial, Fluvial, Coastal)Footnote 1
-
- Pluvial
- The temporary inundation by water of normally dry land, usually caused by extreme rainfall events and not necessarily near to water bodies. Pluvial flooding is common in urban areas where water temporarily accumulates due to more rainfall entering an area than can be removed by infiltration into the ground and discharge through infrastructure (e.g., storm sewers).
- Fluvial
- The temporary inundation by water of normally dry land adjacent to a river or lake and caused by excessive rain, snowmelt, high lake water levels, waves, storm surges, stream blockages including ice jams, failure of engineering works including dams, or other factors.
- Coastal
- Flooding associated with a defined shoreline along an ocean. This can be due to a combination of high tides, storm surges, waves, rising sea levels and riverine flooding.
- Hazard
- A potentially damaging physical event, phenomenon or human activity that may cause the loss of life or injury, property damage, social and economic disruption or environmental degradation.
- High riskFootnote 2
- Defining areas as high risk for flooding can be done in different ways depending on the end intent. Commonly used methods, including applying the 1/100 year return period (or annual exceedance probability) gives an indication of extent of some kinds of floodwater, but not the damage it may cause. To capture the expected risk, and include wider range of flood types, it is necessary to combine hazard and exposure data into metrics such as the average annual loss (AAL) expected at the property level. For the purpose of this report's social vulnerability work and Canada-wide damage estimations, high risk is noted as the top 10% of risk, by AAL (highest risk is the top 1%). For the costing of some insurance models later in this report, 'high risk' will be defined as homeowners who exceed a defined price threshold for coverage of expected damage: where a flood insurance premium would cost over 0.1% of coverage (e.g., $300 for a $300,000 policy).
- High risk homeowners
- For the costing of some insurance models later in this report, 'high risk homeowners' will be defined as those for whom flood insurance premiums exceed a defined price threshold for coverage of expected damage: where the premium would cost over 0.1% of coverage (e.g., $300 for a $300,000 policy).
- Mitigation
- Actions taken to reduce the impact of disasters in order to protect lives, property and the environment, and to reduce physical risk and economic disruption. Note: Mitigation includes structural mitigative measures (e.g., construction of floodways and dikes) and non-structural mitigative measures (e.g., building codes, land-use planning and insurance incentives). Prevention and mitigation may be considered independently, or one may include the other.
- Preparedness
- Actions taken prior to a disaster to be ready to respond to it and manage its consequences. Note: Preparedness actions include emergency response plans, mutual assistance agreements, resource inventories and training, equipment and exercise programs, as well as public education.
- Prevention
- Actions taken to eliminate the impact of disasters in order to protect lives, property and the environment, and to avoid economic disruption. Note: Prevention and mitigation include structural mitigative measures (e.g., construction of floodways and dikes) and non-structural mitigative measures (e.g., building codes, land-use planning and insurance incentives). Prevention and mitigation may be considered independently, or one may include the other.
- Recovery
- Actions taken to repair or restore conditions to an acceptable level after a disaster. Note: Recovery actions include the return of evacuees, trauma counselling, reconstruction, economic impact studies and financial assistance.
- Residence
- The concepts of residences, addresses, homes, households and dwellings are used interchangeably in this Report and they are understood as being synonymous. Properties currently in scope for this Report include residential structures that are privately owned, regardless of type or purpose, and for which no other form of insurance (commercial, agricultural, tenant, condominium) coverage applies.
- ResilienceFootnote 3 Footnote 4 Footnote 5
- Resilience is the capacity of a system, community or society exposed to hazards to resist, absorb, accommodate, adapt to, transform and recover from the effects of a hazard in a timely and efficient manner, including through the preservation and restoration of its essential basic structures and functions through risk management.
- Response
- Actions taken during or immediately before or after a disaster to manage its consequences and minimize suffering and loss. Note: Response actions include emergency public communication, search and rescue, emergency medical assistance, evacuation, etc.
- Risk
- The combination of the likelihood and the consequence of a specified hazard being realized; refers to the vulnerability, proximity or exposure to hazards, which affects the likelihood of adverse impact.
- Risk management
- The use of policies, practices and resources to analyze, assess and control risks of health, safety, the environment and the economy.
- Strategic relocation
- Strategic relocation, also referred to as managed retreat, is the purposeful movement of people, buildings and infrastructure out of areas where there is a high likelihood of incurring severe and/or repetitive damage as a result of a hazard. Strategic relocation contributes to disaster risk reduction by effectively eliminating risk within a given area by removing exposed property and assets at highest risk of repetitive hazard impact.
- Viability
- For this Report, viability refers to feasibility of insurance models within the overall Canadian context, while meeting the Policy Objectives established by the Task Force.
- Vulnerability
- A condition, or set of conditions, determined by physical, social, economic and environmental factors or processes that increases the susceptibility of a community, or property, to the impact of hazards. Note: Vulnerability can change over time and is a measure of how well-prepared and well-equipped a community, or property, is to minimize the impact of or cope with hazards.
Glossary of Insurance Terms
- Additional Living Expenses
- The extra expenses incurred when it is impossible to remain in a dwelling which has been damaged by a flood, fire, or another insured peril.
- Average Annual Loss
- Average Annual Loss, or AAL, is the cost of flood damage, expressed in dollars per year, that is expected to occur each year, averaged over the long term. While AAL provides a useful basis for calculating annual insurance premiums, it is important to note that the average can obscure the fact that losses are often negligible most years, and can be catastrophic when a significant flood event occurs.
- Bundling
- The act of grouping together certain perils within an insurance policy (could include different flood perils or could mean bundling flood perils with other natural hazard perils, depending on the design choices of insurance policies).
- Cap (on insurance premiums)
- An upper limit of premium price that is charged to the consumer by the insurer as a way of keeping prices affordable. Employing caps means that some quantity of risk above the premium cap price is absorbed by another entity, policyholders, or funded externally.
- Coverage
- The insurance afforded by the policy.
- Deductible
- The amount of an insurance claim that the insured is responsible for and the company deducts for payment. Deductible can be a dollar amount, a percentage of each claim or a percentage based on the insured amount.
- Endorsement
- An endorsement, also known as a rider, can be used to add optional coverages. Endorsements are contract language used to add, delete, exclude, or otherwise alter insurance coverage.
- Exclusion
- That which is expressly eliminated from the coverage of an insurance policy.
- Homeowners Insurance
- A type of property insurance that covers a private residence. Such insurance typically provides protection for structures and contents against a range of perils (both natural and technical in nature). It also protects the policyholder from certain liability issues and may provide living expenses in the event of loss of use of the property. Depending on the type of policy purchased ("Broad" or "Basic/Named perils" on the low end, to "Comprehensive" or "All perils" on the premium or deluxe end), homeowners insurance policies in Canada often provide coverage for a range of both weather- and non-weather related perils.
- Mandatory offer
- Either by regulation or by contract requirement, insurers selling a specified product must offer specified coverage to any consumer looking to buy their product.
- Mandatory take-up/purchase
- A requirement for homeowners to purchase insurance, typically by government regulation of various economic activities.
- Overland Flood
- Where water flows overland and seeps into buildings through windows, doors and cracks.
- Overland Flood Insurance
- Insurance coverage to provide protection for direct physical losses associated with the overland flood including sewer back-up due to flood.
- Premium Loading Factor
- The additional costs that must be added to a property's average annual losses to calculate a premium price for an insurance policy. The loading factors for this report include costs such as: insurance operating cost, safety margin (covering insurer's losses when higher than anticipated), premium taxes, and the increased level of benefit to consumers of additional living expenses.
- Reinsurer
- An insurance company that specializes in providing coverage to insurance companies for large and or catastrophic losses. Reinsurance is a risk transfer mechanism between an insurance company, and a reinsurer that accepts the risk.
- Residual risk
- Risk that remains after implementing risk mitigation or risk transfer measures. When considering insurance models, residual risk can be thought of as the amount of financial risk that homeowners are not insured for, either the result of being uninsured or underinsured (insured with insufficient coverage for their risk).
- Sewer Backup
- Loss or damage caused by the discharge, backing up or escape of water from a sewer conduits (sump, interior floor drain, or septic tank).
- Tail risk
- Tail-risk flood events are those with a low probability of occurrence, such as floods exceeding the 1 in 1000-year return period. Tail risks are innately uncommon but can cause significant damage in areas of high exposure. Such events would likely not have been captured using historical, or individual, year loss estimates given the relatively short period of comprehensive historical record-keeping from previous flood events.
Acronyms
- AAL
- Average Annual Loss
- AAIL
- Average Annual Insured Loss
- ADR
- Average Damage Ratio
- AEP
- Annual Exceedance Probability
- AFN
- Assembly of First Nations
- ALE
- Additional Living Expenses
- AMI
- Area Median Income
- CD
- Census Division
- CIRNAC
- Crown-Indigenous Relations and Northern Affairs Canada
- CMHC
- Canada Mortgage and Housing Corporation
- DB
- Dissemination Block
- DFA
- Disaster Financial Assistance
- DFAA
- Disaster Financial Assistance Arrangements (federal program)
- EM
- Emergency Management
- EMA
- Emergency Management Act
- FIRP
- Flood Insurance and Relocation Project
- FPT
- Federal / Provincial / Territorial
- FRM
- Flood Risk Management
- FTT
- Federal Task Team
- IBC
- Insurance Bureau of Canada
- IPCC
- Intergovernmental Panel on Climate Change
- ISC
- Indigenous Services Canada
- ITT
- Industry Task Team
- KES
- Kuwingu-neeweul Engagement Services
- NDMP
- National Disaster Mitigation Program
- PC
- Principals Committee
- PS
- Public Safety Canada
- PT
- Province/Territory, or Provincial/Territorial
- PTT
- Provincial/Territorial Task Team
- SOVI
- Social Vulnerability Index
- TF
- Task Force
Executive Summary
Flooding is the source of Canada's most common and costly disasters. In order for a flooding event (the flood hazard) to cause a disaster, it must impact a community in a way that exceeds the community's ability to cope (the exposure and vulnerability). Recent trends are exacerbating both the flood hazard, as well as increasing Canada's exposure and vulnerability to flooding. Climate change is projected to increase the frequency, severity and variability of all types of flooding (pluvial, fluvial and coastal) in the coming decades. At the same time, Canada's exposure to flooding is growing as a result of increasing housing, infrastructure development, and asset concentration in flood-prone areas. Finally, the complexity of Canadian society with its unique characteristics linked to our history and governance systems, demographics, and our relationship with Indigenous communities can perpetuate vulnerability and inequality in disaster impacts. These trends will continue to coalesce leading to increases in the financial cost of flooding on Canadian society in the years to come.
Until recently, disasters in Canada have typically been managed through reactive measures during the response and immediate aftermath of major events. Based on hard-learned lessons from large-scale disaster events of the past two decades, however, federal, provincial and territorial governments have been shifting towards a more holistic and strategic vision for emergency management. This vision emphasizes proactive risk reduction and long-term building back better in order to increase the resilience of Canadian society to future disasters.
For flooding, a key component of this shift is recognizing the power and effectiveness of risk awareness, mitigation, and other risk reduction tools, such as strategic relocation and the use of natural infrastructure, to help manage the impacts of flooding and better protect Canadians. Equally important, is ensuring that Canadians get access to the financial assistance they need following a disaster in order to recover, persevere and adapt to the future.
Insurance is one tool that can provide more predictable and comprehensive financial coverage to Canadians impacted by flooding. Further, by sending a price signal about the true levels of flood risk, insurance can help encourage whole-of-society risk reduction behaviours. In order to be equitable and effective, however, flood insurance must be readily available and affordable for all Canadians. This needs to be true for those in areas most exposed to flooding and for those Canadians most vulnerable to the negative impacts of flood events. The current market, however, fails to cover Canadians in high risk areas, creating a protection gap that renders flood insurance in its present form ineffective in managing flood risk.
A Task Force to Explore Insurance Solutions
The Government of Canada established the Task Force on Flood Insurance and Relocation (the "Task Force") in order to advance a sustainable solution to rising flood costs. The Task Force conducted its work collaboratively with partners from the Government of Canada, provincial and territorial governments, the insurance industry, and other stakeholders concerned with Canada's growing flood risk. The work of the Task Force included some targeted engagement with academics, Inuit, Métis and Indigenous people living off-reserve, and other organizations. Indigenous Service Canada along with the Assembly of First Nations also undertook a complementary initiative exploring the needs of First Nations with respect to home flood insurance.
The Task Force's work involved several interconnected and concurrent streams of work. At the onset, six Public Policy Objectives were co-created and endorsed by federal, provincial and territorial (FPT) government representatives to guide the exploration and provide an evaluation framework to later assess the viability of insurance arrangements:
- Provide adequate and predictable financial compensation for residents in high-risk areas.
- Incorporate risk-informed price signals and other levers that promote risk-appropriate land use, mitigation, and improved flood resilience.
- Be affordable to residents of high-risk areas, with specific consideration for marginalized, vulnerable, and/or diverse populations.
- Provide coverage that is widely available for those at high risk across all regions.
- Maximize participation of residents in high-risk areas.
- Provide value for money for governments and taxpayers.
Building on the Public Policy Objectives, the early phases of the project included policy reviews, in-depth academic research, international case study analysis, a data-driven social vulnerability analysis, and engagement with FPT governments, the insurance industry, academics, and Indigenous communities. The Task Force, through Public Safety Canada, also developed the most robust flood hazard and damage analysis ever completed in Canada. Finally, the policy research and flood risk data formed the inputs for the actuarial analysis, the final phase of the project needed to help quantify the costs of the four different insurance models explored by the Task Force.
A Shared Evidence-Basis for Decision-Making
This report is a statement of facts and is the output of the Task Force's efforts. The report seeks to provide a common understanding of the evidence and information required to implement viable arrangements for a national approach to flood insurance, with special considerations for potential strategic relocation of those at most extreme risk.
The completion of this report does not infer perfect unanimity among all Task Force members of all points. Where specific differences on issues of substance were identified by Task Force members, they were provided with the opportunity to draft dissenting opinion position papers in order to flag their views but still enable rapid progress in line with majority views or balance of the evidence, under tight timelines. As such, the report is the product of a dedicated partnership among all Task Force members in exploring solutions for this costly and devastating issue.
The report outlines the evidence basis upon which a potential insurance arrangement and relocation strategies could be built. It seeks to articulate the interplay between the Public Policy Objectives and insurance arrangement features. The insurance models analyzed in this report were designed to showcase the relative strengths and weaknesses of different approaches, but were not intended to indicate the exact costs, parameters, and logistics that would be applied in implementation. The report, by design, does not formally recommend or advocate for one particular model over another. This was done because all of the explored models offer specific trade-offs and compromises among Public Policy Objectives, and the decision about which of these concessions are most appropriate is ultimately the purview of FPT governments. Similarly, policy options and program design for relocation is beyond the scope of this work. This report offers readers straightforward, evidence-based information that provides common ground to support timely decision-making.
Key Findings of the Task Force
The work of the Task Force covered research on understanding Canada's risk landscape, analyzing social vulnerability in areas of high flood risk, examining models for flood insurance, and exploring how relocation can help to reduce risk. Key findings are summarized here:
Current Flood Risk
- Total residential flood risk in Canada is estimated at $2.9billion per year
Markedly higher than previous estimates, this amount includes the effects of larger 'tail risk' events and reflects more accurate estimations of a number of residences and predicted damages (based on 2020 data). - The vast majority of risk is concentrated in a small number of the highest risk homes
Of the $2.9 billion, 89.3% is concentrated in the top 10% highest risk homes. 34.1% is concentrated in the top 1% of highest risk homes.
Insurance Considerations
- Some standardization is needed in the market
Moving towards clear and standardized language in flood insurance reduces confusion about coverage and allows for a more informed choice for homeowners. Making flood coverage more comprehensive and seamless through bundling of flood insurance products is likely to streamline the claim process, improving both financial and mental health outcomes post-flood. Furthermore, ensuring that Canadians are not left underinsured for their risk is an important consideration for the design of any insurance model. - Participation is key
A carefully designed flood insurance solution can ensure better protection for Canadians, help to share the costs more broadly, and provide incentive for risk reduction. However if such a solution is to replace government financial assistance for residential flood risk, maximizing participation in the insurance arrangement through affordability measures, incentives and/or mandates, is critical to protecting Canadians. Without these interventions, barriers to insurance will remain, leaving more risk on vulnerable Canadians and people living in high-risk areas. - Greater public intervention can more fully close protection gaps, but at a cost
Costs paid by governments are aimed at achieving higher participation rates and increasing affordability. These costs viewed in isolation may seem high, but they must be compared with the alternative scenario: the costs otherwise fall to public DFA programs or on the shoulders of un- or under-insured homeowners. There is no scenario in which these costs disappear without significant investments to remove, or reduce, the risk.
Relocation Considerations
- Relocation can be a powerful risk reduction tool
Relocating the highest risk and repetitive loss properties removes risk rather than transferring or mitigating it, and can be very impactful in improving overall viability and lowering the costs of insurance options. At the same time, the practicality of relocation in areas already experiencing a shortage of available and affordable housing necessitates considerations for in-place mitigation measures. - Relocation must be informed at the community level
Despite the clear risk reduction benefits, relocation is highly complex, and can have major impacts on households and communities. The decision is especially significant for Indigenous communities with strong ties to their ancestral, traditional land. It is important that engagement on how to apply relocation happens early - between jurisdictions and with communities - and offers communities and impacted residents the opportunity to provide input, increasing their sense of agency and trust in the process.
Equity Considerations
- Affordability of flood insurance premiums is key to enabling equitable access
Without supports for socio-economically disadvantaged groups, any program where insurance is optional will likely exacerbate their exclusion and marginalization. For mandatory insurance models, consideration must be given to individuals and communities for whom insurance may not be an appropriate solution (e.g., due to differing home/land ownership arrangements, or for those living in significant poverty). Moreover, targeting affordability measures where needed most can be complex, and considerations of feasibility should factor into model design. - Pathways to accessing insurance are about more than just money
Considerable effort is needed to remove barriers and support access to insurance, which includes promoting greater financial literacy around insurance, building capacity within community organizations that support housing for vulnerable populations, and ensuring a national-level solution can adapt to regional or cultural contextsFootnote 6. The realities for many Indigenous and Northern communities also call for balance and cohesion with related initiatives on housing, poverty, and health. Policies should strive to more broadly reduce the impacts to those most vulnerable to the effects of flooding. - The cultural connections of Indigenous peoples to water and land must be respected
Indigenous knowledge, culture and perspectives on the natural world must be respected, and should be recognized as foundational in informing how all stakeholders can approach flood risk management across Canada. Further engagement with and learning from Indigenous communities, governments, organizations and individuals, including in the form of healing and sharing circles, would help to ensure that FRM initiatives are informed by Indigenous voices.
Living with Water
The foreseeable future suggests that Canadians must learn to live with water. Yet, the country cannot do this at the expense of safety, fiscal responsibility, or equity.
It is clear from this work that flood insurance solutions for high-risk areas can be designed to meet the Public Policy Objectives; however, each model examined contains trade-offs that must be balanced. It is also apparent that given the amount of flood risk in Canada, none of the insurance models can provide affordable insurance and also be financially self-sufficient, at least in the short term. Even over a longer-term (25 year) transition to risk-based pricing, financial sustainability will continue to be challenged by inflation, significant asset concentration in flood-prone areas, and long-term climate change pressures.
Consequently, to live with water, Canada will require more than an insurance solution to address its flood risk landscape. Insurance must be deployed in conjunction with information, investments and incentives at all levels that are designed to reduce flood risk. Such elements include: improved flood mapping and public awareness of flood risk, risk reduction by all stakeholders, improved land-use planning, and climate-resilient built and natural infrastructure. In addition, for an insurance solution to be successful, recovery funding provided to residential properties for flooding though FPT disaster financing programs would need to cease or be restructured to avoid undermining the insurance system. This is an important step towards aligning responsibilities for flood risk.
The findings in this report are meant to provide governments with the foundation to understand the different policy levers and key considerations to be factored into decision-making, and to ensure that any insurance solution strives to effectively meet the defined policy objectives and serve all Canadians impacted by flooding. Particularly, it is important to consider policy options that account for the populations that are disproportionately affected by floods and have lower levels of resiliency to cope with them.
Continuing to advance this work will require coordination and commitment from each stakeholder to exercise their jurisdictional role and develop a way forward for implementation. The collective challenge will be to not let the perfect be the enemy of the good, thereby preventing the implementation of a solution that could nonetheless dramatically improve upon the status quo for Canadians who remain at high risk and who continue to experience tremendous loss from ever-increasing flood events. A new approach to flood insurance will not solve all vulnerability to flooding. However, with a strong stakeholder commitment and decisive action, it could play an important role in empowering Canadians to adapt to flood risk, and building disaster resilience across our nation.
1. Introduction
Globally, natural disasters are increasing in frequency, severity, and economic impact. Drivers of rising disaster impacts include shifting patterns of natural hazards and rising exposure of people, infrastructure, and the environment. In recent years, the gap between insured losses and total economic losses has also widened significantly. In 2020, this "protection gap" widened to a record $231 billion worldwide, with around 75% of potential global losses from natural disasters remaining insured with insufficient coverageFootnote 7. The consequences of this are already being experienced across Canada, where disaster costs have risen dramatically in recent years. Before 1995, only three disasters in Canadian history exceeded $500 million (2014 dollars), but from 2013 to 2017, Canada had disaster losses totaling $16.4 billion. Prior to 2009, insured losses from catastrophic severe weather averaged $400 million per year; since then, the annual average has reached $1.4 billionFootnote 8.
The trajectory of disaster trends poses significant risks to the health and well-being of Canadians, the economy, and the natural environment. Governments and other stakeholders must continue to work together to address the growing impacts of disasters. In 2019, the federal, provincial, and territorial (FPT) governments approved the Emergency Management Strategy for Canada: Toward a Resilient 2030 (EM Strategy), which provides a long-term, strategic vision for emergency management in Canada that is aligned with the United Nations Sendai Framework for Disaster Risk ReductionFootnote 9.
The Emergency Management Strategy seeks to guide federal, provincial, and territorial governments and their respective EM partners (including but not limited to: Indigenous peoples, municipalities, communities, volunteer and non-governmental organizations, the private sector, critical infrastructure owners and operators, academia, and volunteers) to build resilience through five priority areas for action:
- Enhance whole-of-society collaboration and governance to strengthen resilience;
- Improve understanding of disaster risks in all sectors of society;
- Increase focus on whole-of-society disaster prevention and mitigation activities;
- Enhance disaster response capacity and coordination and foster the development of new capabilities; and
- Strengthen recovery efforts by building back better to minimize the impacts of future disasters.
Priority 3 includes as a priority outcome that "FPT governments assist in the development of options for sharing the financial risk of disasters", which could include "engag[ing] the private sector to develop an affordable private flood insurance model for the entire population, including clear incentives for mitigation of flood risks".
In Canada, recent efforts to reduce disaster risk have focused in large part on flooding, given that it is the country's most common and costly natural disaster. Flooding has caused approximately $1.5 billion in damage to households, property and infrastructure in Canada annually in recent years (approximately $700 million in insured losses and $800 million in uninsured losses), with residential property owners bearing approximately 75% of uninsured losses each yearFootnote 10 Footnote 11. Several million homes in Canada are vulnerable to flooding, and many cannot access adequate insurance to protect themselves. These households must rely on their own resources or limited post-disaster financial assistance from governments or not-for-profit groups to recover from flooding events, which do not fully compensate for all financial losses.
To address this gap, the Government of Canada stood up the Task Force on Flood Insurance and Relocation (the Task Force) with the goal of exploring viable solutions for insurance in high risk areas and considerations for potential relocation of homes most at risk of repeat flooding.
This report covers the findings of the Task Force, summarizing the results of two years of in-depth research, analysis, and collaborative development among stakeholders. It provides an evidence-based understanding of flood risk in Canada, lays out the parameters for potential insurance models, and provides an overview of the impact of relocation and risk reduction to help inform decision-making and the way forward. The report, by design, does not formally recommend or advocate for one particular model over another. This was done because all of the explored models offer specific trade-offs and compromises among Public Policy Objectives, and the decision about which of these concessions are most appropriate is ultimately the purview of FPT governments. Similarly, policy options and program design for relocation is beyond the scope of this work. The Task Force aimed to provide readers straightforward, evidence-based information that provides common ground to support timely decision-making.
This report is organized into the following sections:
Section 1 sets the context for flood risk in Canada, describes the multi-stakeholder environment, defines the problem, and provides an overview of the Task Force on Flood Insurance and Relocation.
Section 2 defines further what FRM looks like in Canada, and provides an overview of risk reduction.
Section 3 details what has been learned about flood hazard, exposure and risk in Canada, which provides the foundation for much of the analysis to follow.
Section 4 provides a focused sociodemographic analysis of vulnerable people and regions in Canada that warrant important consideration in the analysis of insurance and relocation.
Section 5 summarizes the foundational policy research behind the proposed models, including the findings from an international review, and provides the specific public policy objectives that guide the work of the Task Force.
Section 6 presents and describes the four models that were analyzed, outlines the results of the costing exercise, and provides some high level results on strategic relocation.
Section 7 provides a discussion of what the Task Force learned for each public policy objective, and reviews the general strengths and weaknesses of the four models.
Section 8 provides a summary of the key findings of the Task Force.
Section 9 concludes the report with an overview of next steps, and the collaborative way forward.
1.1 Overview of Flood Risk in Canada
The concept of 'risk' is often misunderstood. In the context of disasters, risk is the combination of the likelihood and the consequence of a specified hazard being realized. It refers to the vulnerability, proximity or exposure to hazards, which affects the probability of adverse impactFootnote 12. Flood risk, therefore, combines the hazard (floodwater) with what is exposed to that hazard (e.g., people or assets), and provides information on the subsequent impacts or consequences. For example, projected increases in extreme precipitation due to climate change may increase the flood hazard by increasing the amount of water expected during flood events, and if this additional flood water is in contact with exposed assets, overall flood risk increases. Similarly, by increasing the exposure of people and assets to flooding by developing floodplains, flood risk increases. It is also possible to reduce flood risk by reducing the physical exposure of structures (e.g., relocation) or the vulnerability of populations to flooding (e.g., by building resilient infrastructure). Flood insurance is a financial risk transfer mechanism, whereas strategic relocation is an effective means of eliminating physical flood exposure.
General types of flooding can include fluvial, pluvial, or coastal, but how these different floods manifest, sometimes in combination, can vary widely across regions. The Rocky Mountains, for example, are susceptible to flash flooding (very rapid increases in water levels), whereas flooding in the prairies can sometimes be anticipated days in advance, allowing more time for flood preparation. In other regions, erosion caused by coastal storm surges and rising sea levels are a significant mechanism of flood losses.
1.2 Key Drivers of Canada's Flood Risk
Population growth and urban development
Canada's densification and development in urban areas already exposed to significant flood hazard is a major driver of flood riskFootnote 13. Although flooding can have devastating impacts on small communities, the risk is more concentrated in large urban centres with higher population densities, which are the fastest growing areas in the country and home to more than 70% of Canada's populationFootnote 14. Many Canadian cities are built on or near floodplains, and more than 6.5 million Canadians live along coastlinesFootnote 15. The growing exposure to sources of flood risk contributes to the increasing frequency and economic consequences of flood events.
Within concentrated areas of population comes increased industrial, service, and trade activity and development, which drive up the value of assetsFootnote 16. The rapidly rising cost of flood events is largely a result of growing exposure, through the increasing number of people and assets in at-risk areas, and the increasing value of those assetsFootnote 17. Many of the metropolitan areas that serve as hubs of Canada's economic activities have substantial exposure to flood risks, including Toronto, Montreal, and Vancouver, which are also home to over a third of CanadiansFootnote 18. The geographical concentration of assets is compounded by the increasing trend of homes with finished basements. Without sufficient adaptation, risk mitigation, and maintenance of aging infrastructure, development in at-risk areas will continue to drive up the costs of floodingFootnote 19.
Climate change
Canada's climate is warming at twice the global rate and three times faster in the North. Due to Canada's size and geographic diversity, the impacts of warming temperatures are unevenly distributed and vary significantly across and within regions. Some localities have already begun to experience the effects of climate change on flood risk through shifting rainfall patterns, extreme weather events and rising sea levels, but the greatest impacts are still to comeFootnote 20. Global and domestic climate projections predict more extreme temperatures, sea-level rise, and the increasing frequency and intensity of weather events in the coming decadesFootnote 21 Footnote 22.
There are multiple dimensions to climate-driven flood risk, which impact all regions in Canada. Warmer temperatures increase the likelihood and magnitude of extreme precipitation eventsFootnote 23. This contributes to pluvial flood risk, especially in urban areas which have more impermeable surfaces, such as pavement and concrete, and where design standards for existing aging infrastructure may not account for the higher end of extreme precipitation events. Intense rainfall can increase fluvial flood risk too, especially where these events occur during late fall or early spring when the existence of a snow pack and frozen ground means more and faster runoff into streams and rivers.
Rising sea levels along many Canadian coastlines over the coming decades will increase coastal flood risk for both tidal flooding and storm surges. There is also emerging evidence of a slight northward shift of storm tracks over the North Atlantic Ocean and Canada as a wholeFootnote 24, which may increase the risk of hurricanes and other large storm systems.
Extreme heat also contributes to flood risk, although more indirectly: longer periods of higher temperatures increase the likelihood and severity of wildfires and droughts, which destroy vegetation and topsoil and therefore reduce the ability of local ecosystems to absorb water. When these events are followed by periods of rainfall, the ground cannot absorb as much moisture and the runoff increases the risk of flooding. This pattern was seen in the lead up to the 2021 atmospheric river flooding in British Columbia where extreme heat exacerbated wildfires earlier that year made areas more vulnerable to flooding and landslidesFootnote 25.
Because of the deep complexity and interconnectedness of climatic systems, it is difficult to predict the exact rates of these changes and even more difficult to determine individual local or regional impacts. While some uncertainty exists, the latest Intergovernmental Panel on Climate Change (IPCC) report cautions that as regions reach climatic tipping points, there is high confidence in the increased probability of severe local impacts and unprecedented weatherFootnote 26. The IPCC has also noted that a key risk in North America is increasing weather and climate extremes (including precipitation events), as well as compounding and cascading climate hazards (e.g., future sea level rise combined with storm surge and heavy rainfall will increase compound flood risks)Footnote 27. How Canada experiences the impacts of climate extremes depends not only on the extremes themselves but on interdependent socioeconomic factors that contribute to exposure and vulnerabilityFootnote 28.
1.3 Defining the Problem
Recent trends in the key drivers of Canada's flood risk – climate change, growing population, increasing housing, infrastructure development, and asset concentration in flood-prone areas – are exacerbating both the flood hazard, as well as increasing Canada's exposure and vulnerability to flooding.
Insurance is one way that Canadians can be predictably and comprehensively covered for flood damages. When operating as a mature and effective market, insurance also sends a price signal about the true levels of risk, spreads the financial burden amongst different stakeholders, and can encourage whole-of-society risk reducing behaviours.
In order to be equitable and effective, flood insurance must be readily available and affordable for all Canadians; this especially needs to be true for those in areas most exposed to flooding. The current failure of the market, however, is that coverage is only being provided in low and medium risk areasFootnote 29, creating a protection gap that leaves the vast majority of flood risk in Canada uninsured. High-risk areas account for approximately 90% of Canada's residential flood risk (see Section 3), which leaves most of the costs for flood damages on the shoulders of homeowners, and for catastrophic events, on government disaster financial assistance (DFA) programs. Therefore, in high risk areas, homeowners either get effectively free insurance (subsidized by taxpayers) through DFA when provided, or are forced to manage the financial risk on their own. This market failure is what the Task Force work is meant to address: how to make flood insurance available and affordable for those living in high risk areas.
90% of the financial flood risk for homes in Canada sits with the top 10% of high-risk homes.
High costs of insurance
In high-risk areas, flood insurance is cost-prohibitive for Canadians, if available at all, and especially so for low income households. In some areas, risk-based insurance premiums could reach $10,000-15,000 or more for flood endorsements alone, on top of other home insurance costs. High housing costs across the nation create an added barrier for homeowners to be able to afford residential flood insurance. Cost and availability of insurance can also be further impacted by recent flood events, because of material changes in risk, or due to increased costs of providing insurance/reinsurance, which can lead insurance companies to raise premiums or withdraw coverage.
Low risk awareness
Current flood maps or other sources of risk information are not generally available or easily accessible for homeowners across the country, and flood risk does not need to be disclosed to potential home buyers. Most Canadians in high risk areas are not aware of their flood risk. This creates three problems. First, when and where flood insurance is available, Canadians may not purchase it due to a lack of awareness of their level of flood risk, or they may erroneously assume flood risk is covered by standard home insurance. Second, homeowners who have purchased optional flood coverage may not have sufficient protection for the amount of risk they face. Unfortunately, it is often only after an event that homeowners discover they are underinsured, or uninsured for their losses. Third, low-risk awareness means homeowners are less likely to make investments in property-level protections for flooding, whether or not they have insurance.
94% of Canadians living in high-risk areas remain unaware of their flood risk.
Source: Partners for Action. (2020). Canadian Voices on Flood Risk.
Misaligned Incentives
The existing system of FPT taxpayer-funded DFA programs contributes to a moral hazard on multiple levels. At the homeowner level, DFA does not provide any incentive to reduce risk or to purchase insurance. At the community level, local governments approve land-use decisions that can maintain or create new flood risk, yet they, along with developers, are rewarded with increased property sale prices and tax revenues. Meanwhile, FPT levels of government bear up to 90% of the public costs to recover and rebuild when floods occur. At the regional and national levels, the cost-sharing of post-disaster funding does not incentivize stakeholders at different levels to reduce risk. FRM and risk reduction through a perverse incentive structure: the expectation that governments will provide effectively free post-disaster financial assistance regardless of risky development decisions reduces the incentive for communities and individuals to reduce their risk or to seek financial protection through insuranceFootnote 30 Footnote 31.
1.4 The Task Force on Flood Insurance and Relocation
In early 2018, the then Minister of Public Safety and Emergency Preparedness created an Advisory Council on Flooding with the purpose of advancing the national discussion on flood risk management. The Advisory Council formed a public-private sector Working Group on the Financial Management of Flood Risk, co-chaired by Public Safety Canada and the Insurance Bureau of Canada (IBC). In May 2018, FPT Ministers Responsible for Emergency Management requested that the Working Group draw upon international best practices to develop conceptual options for managing the financial costs of high-risk residential properties.
From 2018-2019, the Advisory Council made strong strides in exploring ideas for insurance in high-risk areas, including identifying key principles, conducting a thorough literature review and analysis, and outlining and evaluating possible options for application in Canada. Following this foundational exploration, further work was needed to provide governments with a costed version of the Advisory Council's work, and one that better analyzed and incorporated the needs of vulnerable Canadians.
In November 2020, upon direction from the Prime Minister, the Minister of Public Safety and Emergency Preparedness and the Minister of Families, Children and Social Development stood up the Flood Insurance and Relocation Task Force (the "Task Force") whose mandate was to explore solutions for low-cost flood insurance for residents of high-risk areas and consider strategic relocation in areas at the highest risk of recurrent flooding. The Task Force brought together experts from federal departments and agencies, provincial and territorial ministries, and representatives from the insurance industry, including IBC, to undertake this work.
The Task Force also prioritized engagement with Indigenous communities, with focused dialogues with First Nations off-reserve, Inuit, and Métis communities, organizations, and individuals. The results of this engagement is included in Section 4 of this report. In parallel to the work of the Task Force, Indigenous Services Canada (ISC) worked in partnership with the Assembly of First Nations (AFN) on a dedicated Steering Committee on First Nations Home Flood Insurance Needs to examine the unique context for on-reserve First Nations. The ISC-AFN work exists in a separate but concurrent track of work, the results of which will help to inform FPT decision-making processes. The Task Force and Steering Committee worked closely together to ensure alignment and coordination on these two streams of engagement.
Membership and Governance
The Task Force was composed of a diverse group of organizations, sectors and interests. Three task teams (Federal, Provincial/Territorial, and Industry) met regularly throughout to collaborate on the design, analysis, and results of the work. A Principals Committee of senior officials from each of the Task Teams provided guidance and stewardship of the Task Force, while Public Safety Canada provided the administrative, logistical, and analytical support through the Task Force Secretariat (Annex A).
Methodology
The Task Force's work involved several interconnected and concurrent work phases over eighteen months. It began with in-depth and wide-ranging policy research that included case study analyses, literature reviews, an evaluation of best practices both abroad and locally, social vulnerability analysis, consultation with academics, engagement with Indigenous communities, and well as collaboration with the insurance industry and FPT governments. At the same time, a data team at Public Safety sought to accurately calculate the extent of expected flood damages across Canada. To date, their work is one of the most robust flood hazard and risk data analyses ever completed for the country. Finally, the combined policy and data outputs became inputs for the actuarial analysis which quantified the costs and parameters of four different insurance models. The specific components of the above phases used to inform this report included:
Setting the Foundation
- FPT consensus of the Public Policy Objectives to frame the project and its outcomes.
- A lexicon of key terms for the work of the Task Force.
Policy Research
- A detailed literature review on international approaches to flood insurance.
- An evaluation of international flood insurance models and their applicability in Canada.
- A dedicated investigation on special considerations for Canada's North.
- An overview of options and international examples for affordability mechanisms.
- An analysis of best practices and case studies for strategic relocation in Canada.
- An analysis of behavioural economics insights into flood insurance and relocation.
- An FPT and Industry selection of the most promising flood insurance models for Canada.
Engagement
- Provinces/ territories to assess common ground and unique differences on flood risk management.
- Indigenous communities living off-reserve to understand their unique challenges and needs.
- The insurance industry to assess how a public-private partnership could make flood insurance available, and to help develop and shape proposed insurance models.
Analysis of Flood Hazard and Risk Data
- Consolidated Canada-wide flood hazard and flood damage estimates, by Public Safety Canada, to generate one of the most comprehensive geo-locatable national residential datasets used to date in Canadian public policy and natural disaster impact assessments.
Actuarial Analysis
- An actuarial analysis of potential flood insurance models that utilized the in-depth research from previous phases to help quantify costs of different stylized insurance arrangements, and examine the impact of relocation and risk reduction for those homes at the highest risk.
Statement of Fact Report
- Consolidating facts and findings into a cohesive report to support decision-makers.
Scope
Properties in scope for this report include residential structures that are privately owned, and for which no other form of insurance, like commercial or agricultural, applies. These include primary, secondary, vacation, multi-unit dwellings, condos, or rental properties to give an accurate picture of the total sum of residential flood risk and costs in Canada. Large multi-unit dwellings such as apartments or condos, are included in the flood hazard modelling. In these cases, however, it is noted that commercial insurance would likely be in place for the structure, and much of the flood risk remaining for homeowners in multi-unit dwellings would be related to contents. Finally, First Nations residences on-reserve are generally not included in this work due to data limitations and because of the parallel effort led by ISC and AFN focused on examining issues related to flood insurance for on-reserve First Nations.
The types of flood hazards in scope for this report include fluvial, pluvial, and coastal flooding. Other water-related hazards such as sewer back-up (when not related to overland flooding), burst pipes, ice damming on roofs, and tsunami risk are not included in the scope of this report.
Finally, the following federal initiatives, though all important factors for supporting flood insurance and relocation options, are outside the scope of this report because they are being advanced independently of, and in parallel with, this report:
- Federal commitment to complete all flood maps in Canada;
- Federal commitment to provide interest free loans to homeowners for climate change mitigation and adaptation improvements to their domicile;
- Promote flood risk awareness in Canada through a public-facing information portal;
- Specific measures to improve flood mitigation in communities at risk of recurrent flooding;
- Examination of flood risk and context-specific insurance options for First Nations on-reserve communities.
2. Flood Risk Management in Canada
Traditional approaches to managing flood risk involved governments building expensive structural controls that aimed to keep people and property separate from sources of floodingFootnote 32. With the rising costs and frequency of flooding, however, there is a global shift underway in learning how to live with water.
Flood risk management (FRM) is an alternative approach to conventional control measures that shares the responsibility for flood risk across a wider array of stakeholders and promotes the use of non-structural mitigation measures to complement and enhance other types of mitigation to reduce the risk and impact of flooding. In Canada, FRM spans all orders of government, industry sectors, communities, non-government organizations and individuals. FRM is by definition informed by risk, and involves an iterative process of acting, monitoring, reviewing and adapting.
Canada is a federation where each order of government has specific areas of jurisdiction, and roles and responsibilities may be exclusive or shared. How these differ, how revenue-based constraints (like taxation of incomes and consumption) may affect them, and how land use is planned and approved, are central to understanding what makes the landscape of FRM in Canada particularly complex.
2.1 Roles and Responsibilities for Flood Risk Management
Federal Government
The federal government's primary role in FRM is to coordinate with and support PTs and local efforts to mitigate, prepare for, respond to and recover from flood emergencies. This role stems principally from the Emergency Management Act (EMA), S.C. 2007, c. 15. Under the EMA, the Minister of Public Safety and Emergency Preparedness is responsible for exercising leadership related to emergency management in Canada by coordinating among government institutions and in cooperation with PTs and other entities. The EMA also provides the Minister with responsibilities for monitoring emergencies, coordinating the Government of Canada's response, and providing resources or financial assistance to PTs under certain conditions. Financial assistance to PTs is largely provided through Public Safety Canada's Disaster Financial Assistance ArrangementsFootnote 33 (DFAA) program, which currently funds a significant share of the costs for flooding in high risk areas. Under the EMA, the Minister is also responsible for exercising leadership at the national level relating to emergency management, which is central to the role of working with all stakeholders to address the rising costs of disasters and the increased risk of catastrophic events faced by Canadians. Other federal ministers also have emergency management responsibilities within the EMA as it pertains to their respective area of responsibility, for which they are accountable to Parliament.
Two other pieces of legislation are relevant to FRM. First, under the Department of Indigenous Services Act, S.C. 2019, c. 29, the Minister of Indigenous Services is responsible for providing emergency management services to, and assisting with disaster recovery for, Indigenous individuals, and Indigenous governing bodies, in partnership with PT governments and third-party service providers such as the Canadian Red Cross. Second, under the Canada Water Act R.S.C. 1985, c. C-11, the Minister of the Environment works with relevant PTs in matters relating to water resources. Joint projects involve the regulation, apportionment, monitoring or surveying of water resources. Under partnerships with PTs, the federal government is responsible for providing critical hydrometric data, information, and knowledge that Canadians and their institutions need to make informed water management decisions to protect and provide stewardship of fresh water in CanadaFootnote 34.
The Disaster Financial Assistance Arrangements (DFAA)
Established in 1970, the DFAA is a federal cost-sharing program to assist PTs with response and recovery costs for large-scale disasters. The DFAA reimburses PTs for eligible disaster costs related to the provision and restoration of essential services and the repair of damaged infrastructure. PTs are responsible for designing and administering disaster financial assistance (DFA) programs in their jurisdictions to provide direct assistance to individuals, small businesses, not-for-profits, and local governments. Most PT programs generally align with DFAA eligibility criteria to maximize federal reimbursement, however, there is considerable variance across Canada in the coverage provided, and the relative maturity and capacity of DFA programs.
Since the inception of the DFAA, the Government of Canada has paid in excess of $6 billion in post-disaster funding to PTs, and over 62% of that has been paid out in the last 10 years. The recent atmospheric river events in BC are likely to add approximately $5B in future payments, and costs are expected to continue to rise significantly in future years.
Effective FRM also engages a number of other federal departments, including: Transport, Natural Resources, National Defense, Infrastructure, Heritage, Fisheries and Oceans, and Foreign Affairs. Nationally, the Government of Canada monitors and shares information about some of the contributors to flood risk, such as weather forecasts, climate models, and sea levels. Data and technical guidance helps support PTs in developing regional or local flood maps and flood forecasts, and citizens can access generalized information on preparing for floodsFootnote 35. There remains a large gap, however, with respect to publicly available, up to date, and comprehensive flood risk information for Canadians. There is a shared commitment to address this gap through PT and local flood mapping efforts, supported in part by over $60 million in federal funding announced in the 2021 Federal Budget, as well as a federal commitment to develop a public flood risk portal, which together would help to increase risk awareness, transparency, and preparationFootnote 36.
In terms of insurance, some insurers are incorporated under federal legislation, which allows them to carry on the business of insurance throughout Canada, while others may choose to incorporate only in the specific jurisdictions they wish to operate. Regardless of where insurers choose to incorporate, business activities of these companies are generally regulated by the provinces.
Provincial and Territorial Government
PT governments play a central role for FFRM in Canada through their regulations and policies in matter of land use, their jurisdiction and oversight over municipalities, and their roles as regulators on the business activities of the insurance sector, including product design. PT governments have historically taken different approaches to FRM within their jurisdictions, including varying degrees of delegation to municipalities. PTs may establish land use planning standards to mitigate flood risks, and some have undertaken significant infrastructure investments in flood protection (Manitoba's Red River Floodway, and Alberta's recent investment in the Springbank Off-Stream Reservoir near Calgary). Furthermore, PTs may impose requirements in matters of the design, construction, and maintenance parameters for buildings and other infrastructure built in risk area whereby they can choose to adopt, as is, or modify the National Building Code of Canada Footnote 37 Footnote 38. Their authority over land use includes regulating and permitting natural resource development such as mining or logging and the responsibility to develop flood maps for their jurisdictions. Some PTs may also have other governmental entities responsible to enforce and implement construction-related legislation on their behalf. La Régie du bâtiment du Québec, for example, enforces the Building Act, Construction Code and Safety Code, to ensure quality construction and renovation work, and issue or modify related permits.
In addition to legislation that delegates specific authorities to local governments, some PTs have legislation specific to emergency management and the responsibilities of municipalities to prepare for, respond to, and recover from emergencies, including flood events. PTs are responsible for coordinating the response to emergencies within their borders, but some often work closely with neighbouring jurisdictions both in Canada and the United States, and can request federal assistance and resources when required.
When individuals and organizations experience losses due to major flood events, PT governments may provide DFA through a formalized program, or through ad-hoc funding mechanisms to facilitate reconstruction. Some provinces, like Quebec, do not authorize reconstruction in the same location if it is in a high-risk flooding zone and the property meets certain risk-based criteria. In some instances, PTs have opted to purchase and demolish damaged residences to enable homeowners to relocate to a less risk area. Currently, DFA programs often exclude coverage for insurable losses, however, determining what qualifies as insurable can be a complex endeavour given the high costs and limited ability to purchase flood insurance in some areas. At this time, therefore, many PTs recognize the need to maintain some flexibility in their DFA programs and apply discretion when determining if residential flood insurance is reasonably and readily available.
Municipal Government
Under Canada's Emergency Management Framework, municipalities have a role in leading local response and recovery, however, they are also highly dependent on other levels of government for resources and funding when significant events occur. Municipalities are responsible to enforce their by-laws and may be subject to PT legislation in matters of land use or construction. At times, municipalities may be limited in matters of zoning by-laws, development, and permits by PT environment or agricultural oversight bodies, however, municipalities also have the ability to require local standards to be higher than PT minimums. In terms of FRM, municipalities can reduce flood impacts by working with PTs to identify flood risks in their jurisdictions, investing in structural and non-structural mitigation and by implementing economic incentive programs such as subsidies, rebates, or risk-based surchargesFootnote 39. These efforts often require support from and collaboration with multiple levels of government. Local governments are often on the frontlines of FRM in Canada, which they manage through limited fiscal capacity constrained by revenue sources available to them and their dependence on property taxes to fund programs and services. This can put municipal governments into a challenging role. Although they have the responsibility to comply with PT land use planning regulations and policies, they also have a vested interest in maximizing property taxation revenue to fund programs and services for residents, including for disaster response. Without broader cross-jurisdictional support, however, these two competing interests can be at opposite ends of the FRM incentive spectrum, further complicating risk reduction efforts.
Indigenous Communities
For generations, Indigenous communities of First Nations, Inuit and Métis peoples have turned to traditional knowledge to foster a holistic approach to disaster risk reduction. The ongoing challenges stemming from colonial history that resulted in loss of lands, language, and culture, however, has disproportionally compounded the impact of flooding for Indigenous peoples, and created added challenges for FRM. Although it is understood that all communities have a responsibility to prepare for disasters and contribute to community resiliency, the jurisdictional complexity that northern, urban, and rural Indigenous peoples have to navigate in order to access support creates an added burden. Further, unique geographies, socio-cultural characteristics, sometimes limited access and proximity to resources, and higher flood risk in many northern and remote communities warrant special considerations for FRM for Indigenous peoples.
Emergency and FRM are a shared responsibility, handled through partnerships between Indigenous communities and their governments, federal, PT governments, and non-governmental organizations. Indigenous communities are responsible for developing community emergency management plans that include assessments of hazards, risks, and vulnerabilities faced by the community, and ensuring plans are exercised and maintained.
Federally, Indigenous Services Canada (ISC) works closely with First Nations and partners to bolster emergency preparedness and administer the Emergency Management Assistance Program (EMAP) as the primary source of federal funding to reimburse on-reserve emergency management activities, including flood mitigation, preparedness, response, and recovery. In addition, ISC works with First Nations to support structural mitigation projects, such as dikes, sea walls, erosion-control measures, that protect First Nations communities from increased climate-related hazards. Crown-Indigenous Relations and Northern Affairs Canada (CIRNAC) provides funding to help these communities assess and respond to climate change impacts on community infrastructure and disaster risk reduction through the First Nation Adapt Program. Furthermore, it is important to note that federal government has legal a Duty to Consult when it is contemplating any conduct or action that might adversely impact potential or established Aboriginal or Treaty rightsFootnote 40.
The recurring number of emergencies, the vulnerability of many First Nations communities to emergencies, and extensive recovery time continue to pose problems for Indigenous communities. Moreover, challenges exist in accessing flood insurance, due not only to a lack of availability and affordability, but also because efforts do not always align with Indigenous cultures, land use practices, ownership structures, ways of knowing, and worldviews (see Section 3).
Insurance Industry
Water-related claims are today's primary cause of home insurance losses in Canada and are expected to continue increasingFootnote 41. The primary role of the insurance industry for FRM in Canada is the financial transfer of flood risk from homeowners to insurers through the provision of flood insurance, often added either as part of a bundled peril endorsement or specific to a single peril. Some insurers offer varying degrees of overland flood endorsements (fluvial and pluvial risk), while coastal storm surge coverage remains limited. Most insurers provide endorsements for sewer backup, and while this is outside of scope of this report, there can be complexities in distinguishing sources of and responsibility for costs when sewer backup occurs concurrently with or is caused by overland flooding. The industry also regularly participates in data collection, research and public outreach initiativesFootnote 42. Flood insurance can incentivize policy holders to undertake risk reduction measures to lower their premiums, and with high enough take-ups rates, it can help to shift some of the financial flood risk burden away from FPT government DFA programs. In addition, when the appropriate level of flood insurance is purchased, policies can generally compensate consumers more fully and more quickly than government programs.
Although historically in Canada residential insurance policies did not offer coverage for damage or losses caused by overland flooding, the industry took steps to expand insurance policies following the significant flood events of 2013 (Alberta and Toronto). Since that time, and the insurance industry has remained highly involved with FPT governments and other stakeholders to help address issues of flood resilience.
Necessary Preconditions for Success of a Private Insurance Market
Before the introduction of overland flooding coverage in 2015, insurers articulated four necessary preconditions for success of a private insurance market (those conditions are also vital to the success of a high-risk flood insurance solution): accurate and up-to-date flood mapping across Canada; adequate and ongoing investments in public and private flood defences; improved public awareness of flood risk; and limited or restructured post-disaster financial assistance to encourage flood mitigation investments. Federal support for the proposed conditions have been partly addressed through the National Disaster Mitigation Program, which began in 2015; however, continued support is required.
Non-Governmental and Civil Society Organizations
Canada benefits from many non-governmental and civil society organizations that play an important role to provide services across all pillars of emergency management for FRM. The Canadian Red Cross and organizations like it, for example, support flood recovery efforts, emergency planning, and public education to communities and individuals. Furthermore, these organizations can be some of the first boots on the ground during incidents. They are also often best suited to attract, coordinate and harness emergent groups of volunteers towards meaningful contributions to all phases of a disaster.
Communities and Individuals
Flood hazards pose significant risks to thousands of Canadians from coast to coast to coast. It is Canadians to whom flooding happens. It is they who experience the emotional, physical and financial hardships that stem from loss of security, property, place, and community. Homeowners are also responsible for covering losses that are not insured or covered by DFA.
When communities and individuals are more aware of flood risk, they are better equipped to take active roles in reducing the negative consequences of flooding. At the onset, homeowners can seek out information that will help them understand their property's flood risk. That knowledge then becomes the impetus to undertake non-structural and structural risk mitigation efforts such as: purchasing adequate flood insurance and implementing residential flood-proofing measures. The cumulative effect of homeowners taking action in flood-prone areas contributes to their community's overall resiliency.
Public expectations of government assistance following a flood are widespread across Canada. Canadians expect that their governments will support them to recover from a disaster, although expectations for support may differ across regions, such as in urban or rural areas, and based on the type and severity of flooding.
More generally, as taxpayers and contributors to the FPT coffers that provide DFA, all citizens have a vested interest in effective and efficient FRM, and are recognized as having a role to play in emergency managementFootnote 43. Yet some communities and individuals may have either limited risk awareness of potential losses from flooding, limited capacity to mitigate that risk, or both. It is essential to acknowledge the different needs, resources, capacities and vulnerabilities of individuals and communities that can intersect to exacerbate risks or strengthen resilience.
Communities and individuals have an opportunity to educate themselves about local flood risks when possible. Citizens, for example, can access generalized information on flood risk from local, PT, federal, non-profit, and private sector sources. Through increased individual awareness and involvement, FRM in Canada continues to evolve and remain on the agendas of elected officials.
2.2 Impact of Risk Reduction
Within FRM, the concept of and need for risk reduction applies across all of society. To reduce flood risk, efforts need to decrease the exposure and/or the vulnerability to flood hazards. The types of risk reduction, the different levels of application, and their relative effectiveness to mitigate risk, are important considerations within whole-of-society FRM.
At the level of household defences, the most impactful risk reduction measures for smaller-scale events can often be implemented for less than a $250 investment, such as installing a backwater valve, having a basement sump pump, maintaining appropriate lot grading, clearing eaves troughs and extending downspoutsFootnote 44. In addition, research has shown that adopting National Guidelines for the Flood Resilience of Buildings can have a 11:1 benefit to cost ratio for people's homesFootnote 45.
Community flood mitigation efforts have the potential to greatly reduce flood risk on a larger scale. For example, risk reduction strategies by local/regional governments could include adopting climate-resilient best practices for regulations, land use, urban planning, and developments; proactively upgrading or retrofitting infrastructure; and investing in natural infrastructureFootnote 46. Structural and non-structural mitigation at the community level have been shown to have a 6:1 return on investmentFootnote 47. Investments at this level can also have impacts on insurance pricing if premiums are linked to actual risk, including accounting for mitigations undertaken.
In the United States, the Community Rating System (CRS) is a voluntary incentive program that recognizes and encourages flood risk management, and provides premium discounts under the National Flood Insurance Program (NFIP). Over 1,500 communities participate nationwide.
National support for risk reduction can include up-to-date national climate and disaster resilient building codes and standards, improved flood risk information, strategic leadership for climate-resilient investments, and funding for watershed level mitigation projects. Research in the United States has shown a 7:1 return on investment for federal investment in mitigation over the past few decadesFootnote 48.
Of all the different elements of residential flood risk reduction, one tool offers an opportunity to eliminate some existing risk entirely. By removing homes at the highest risk of repetitive flood damage and moving people out of harm's way, strategic relocation effectively eliminates the element of exposure, and can be an extremely impactful tool for managing flood risk. The application of property buyouts, however, is extremely challenging, delicate, time-consuming, and expensive, coupled with the reality that there is also currently a shortage of suitable and affordable housing in Canada.
Strategic Relocation
This approach is a means to effectively eliminate the risk of flooding within a given area by removing exposed property and assets at highest risk of repetitive flood damage. It is typically accomplished through property buyouts, where extremely risky properties are purchased by the government and structures are removed to restore the area to an undeveloped state. The acquired land can then be repurposed as green infrastructure, enhancing capacity for the retention of floodwater, and further serving to reduce flood risk.
Over the past decade, municipal, provincial, and territorial governments in Canada have increasingly pursued strategic relocation; however, property buyout programs have primarily been ad hoc, developed in the aftermath of a disaster. This reactive response has created considerable variability in how these programs have been designed, delivered, and funded, and there remains an opportunity for strategic relocation to be employed proactively for disaster risk reduction and not just as a disaster recovery tool. A summary of recommendations for the design of effective property buyout programs, developed through a study of past Canadian programs, is provided as Annex B.
3. Flood Hazard and Damages in Canada
A foundational step to enable the Task Force's analysis was to build an accurate estimate for the total cost of residential flooding in Canada. This was a complex undertaking that required a number of data-intensive steps, leveraging external flood hazard and flood risk expertise, and procuring several different flood hazard models and related data sets. This work was completed by a technical team at Public Safety Canada, and a detailed methodology of the work can be found in Annex C of this report. All estimates are based on data sets current up to 2020 and are based in 2020 dollars.
3.1 Methodology for Estimating Flood Damages
In order to estimate the magnitude of financial flood risk to residential addresses in Canada, a number of inputs are required: flood hazard, which is often described as the size of a flood extent, a magnitude such as a water depth or flow velocity, and a probability of occurrence; the exposure, which refers to the people, property, infrastructure and other social or economic assets which may become affected by flood hazard; and the consequence, or how much damage floodwater is likely to cause to particular exposed people or assets. With these three pieces, it is possible to estimate financial risk, and the predicted losses, faced by people, properties and infrastructure. Figure 1 outlines the conceptual methodology used to estimate financial flood risk across Canada in terms of predicted damages to residences.
Flood Hazard |
Exposure |
Consequence |
Risk |
|---|---|---|---|
Estimated using JBA Risk Management, KatRisk and Aon Impact Forecasting flood models, each evaluated against local high-resolution flood hazard mapping. |
Developed by PS using DMTI Spatial ULC/LightBox CanMap Address Points, 2020, Opta Information Intelligence building characteristics, and information from other building location data |
Estimated using data from JBA Risk Management, KatRisk, Aon Impact Forecasting, and Fathom flood damage estimation techniques and PS estimations |
Estimates of average annual loss (AAL) from flooding as well as return-period level losses for residential properties in Canada |
Estimating Flood Hazard
There are two general sources of flood hazard information for Canada: targeted, local-scale engineered regulatory flood mapping, often produced at the PT or local level for regulatory purposes; and mapping created by broad-coverage flood modeling, which is often produced by private companies primarily to support the insurance industry. Although regulatory flood mapping is considered the most accurate estimation of flooding when it occurs, broad-coverage modelling has three critical advantages for completing Canada-wide assessments of flood hazard: it provides consistent and comprehensive coverage across the country, it provides flood depths at multiple standardized return periods (e.g., 1-in-100 year, 1-in-200 year, etc.), and it often captures different flood mechanisms such as fluvial, pluvial and coastal flooding. Without using broader flood modeling data, there would only be flood hazard information in select areas where flood studies have been conducted, with limited or no flood information elsewhere.
As such, broad-coverage flood models were procured from firms that provide modelling and mapping products to the Canadian (and global) insurance markets. Prior to their use in the flood hazard estimation procedure, the models were evaluated against local high-resolution engineered mapping in order to understand how well these models align with the higher-resolution mapping on the ground. Although model performance metrics differed between vendors and across individual locations, overall model performance was deemed suitable in predicting flood-impacted regions when evaluated against high-resolution engineered mapping. Each model performed well in specific areas and the added value of flood hazard estimation from each model was considered important for providing a comprehensive and more robust assessment of flood hazard across Canada. The overall model performance was deemed acceptable for the objective of the analysis.
Estimating Flood Exposure
One of the major challenges in estimating the costs of flooding nationally is establishing a comprehensive database of residential properties. In order to develop this database, a variety of different building and address datasets were procured, compiled, and evaluated for completeness and quality. This information was then combined with building attribute data to understand factors such as structure replacement cost, presence of a basement, and other relevant information which informs value at risk and susceptibility to flooding. Overall, developing this comprehensive, high quality exposure dataset for residential addresses was a complex endeavor involving several quality control steps. Though the housing landscape is dynamic, this database is one of the most comprehensive geo-locatable national residential datasets used to date in Canadian public policy and natural disaster impact assessments. The resolution of this data set was at the dissemination block level (generally 20 to 30 properties), and was disaggregated to individual households prior to the consequence estimation step.
Estimating Consequence (Flood Damages)
In addition to the flood hazard data and exposure datasets, the third required component involved relating flood depths in the models to estimated flood losses of residential properties. Generally, this is performed by applying 'depth-damage functions', which are relationships between flood depths and expected damage to residential structures and contents. Using high-resolution building replacement data, dollar values of flood damages are then calculated. These outputs are used primarily by the insurance industry to predict the amount of expected losses resulting from flooding.
Average annual loss (AAL) is the cost of flood damage that is expected to occur each year, averaged over the long term. It should be noted that the average hides the fact that losses may be very small most of the time, but have the potential to become catastrophic for major events.
Using a variety of sources for these depth-damage functions, it was possible to create six unique estimates of average annual loss (AAL) expected from flooding per residential address across Canada, with two estimates of average annual loss in the northern portions of Canada. These estimates include structure and contents losses, but not additional living expenses. This multi-estimate approach helps to account for uncertainty and model differences, giving a more robust understanding of flood risk. A visual example of address points, with the area relative AAL, is provided in Figure 2.
Figure 2: Satellite overview showing average annual loss estimates at each residential address point

Image description
Satellite overview showing average annual loss estimates at each residential address point (CanMap Address Points, 2020 – DMTI Spatial ULC/LightBox) from fluvial, pluvial and storm surge flood mechanisms, and the relationship to one of the flood hazard models at the fluvial 500-year return period (KatRisk, 2021). A to E reflects increasing amounts of estimated average annual loss. Other map data: Google, Imagery ©2022 CNES / Airbus, Landsat / Copernicus, Maxar Technologies, S. Alberta MD's and Counties
A visual example of address points shown on a satellite image of neighbourhoods beside a river. Address points are shown as small circles with different colours for different levels of average annual loss, and higher loss address points are generally closest to the river.
3.2 Results of Flood Damage in Canada
The results of the flood damage assessment are presented as estimates of AAL for residential properties throughout Canada based on the best available data. The mean of the six different damage estimates was used at each location to combine the intelligence from numerous flood damage models. These results are considered more robust than having a single damage calculation and constitute reasonable estimates of residential flood losses in Canada. Some advantages of this analysis include the involvement of three different operational flood hazard models currently in use by the Canadian insurance industry, the use of the highest quality residential address database currently possible using several different input datasets, as well as the implementation of four different operational flood damage estimation methodologies. Although flood hazard modelling and flood damage estimation are processes that are prone to uncertainty, the methodology used for this analysis was designed to attenuate as much of this uncertainty as possible. The results of the flood damage estimation were used as inputs for the subsequent actuarial analysis.
A summary of provincial and territorial AAL results is shown in Table 1 and Figures 3 to 5.
Overall |
Top 10% of Risk AAL > $262 |
Top 1% of Risk AAL > $4,150 |
|||||
|---|---|---|---|---|---|---|---|
Province / Territory |
Total AAL |
Residential Properties |
AAL Per Property |
Residential Properties |
Percent of Properties |
Residential Properties |
Percent of Properties |
Alberta |
$245.5 M |
1,855.0 K |
$132 |
145,118 |
7.82 |
11,608 |
0.63 |
British Columbia |
$689.4 M |
1,971.0 K |
$350 |
278,617 |
14.14 |
48,399 |
2.46 |
Manitoba |
$105.3 M |
457.8 K |
$230 |
68,079 |
14.87 |
2,619 |
0.57 |
New Brunswick |
$103.7 M |
344.6 K |
$301 |
48,951 |
14.21 |
6,867 |
1.99 |
Newfoundland and Labrador |
$11.9 M |
167.3 K |
$71 |
8,478 |
5.07 |
256 |
0.15 |
Nova Scotia |
$68.6 M |
485.9 K |
$141 |
52,470 |
10.8 |
2,151 |
0.44 |
Northwest Territories |
$0.6 M |
9.4 K |
$65 |
502 |
5.35 |
24 |
0.26 |
Nunavut |
$0.2 M |
3.6 K |
$44 |
50 |
1.39 |
13 |
0.36 |
Ontario |
$805.1 M |
5,836.0 K |
$138 |
407,754 |
6.99 |
40,973 |
0.7 |
Prince Edward Island |
$9.8 M |
74.0 K |
$133 |
7,483 |
10.11 |
191 |
0.26 |
Quebec |
$861.3 M |
3,766.0 K |
$229 |
489,605 |
13 |
38,432 |
1.02 |
Saskatchewan |
$54.4 M |
426.4 K |
$128 |
30,913 |
7.25 |
1,519 |
0.36 |
Yukon |
$13.0 M |
14.1 K |
$925 |
3,107 |
22.07 |
1,061 |
7.54 |
Total AAL |
$2.97 B |
||||||
The AAL informs what the expected costs of flooding may be on average each year and is a common way of reflecting the financial flood risk to residential properties. Overall, the estimated average cost of residential flooding in Canada is $2.97 billion annually, with costs varying by province and territory. Quebec, Ontario and British Columbia have the highest individual loss estimates, which is, in part, related to a larger population count and, therefore, a larger total number of exposed properties. Flood loss estimates appear comparatively low in the Northwest Territories and Nunavut, part of which may be due to greater uncertainty in residential address data and a lower number of residential properties.
Figure 3: Percentage of residential properties and average annual loss per province and territory across Canada

Image description
- The proportion of residences and average annual loss, as percentages of the national total, is shown for each province and territory using side-by-side bar graphs. This allows for a comparison of the total expected flood loss in each province and territory relative to their share of residences nationally.
- The proportions of average annual loss and number of residences is generally similar for each province and territory, with some distinctions. Some provinces have a greater share of average annual loss from flooding compared to their share of the total number of homes (QC, BC, MB, NB, YK). Other provinces have lower average annual loss, relative to their share of total number of residences (ON, AB, NS, SK, NL, PEI, NWT and NU).
- The difference between the percentage of residences and average annual loss varies by province, with some of the higher differences detected in provinces with a large number of residential addresses. For example, Ontario has 37.9% of residences but has 27.1% of average annual loss. British Columbia has 12.8% of residences but has 23.2% of national average annual loss.
- Other discrepancies between proportion of residences and average annual loss occur in provinces and territories with fewer residential addresses, including the Northwest Territories, Nunavut and Yukon.
Percentage per province and territory across Canada |
||
|---|---|---|
Province/Territory |
Residential properties |
Average annual loss |
Ontario |
37.87% |
27.12% |
Quebec |
24.44% |
29.01% |
British Columbia |
12.79% |
23.22% |
Alberta |
12.04% |
8.27% |
Nova Scotia |
3.15% |
2.31% |
Manitoba |
2.97% |
3.55% |
Saskatchewan |
2.77% |
1.83% |
New Brunswick |
2.24% |
3.49% |
Newfoundland and Labrador |
1.09% |
0.40% |
Prince Edward Island |
0.48% |
0.33% |
Yukon |
0.09% |
0.44% |
Northwest Territories |
0.06% |
0.02% |
Nunavut |
0.02% |
0.01% |
When examining the overall portfolio of residential properties in Canada, it can be useful to analyze the distribution of higher risk properties through measures like AAL. For example, across Canada the highest 10% of AALs are those which are estimated to be equal to or greater than roughly $262, meaning the expected flood losses for those properties per year is $262 or greater, on average. The number of properties with AALs in the top 10% of national risk differ by province, with Quebec, Ontario and British Columbia having the highest number of properties in this category overall. Within PTs, Yukon has the highest percentage of its residential properties with AALs in the top 10% by national standards at roughly 22% of residential properties. British Columbia, Manitoba, New Brunswick and Quebec all have 13-15% of residential properties in the highest 10% of AALs by national standards.
Figure 4: Distribution of the top 10% of residential property AALs by PT and the proportion of each PT's residential properties which are in the top 10% of national AAL.

Image description
- Bar graph illustrating the total number of residences that are within the highest 10% of average annual loss, and the percentage of the national total of residences that are within the highest 10% of average annual loss for each province and territory.
- Some provinces and territories have more than 10% of the residences with average annual loss higher than the national 10% average annual loss value, meaning that these provinces and territories have a higher proportion of properties exceeding this threshold. This includes QC, BC, MB, NS, NB, PEI, and YT. Of these, QC, BC, MB, and NB all have 13-15% of their residences within the highest 10% of average annual loss. Particularly striking is the Yukon, with 22.1% of residences above the 10% average annual loss threshold.
- Other provinces and territories have fewer residences within the 10% average annual loss threshold: ON, AB, SK, NL, NWT, and NU.
- Provinces and territories with low populations, including NWT and NU, also have a low corresponding number of residences within the 10% average annual loss threshold.
Province/Territory |
Number of addresses at highest 10% of average annual loss |
Percentage of addresses at highest 10% of average annual loss |
|---|---|---|
Quebec |
489,605 |
13.00% |
Ontario |
407,754 |
6.99% |
British Columbia |
278,617 |
14.14% |
Alberta |
145,118 |
7.82% |
Manitoba |
68,079 |
14.87% |
Nova Scotia |
52,470 |
10.80 |
New Brunswick |
48,951 |
14.21% |
Saskatchewan |
30,913 |
7.25% |
Newfoundland and Labrador |
8,478 |
5.07% |
Prince Edward Island |
7,483 |
10.11% |
Yukon |
3,107 |
22.07% |
Northwest Territories |
502 |
5.35% |
Nunavut |
50 |
1.39% |
National Average |
10.23% |
At an even higher risk, the top 1% of AALs – which are AALs greater than or equal to $4,150 – are also unevenly distributed across properties by PT. Yukon has the highest percentage of residential properties in the top 1% of AALs at roughly 7.5%, while the remainder of the provinces and territories have between 0.1% and 2.5% of residential properties in this category. It is important to note that the Canadian territories had two damage estimates rather than the six damage estimates found elsewhere across Canada, due to flood vendor coverage limitations. Regardless, differences by province and territory are apparent for the high-risk properties, by measure of AAL.
Figure 5: Distribution of the top 1% of residential property AALs by province and territory and the proportion of each provinces residential properties which are in the top 1% of national AAL.
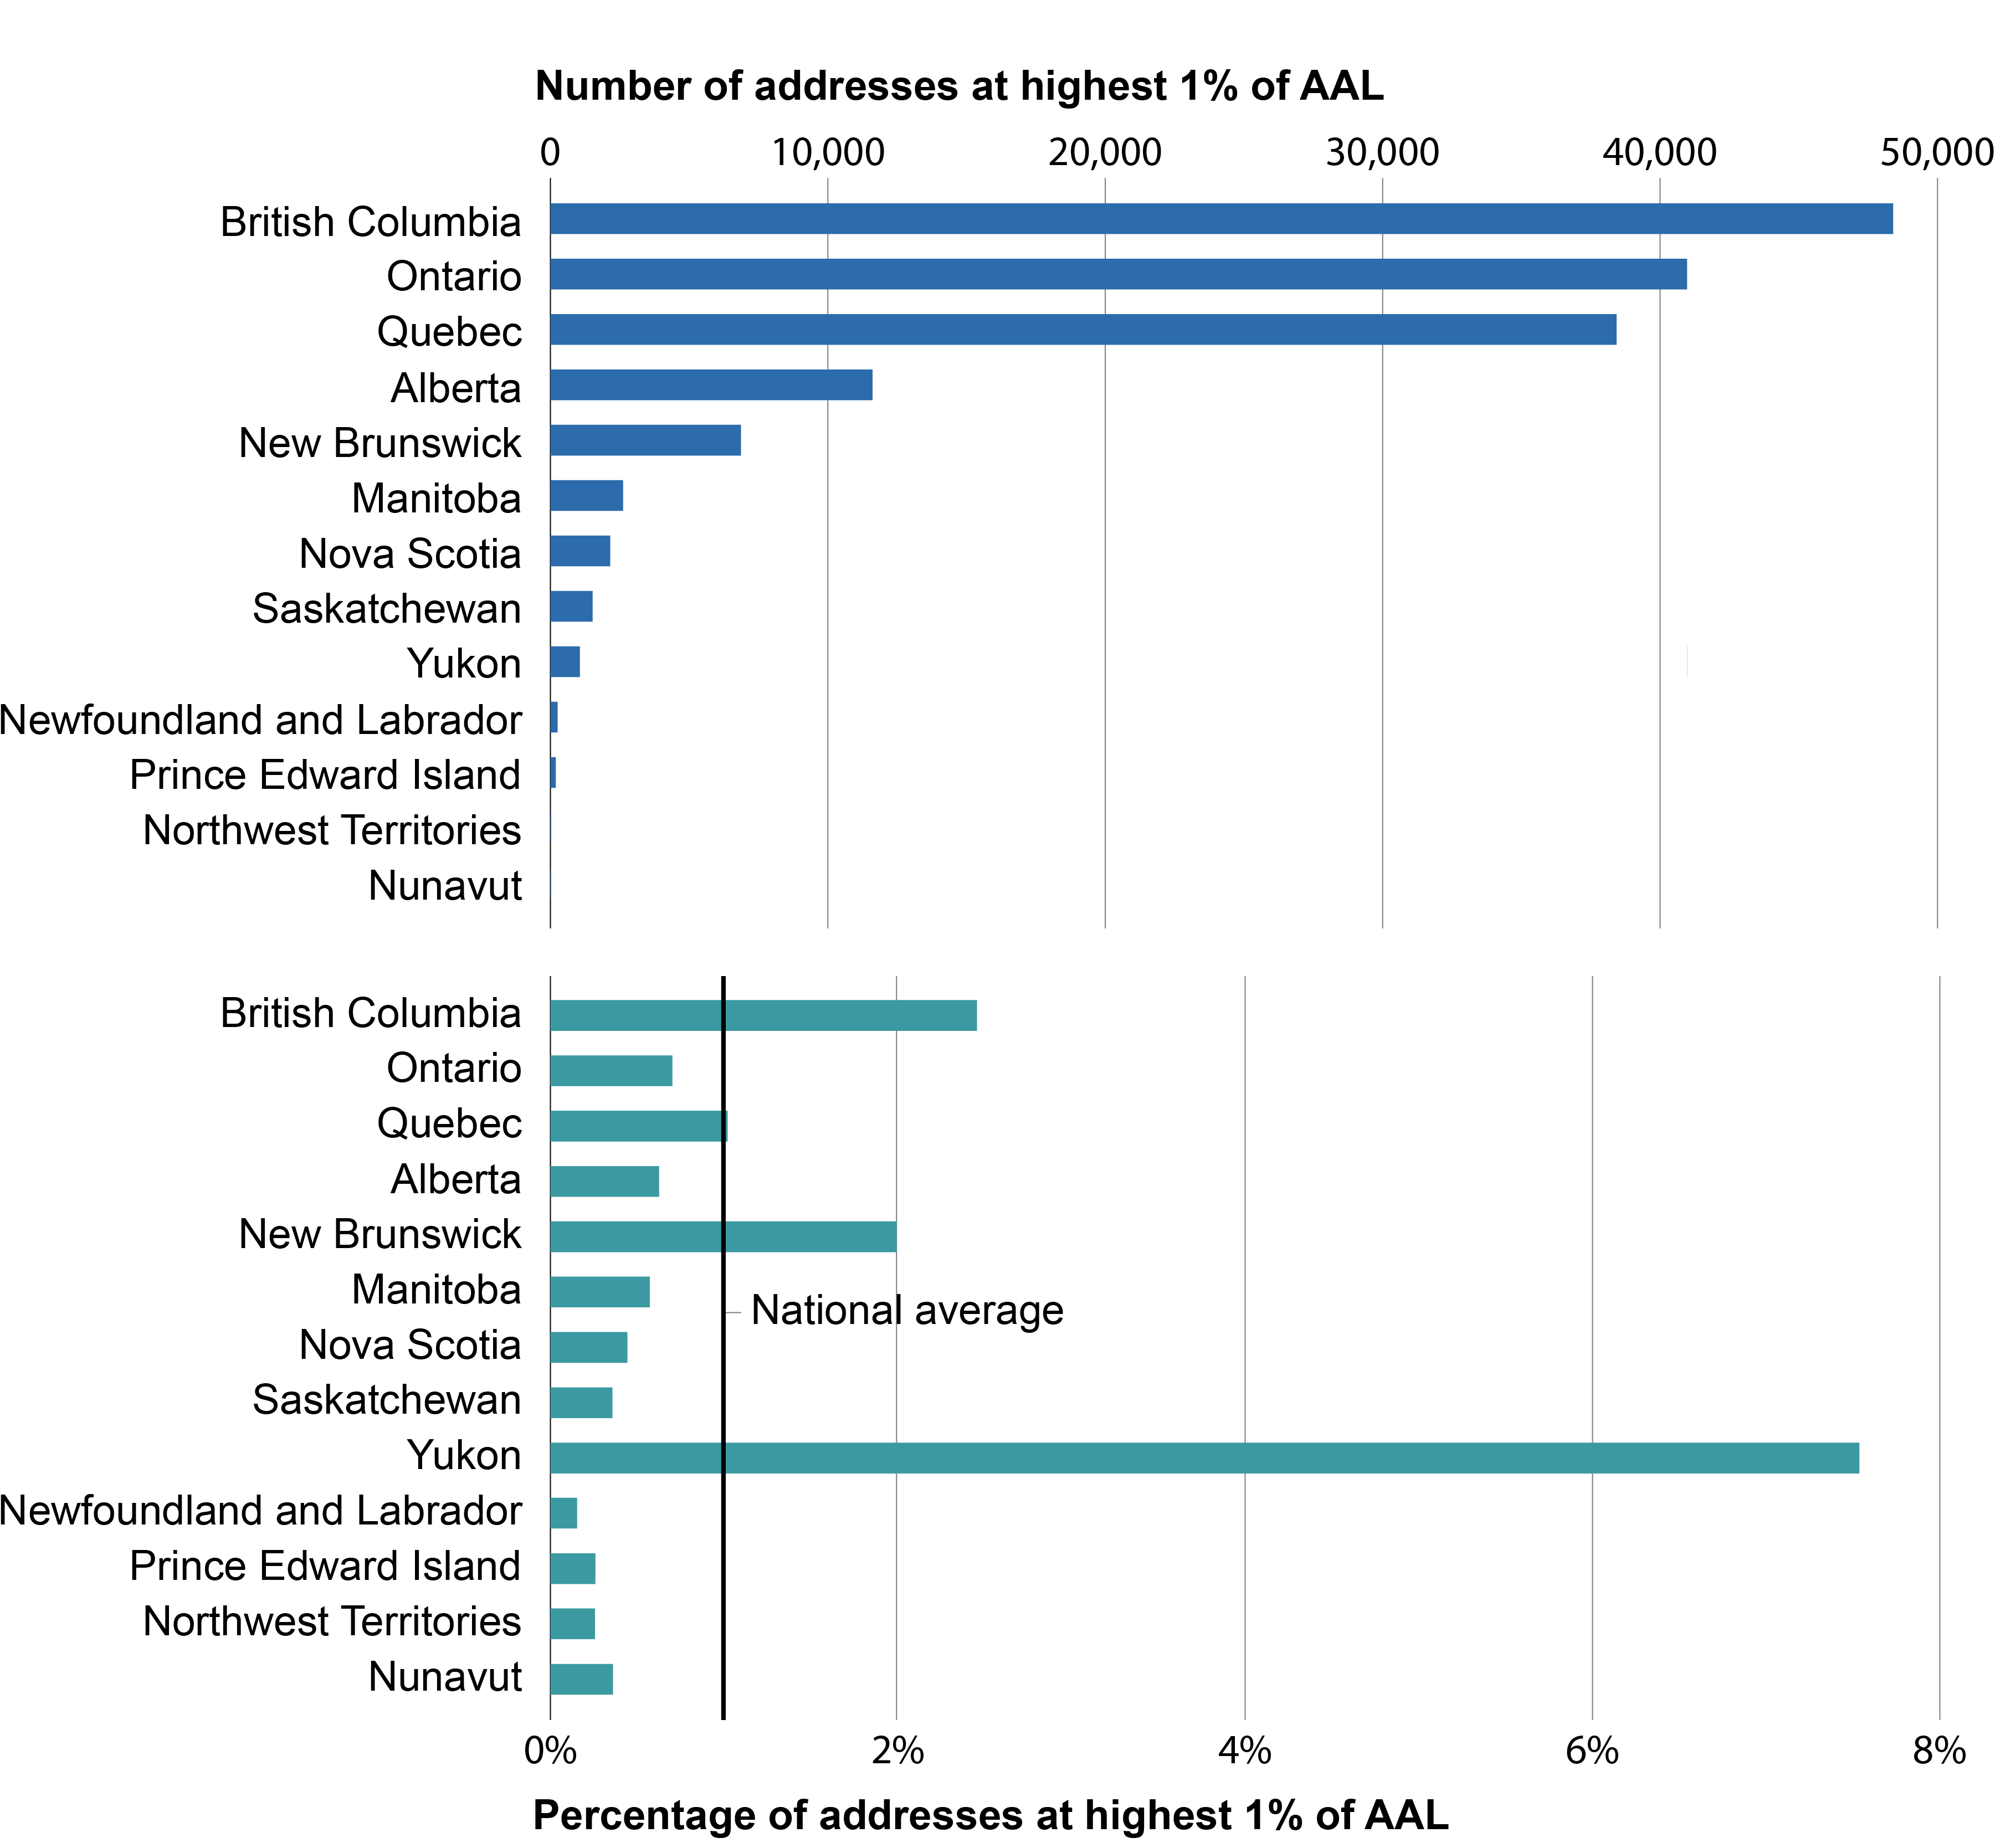
Image description
- Bar graph illustrating the total number of residences that are within the highest 1% of average annual loss, and the percentage of the national total of residences that are within the highest 1% of average annual loss for each province and territory.
- Some provinces and territories have more than 1% of their homes with average annual loss higher than 1%, meaning that these provinces and territories have a higher proportion of properties exceeding this threshold. This includes BC, NB and YT. Of these, YT has the highest proportion of homes above the 1% average annual loss threshold, with 7.5% of residences in this category.
- QC has about 1% of homes within the 1% average annual loss threshold, and all other provinces and territories have a lower proportion than this 1% average annual loss threshold.
Province/Territory |
Number of addresses at highest 1% of average annual loss |
Percentage of addresses at highest 1% of average annual loss |
|---|---|---|
British Columbia |
48,399 |
2.46% |
Ontario |
40,973 |
0.70% |
Quebec |
38,432 |
1.02% |
Alberta |
11,608 |
0.63% |
New Brunswick |
6,867 |
1.99% |
Manitoba |
2,619 |
0.57% |
Nova Scotia |
2,151 |
0.44% |
Saskatchewan |
1,519 |
0.36% |
Yukon |
1,061 |
7.54% |
Newfoundland and Labrador |
256 |
0.15% |
Prince Edward Island |
191 |
0.26% |
Northwest Territories |
24 |
0.26% |
Nunavut |
13 |
0.36% |
National Average |
1.29% |
When looking at the individual address AAL estimates, there is considerable variability and asymmetry across Canada. Figure 6 provides the relative contributions of each AAL percentile at the address level related to the overall $2.97 billion estimate. The sum of each decile of loss data is provided at the top of the graph to indicate the relative contribution of each tenth of the loss estimates. The top 10% of riskiest residences by measure of AAL, for example, contribute $2.65 billion (roughly 89.3%) of the overall $2.97 billion national estimate. Furthermore, the top 1% of residential average annual losses account for roughly 34.1% of the national total loss estimates. A considerable number of properties are expected to have negligible amounts of flooding, with the median yearly loss estimate being roughly $10.
Figure 6: Total average annual loss across Canada ranked by percentile

Image description
- Graph showing that, nationally, the residences that represent the highest 10% of average annual loss account for 89.3% of flood damages across Canada, highlighting the disproportionate effect of these residences. The total damages accounted for by these residences accounts for $2,650M of Canada's total estimated flood damage liability of $2,970M.
- Residences at the top 1% of average annual loss account for 34.1% of flood damages, further illustrating this disproportionate effect.
Decile |
Total average annual flood loss across Canada by decile |
|---|---|
0-10% |
$0.7 M |
10-20% |
$2 M |
20-30% |
$5 M |
30-40% |
$9 M |
40-50% |
$13 M |
50-60% |
$18 M |
60-70% |
$26 M |
70-80% |
$53 M |
80-90% |
$192 M |
90-100% |
$2,650 M |
Total estimated average cost of residential flooding in Canada |
$2,970 M |
This national flood damage estimate is higher than what has been referenced in previous national flood damage assessments, which are usually closer to $1.0 - $1.5 billion. Part of the reason for this higher estimate is that past residential address data usage has largely undercounted the true number of properties in Canada, which this research has improved upon. Secondly, this research factors in tail-risk flood events which have a low probability of occurrence, such as floods exceeding the 1 in 1000-year return period. Tail risks are innately uncommon but can cause significant damage in areas of high residential exposure. Such events would likely not have been captured using historical, or individual, year loss estimates given the relatively short period of comprehensive historical record-keeping from previous flood events. Finally, it should be noted that, most historical flood damage estimates in Canada have been based on insured losses, which fails to capture flood damage to residences which may have been borne by the homeowner and not recorded centrally or made available in loss records. In terms of projected changes to flood risk in Canada, research has shown that the frequency of flooding is expected to increase in the future in many areas of Canada compared to the historical recordFootnote 49 Footnote 50 Footnote 51. The IPCC has also noted that a key risk in North America is increasing weather and climate extremes (including precipitation events), as well as compounding and cascading climate hazards (e.g., future sea level rise combined with storm surge and heavy rainfall will increase compound flood risks)Footnote 52.
4. Equity and Social Vulnerability Analysis
Flooding does not affect all populations equally. Regional differences in Canadian populations and the residential flooding landscape merit specific considerations. To better understand the particular needs and challenges diverse populations may face accessing insurance, the Task Force undertook a social vulnerability analysis; conducted a focused engagement with Indigenous communities to strengthen the understanding of their experiences with flood risk, flood insurance and relocation; and researched some of the unique logistical and housing challenges facing Canada's North. This section summarizes the findings from these analyses, demonstrates the disproportionate impacts of flooding and flood insurance on diverse populations, and provides specific considerations relevant to developing an equitable national flood insurance solutions.
4.1 Social Vulnerability Analysis
In 2007, Public Safety Canada commissioned the Canadian Red Cross to develop a reportFootnote 53 to identify population groups at the highest risk of experiencing loss (e.g., injury, death, and damages) during a disaster, based on the twelve social determinants of health and well-being as defined by the Public Health Agency of Canada. The report found the most vulnerable populations included seniors, Indigenous Peoples, low-income residents, persons with low-literacy levels, transient populations, persons with disabilities, medically dependent persons, children and youth, women, and new immigrants and marginalized groupsFootnote 54. Socio-demographic identity factors and socioeconomic capacities can influence social vulnerability, which refers to one's ability to anticipate, cope with, resist, and recover from the impacts of a hazardFootnote 55 Footnote 56.
The Task Force sought to advance the collective understanding of social vulnerability and consider the intersecting nature of vulnerability factors, where one may identify with a number of socio-demographic and socioeconomic identity factors. This intersectionality can compound existing systemic barriers and create challenges for disaster resilience. Social vulnerability is not an inherent or static quality of any individual or group; it changes over time, and hazards can affect individuals and communities within the same demographic group very differentlyFootnote 57 Footnote 58 Footnote 59.
Drawing on recent academic and government research from international partners, a social vulnerability index (SoVI) was constructed using 49 different variables extracted from the 2016 census dataFootnote 60. With this disaggregated data, it was possible to locate geographic concentrations of social vulnerability and thus better understand the challenges faced by those who are at higher risk of flooding in Canada. At the national scale, average SoVI scores do not vary significantly between areas of high and low flood risk (Figure 7). SoVI scores were found to be higher, however, in high flood risk areas within four provinces (namely, Manitoba, Alberta, Saskatchewan, and New Brunswick). The index also revealed that socioeconomic vulnerability is highly concentrated in the core of large urban centers populated with more racial/ethnic subgroups, and poorly built environmental characteristics. A comparison of the average SoVI scores across PTs suggests that some urban centers exhibit a greater number of social vulnerability factors than others.
Figure 7: Average social vulnerability score nationally across high- and low-risk areas.

Image description
- Bar graph that compares social vulnerability index (SoVI) scores between areas of high and low flood risk at the national level and across provinces and territories.
- Nationally, average SoVI scores do not vary greatly between areas of high and low flood risk.
- Within certain provinces and territories, SoVI scores varied more significantly between high and low-risk areas. SoVI scores were higher in high risk areas in AB, MB, NB, and SK. This means that in the high-risk areas of these provinces, there remains a higher concentration of social vulnerability factors compared to low risk areas.
Social Vulnerability Index (Average scores) |
||
|---|---|---|
Province/Territory |
High Risk |
Low Risk |
Canada |
33.3 |
32.5 |
Alberta |
37.1 |
28.7 |
British Columbia |
36.4 |
36.8 |
Manitoba |
42.8 |
36.1 |
New Brunswick |
29.8 |
24.9 |
Newfoundland and Labrador |
23.4 |
24.7 |
Nova Scotia |
24.5 |
31.9 |
Ontario |
32.6 |
33.8 |
Prince Edward Island |
26.8 |
25.9 |
Quebec |
29.6 |
30.1 |
Saskatchewan |
38.6 |
29.2 |
Territories |
26.8 |
26.6 |
4.2 Socioeconomic Indicators in High Flood Risk Areas
Looking more closely at high flood risk areas, Canadian Census microdata including racial/ethnic, demographic, and socioeconomic characteristics were analyzed individually against high and low flood risk areas to establish whether there were differences in populations at a high risk of flooding.
The analysis demonstrated that certain identity factors of social vulnerability appeared to be consistently overrepresented in high flood risk areas across Canada (Figure 8). For instance, a higher proportion of Indigenous populations were found in high-risk areas across all PTs. Some marginalized groups with reduced physical mobility were generally higher in high flood risk areas across PTs, including the proportion of elderly residents, persons with physical or mental disabilities, and persons living alone. Measures of income and property wealth were generally lower in high flood risk areas in many PTs (with some exceptions), represented through indicators such as low-income status, those not in the labour force, and those residing within subsidized housing.
Figure 8: Representation of social vulnerability Indicators nationally and across high- and low-risk areas
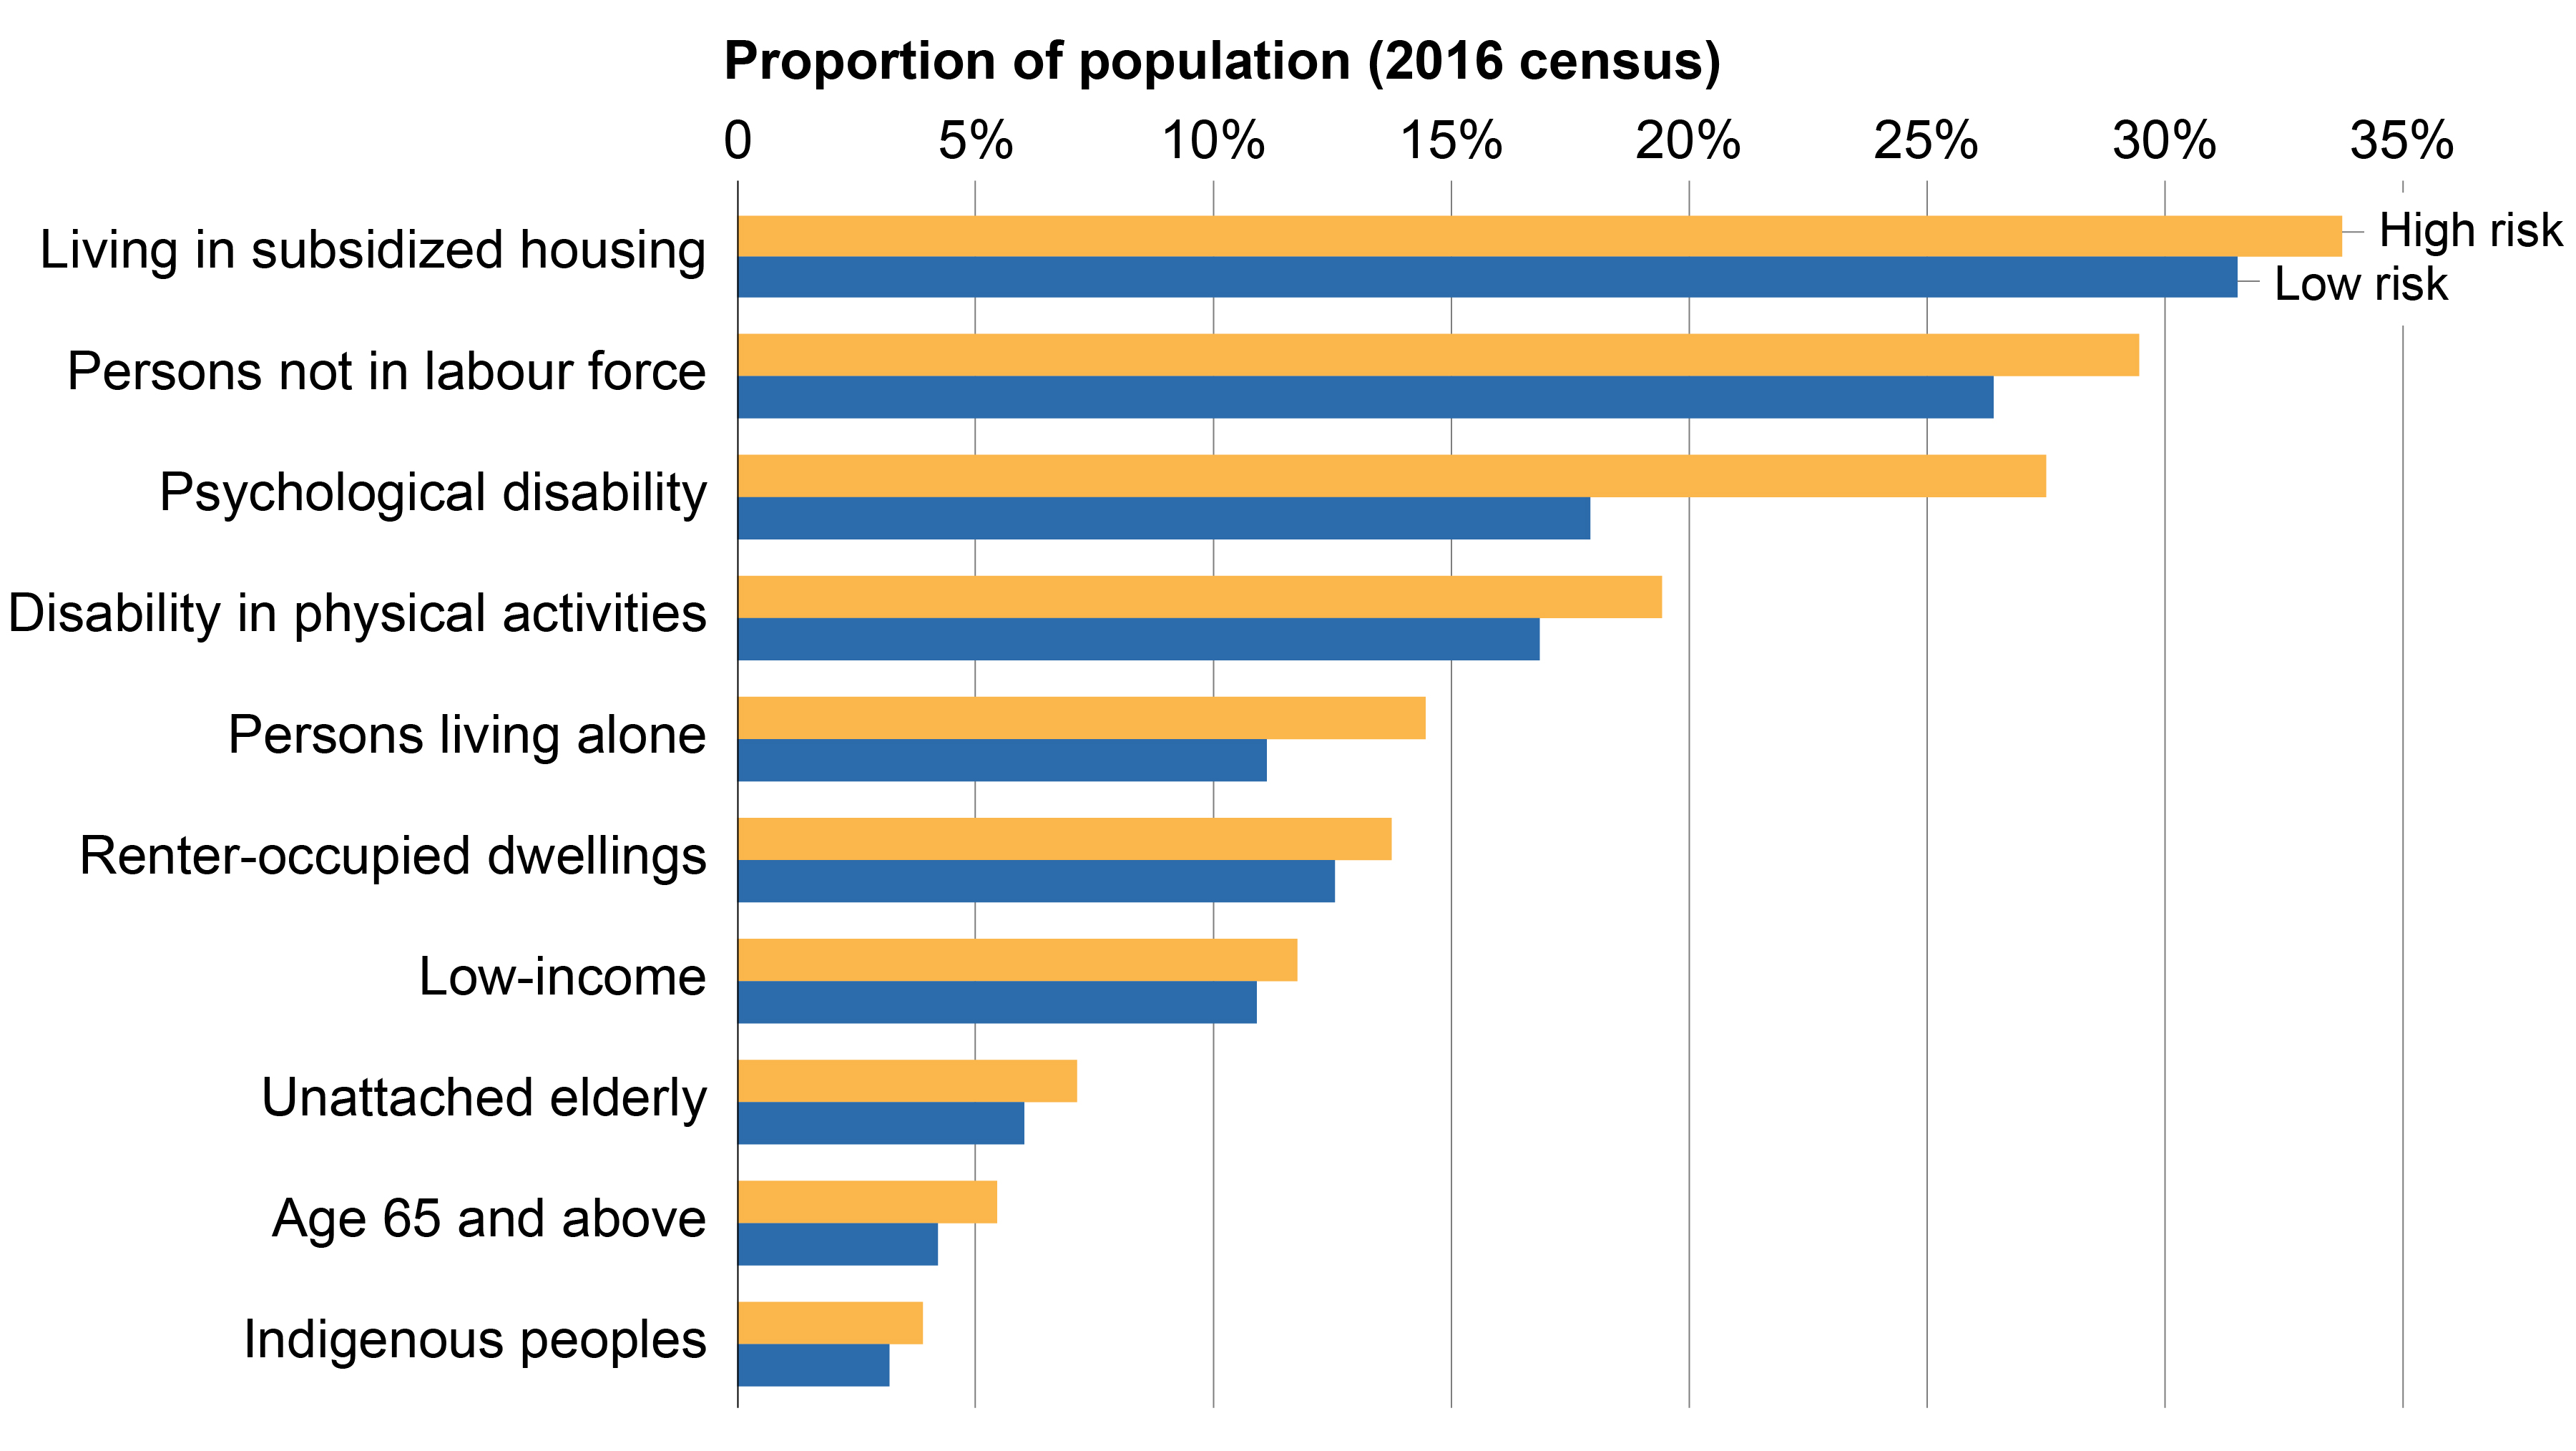
Image description
- Bar graph that compares 10 social or economic indicators across high and low risk areas in Canada.
- In high risk areas across Canada, there are marginally (2-4%) more people living in subsidized housing, not in the labour force, people who have a physical disability, and people who live alone in high risk areas compared with low risk areas.
- A more significant difference was found in the number of people with a psychological disability living in high risk areas (27%) compared with low risk areas (17%).
Percentage of population (2016 census) |
||
|---|---|---|
Social vulnerability indicator |
High risk |
Low risk |
Living in subsidized housing |
33.70% |
31.50% |
Persons not in labour force |
29.50% |
26.40% |
Psychological disability |
27.50% |
17.90% |
Disability in physical activities |
19.50% |
16.90% |
Persons living alone |
14.50% |
11.20% |
Renter-occupied dwellings |
13.70% |
12.60% |
Low-income |
11.70% |
11.00% |
Unattached elderly |
7.20% |
6.10% |
Age 65 and above |
5.50% |
4.20% |
Indigenous peoples |
3.90% |
3.20% |
While these trends were present across the country, some PTs reflected higher representation of the factors assessed. The proportion of racial or ethnic minorities, a historical indicator of social vulnerability to disasters, was higher in high flood risk areas for most PTs. The territories, and Prairie and Western provinces, especially British Columbia, had a relatively higher proportion of racial/ethnic populations in high-risk areas compared to Central Canada. In the territories, this included a higher representation of Indigenous peoples.
On measures of low income, including market-based measures and low-income cut-offs after taxes, Manitoba had a larger proportion of such populations in high flood risk areas than other PTs. While comparing economic insecurity indicators, such as lack of high school education, unemployment, those not in the labour force and requiring social assistance, Newfoundland and Labrador was found to have a higher proportion of population with those characteristics in its high-risk areasFootnote 61 Footnote 62.
The SoVI enabled a more detailed analysis of social vulnerabilities of people living in high-risk flood areas, which is a critical input into the design of an equitable national flood insurance program. More broadly, this type of analysis is essential to enable more effective and inclusive disaster risk management.
4.3 Focused Engagement on Indigenous Experiences with Flooding
Indigenous communities face disproportionately higher levels of flood risk compared to the rest of CanadaFootnote 63 Footnote 64 Footnote 65 and are more likely to experience prolonged displacement from flooding. The impacts of flooding are exacerbated by many factors, including the lasting effects of colonialism, loss of land and culture, forced resettlement to flood prone areas, failing infrastructure, geographic challenges in remote and northern communities, as well as the additional complexities of having to deal with multiple levels of government which can increase the length and the trauma of the recovery process.
The Task Force worked with Kuwingu-neeweul Engagement Services (KES) to engage with Inuit, Métis and First Nations peoples living off-reserve, organizations working in direct support of Indigenous peoples and communities, insurance industry representatives, and academics. This engagement focused on experiences within the context of flooding, flood insurance and strategic relocation. For the very personal and potentially triggering nature of the subject matter, KES created open spaces for the sharing of experiences, through which a number of themes emerged. These ideas are shared below and should help inform future work in continued collaboration and partnership with Indigenous peoples.
A parallel engagement was conducted by Indigenous Services Canada and the Assembly of First Nations, through the Steering Committee on First Nations Home Flood Insurance Needs, which focused on the experiences of First Nations communities residing on reserve lands. These ongoing engagement efforts are vital to understand the unique context of flood insurance for Indigenous communities, and will bring added depth and knowledge to help inform the policy development process.
Living with Flood Risk
Annual fluvial flood events can be somewhat predictable. Even though communities may know they are susceptible to seasonal flooding and have some advance warning, the lack of publicly available risk assessments can make it difficult to adequately prepare and mitigate risk. As well, it was noted that in some cases, living in a flood zone is often the only way to afford housing, when such locations have lower property costs.
In the North, many shoreline or island communities are at high risk of coastal flooding, less predictable than river flooding. Residents are often unaware of their flood risk exposure or may be willing to take their chances, perceiving the risk to be minimal. With the increasing impacts of climate change, shorelines will continue to recede, increasing the number of homes and even entire communities that are at risk of flooding due to ocean swells and erosion over the next few years. Due to the landscape, the cost of building flood resilient homes is even higher, and though sea walls can be put in place, they do not offer long-term protection for communities from changing sea levels.
Generally, there is a strong preference to remain on ancestral land and adapt to changing conditions. Though sometimes unavoidable, relocation remains an undesirable last resort due to the associated long process, mental, emotional and spiritual impacts, and stress of having to leave ancestral, traditional land. In these cases, full consideration should be given to housing resilience strategies and potential mitigation in lieu of relocation. Decision-making must ultimately be held by the community, including necessary supports and counseling, and involve considerations to continue to care for, love and honour the land if relocation occurs.
Experiences with Flood Insurance
Overwhelmingly, engagement found significant challenges for Indigenous communities in accessing, affording, and understanding flood insurance, compared to non-Indigenous communities. For those in areas susceptible to seasonal flooding, flood insurance can be cost prohibitive, if it is available at all. Insurance also generally only provides reimbursement to return the home to its original state, rather than allowing for greater flood resilience or improving the original standard of construction. For many Indigenous communities already suffering from below-average housing conditions, this creates persistent inequity.
In addition, a lack of clarity on the responsibility for purchasing flood insurance (i.e., owner or tenant), as well as the specifics surrounding what may be covered, in some cases reduces the likelihood of purchasing flood insurance. Organizations such as the Manitoba Métis Federation and Fort McKay Métis discussed the limitations for many community members who rent, as property-level flood insurance would not benefit them if their homes flood.
Many Indigenous peoples living off-reserve live in housing owned and cared for by Indigenous Housing Authorities or Indigenous housing organizations. While these organizations may have flood insurance for their properties, it may not cover the cost of temporarily relocating and housing individuals and families who are forced to evacuate due to flooding. Funding to support those who are displaced often comes from federal grants and the Canadian Red Cross which can be time consuming and challenging to access, especially for organizations already over capacity to logistically arrange suitable housing during evacuations and repairs. Finally, the challenges of Indigenous peoples living with flood risk can be further compounded by feeling cut off from support networks, complex bureaucratic processes, and underlying discrimination in everyday experiences.
Overall, the engagement efforts undertaken by KES underlined some deep and systemic challenges facing insurance as a possible solution to aid Indigenous communities, particularly in the absence of changes to other related issues within emergency management and housing. Some possible steps toward solutions were also brought forth, including capacity building. It should be noted that the need for FRM decisions and planning to come from Indigenous communities and individuals themselves, with culturally appropriate supports, particularly in the case of relocation, is of the highest importance.
4.4 Canada's North
Canada's North faces many unique challenges in the context of flood insurance due to its geographic considerations, lack of access, and logistical challenges. In addition, the North has a large proportion of Indigenous peoples and communities who may experience compounding vulnerabilities, as highlighted in the social vulnerability analysis (Section 4.1).
Building codes are often not adapted for northern conditions and fail to account for issues such as permafrost thawing, which causes irreparable damage to housing and needs to be mitigated through specialized construction techniques. The Canadian Standards Association (CSA) for example has been developing best practices that can be referenced in building codes to address the issue of permafrost. The document developed by the CSA offers insight on the impacts of climate change on infrastructure in Canada's northern regions, where permafrost terrain makes infrastructure more susceptible to damageFootnote 66 .
Access and logistics also differ significantly across regions. The western Arctic can typically make use of local resources, has road networks, and longer building seasons; while the eastern Arctic's materials are typically brought in by ship or plane, and shorter building seasons often result in higher costs for mitigating flood risk in that region.
Higher building costs combined with the low availability of affordable housing in the North contribute to challenges with overcrowding and homelessness. Inuit communities face the highest rates of overcrowding and, across Nunavut, more than half of residents live in social housing. Homeownership rates in the North were also among the lowest in Canada in 2016. When homes are owned in the North, high housing costs are likely to reduce ability to shoulder additional costs, such as residential flood insurance. Insurance viability in the North is already challenged by a geographic concentration of risk, and the high costs of administering products in markets with smaller populations. Low take-up, therefore, reinforces challenges for insurance providers to offer services and operate in the North. In the spring of 2021, the Northwest Territories government covered all flood damage costs because residents were underinsured or uninsured.
The complex realities of living in the North necessitate special consideration with respect to equity and affordability when looking into the viability of expanded flood insurance.
5. Building Policy Options for Canada
To identify viable models for a low-cost flood insurance program in Canada, the Task Force undertook an analysis of existing models in other countries. Following this, a number of lessons learned were identified for how such models could be applied in Canada. Critically, the development of different insurance models was also built upon a set of defined policy objectives (listed below in Section 5.3), which serve to guide the evaluation of the various models by the Task Force.
5.1 International Examples of Flood Insurance Solutions
A comparison was done of four national insurance regimes found in Australia, France, the United Kingdom, and the United States. The flood insurance models in these countries vary considerably in their design characteristics, including: the role of government (i.e., administration); whether the purchase of flood insurance is voluntary or compulsory (i.e., choice); if flood coverage is offered as a standalone product or bundled with other perils (i.e., packaging); and whether premiums are risk-adjusted or uniform (i.e., pricing). It should be noted, however, that all flood insurance models require trade-offs, and the sections below highlight the benefits and limitations of each system.
Australia
Australia's flood insurance system is a fully private market with minimal intervention from its government, with the exception of regulation that provides a standard definition of flood for insurance purposes. The government also takes on general regulatory roles of the industry. Both the offer (by insurers) and take-up (by residents) of flood insurance is voluntary, while packaging, comprehensiveness and specific flood-related perils covered vary by insurer. Premiums charged by insurers are risk-adjusted and are neither regulated nor subsidized by the Government.
The Australian flood insurance system can be demarcated into two groups: those with little-to-no flood risk, and those with medium, high, and extreme risk. For the first group, affordability and availability is high as policies generally include coverage at little to no cost. For the second group, insurance may not be universally available and when it is, the risk-based premiums can be costly, especially for those at highest risk.
The government is increasingly encouraging retrofits and insurers are recognizing them in premiums. Australia's system has very low costs to government, and makes strong use of private partnerships in flood risk management; value for homeowners is lower, however, with them shouldering significant financial burden for flood risk. Finally, the insurers and the insured benefit from a nationally standardized definition of flood, adopted by regulation, which ensures clarity of what is included and what is excluded in all flood insurance policies. This can increase market penetration by having a clear product consumers can compare to their property-level flood risk and subsequently choose to purchase.
France
Residential flood insurance in France is provided through the Catastrophe Naturelle or "CatNat" scheme, an extension of private insurance coverage for losses associated with large-scale natural disasters. Based on the principle of solidarity, residents pay a uniform 12% surcharge on their home insurance policies to cover natural disaster perils, including flood, regardless of individual risk. Local governments are encouraged to adopt a Plan de Prévention des Risques (PPR), which delineates 100-year flood areas and sets out both mandatory and recommended measures for the community and private property owners to reduce hazard exposure and vulnerability. The CatNat deductible is lower for communities with an approved plan.
Insurers have the ability to reinsure through the Caisse Centrale de Réassurance (CCR), a state-owned facility that is backed by the France government. Up to 50% of CatNat premiums can be ceded to the CCR in return for coverage at the same proportion. When a disaster occurs, claims are paid by insurers. Insurers are compensated by the CCR based on the proportion of premiums ceded. When an extreme disaster occurs (defined by ministerial decree), however, insurers are compensated by the CCR for the full amount of losses, minus a deductible. Property owners who have a mortgage are legally required to have home insurance, but purchase is optional if the property is owned outright – the CatNat surcharge is automatically added to all property insurance contracts. The surcharge, a flat 12% levy, equates to about €30 (~$40 CAD) per year on top of the average premium for a basic property insurance contract.
Strengths of this system include its market penetration (most homes are covered under the CatNat scheme), availability (offered to all homes with property insurance), and affordability (relative low cost of surcharge). Potential weaknesses include risk reduction, value for money, and transparency. The flat CatNat levy doesn't provide incentive for property-level mitigation; a reduction in deductibles for communities with a PPR, however, can help to drive risk reduction. Although the high penetration has been achieved at a low cost to the government, the CatNat pool could be stressed if confronted by successive major events. Finally, the lack of an explicit criteria for a ministerial decree triggering full CCR coverage could be subject to administrative inconsistencies.
United Kingdom
The United Kingdom's flood insurance system, also known as Flood Re, relies on private insurers to provide coverage to high-risk areas. Insurers cede the flood portion of residential property insurance policies and related premiums to a high-risk reinsurance pool when premiums fall above a pre-determined affordability cap. In line with the system's design, premiums are not highly reflective of risk, as affordability is prioritized instead, though premium caps are tied to home value indicated by council tax bands. As a result, the pool is topped up by a levy on insurers that is passed on to all residential policies, which totals £10.50 (~$18 CAD) per policyholder, per year.
The private sector operates Flood Re, a not-for-profit entity that administers the pool and is accountable to the government (i.e., Parliament). The government provides oversight of Flood Re, sets the level of affordability caps, and is meant to make mitigation improvements to lower the overall level of flood-risk. The arrangement was designed to be in place until 2039, with the initial expectation that properties would be sufficiently de-risked by this time to move towards risk-based pricing. Flood Re's Quinquennial Review (2019) reframed this objective to add the word affordable to their end objective, of having a "transition of the market to affordable risk reflective pricing" Footnote 67.
The strengths of this system include its availability, affordability, market penetration and compensation. Insurance is available to most high-risk properties (i.e., does not cover those built after 2009) and, combined with affordability caps and automatic bundling in homeowner's policies, leads to a high level of take-up. It also offers value for money given lack of direct costs to the government. Weaknesses include a lack of equity and risk reduction that results from the scheme. Due to the combination of affordability caps and levy imposed on all homeowner policies, wealthy, high-value, property owners can be seen as being subsidized by the broader population. Finally, risk reduction at the property level is somewhat limited due to the lack of a price signal due to subsidized premiums.
United States
Flood insurance in the United States is primarily administered through the federal National Flood Insurance Program (NFIP), operated by the Federal Emergency Management Agency (FEMA). The federal government is responsible for underwriting the risk of insurance policies sold. Private insurers can have roles of varying degrees and are paid a fee. Roles range from adjusting policies to writing, selling and settling policies for the NFIP.
Flood insurance is purchased separately from homeowner insurance and is mandatory for those with a federally-backed mortgage in designated flood prone areas, and voluntary for those living outside those areas. Premiums are fully risk-based in principle and based on rate maps developed by the government. FEMA operates a Community Rating System program, which is designed to reward communities that voluntarily implement risk-reduction measures in the community – those that do are eligible for premium discounts that lower the cost of insurance for homes within their boundaries. Prior to the development of rate maps, flood policies were subsidized by the government to encourage greater take-up. These policies and their discounted premiums have been 'grandfathered' into the current risk-based system. Beginning in 2021, grandfathered policies will see their premiums increase over time to ultimately reflect the flood risk being covered.
Strengths of the NFIP include its availability and affordability. Due to being sold through an arm of the federal government, policies are broadly available and cost about 1.8% of average household disposable income, although this may change as older policies and premiums are transitioned to reflect true risk. Weaknesses include low market penetration (about 30% in designated high-risk areas), risk reduction, and value for money. Few policies are sold outside of high-risk areas and overall participation is declining over time, and with no additional cost for repetitive loss properties, incentives are weak for property-level risk reduction. Finally, the overall cost of the NFIP for the federal government has been high due to the deep unfunded historical discounts provided.
5.2 Guiding Insights for Canada
The summaries of international examples show variation in both the design characteristics and resulting strengths and challenges faced by these flood insurance systems. Based on this analysis and on broader research of international best practices and lessons learned, twelve considerations or insights were identified under four themes, to help guide the development of policy options for Canada.
Uncertainty
- locate, map, profile and publicize high-risk flood areas
- invest in risk reduction in high-risk areas to expand insurability
- deter new property exposure in flood risk areas
Market penetration, adverse selection and mutuality
- leverage federal and provincial programs to incentivize or require the purchase of flood insurance in high-risk areas (a variety of levers/methods are possible)
- adopt the bundling of flood risk with other perils as a design priority
- collaborate with insurers to manage financial risk of high-risk properties, and align incentives across low, medium, and high-risk properties
Affordability
- negotiate an operational and simple definition of flood insurance affordability
- prioritize means-testing to guide any public subsidy to households for flood insurance affordability
- insurance affordability measures for high-risk properties should be explicitly temporary with the goal of levelling up to risk-based rates
Moral Hazard
- ensure policies clearly outline exclusions
- implement a minimum deductible to share costs with the insured
- avoid incentivizing new development in high-risk areas, including areas that are likely to become high risk in the future as climate change continues to change the risk landscape
5.3 Policy Objectives for Flood Insurance
In consideration of these twelve insights for Canada, the Task Force developed Public Policy Objectives for flood insurance to guide the design of models being explored and provide a framework for their evaluation and viability assessment. Public Policy Objectives can be best described as the goals one hopes to achieve with a program or policy. While a national flood insurance program is an output or outcome, Public Policy Objectives are the values or tenets of the policy or program. While all policy objectives are important factors to be included in the options being analyzed, there are often trade-offs between these objectives, which means that they can't and won't always be weighted equally, creating a challenging balancing act.
Viable flood insurance arrangements should: |
Key themes /characteristics |
|---|---|
Provide adequate and predictable financial compensation for residents in high-risk areas. |
|
Incorporate risk-informed price signals and other levers that promote risk-appropriate land use, mitigation, and improved flood resilience. |
|
Be affordable to residents of high-risk areas, with specific consideration for marginalized, vulnerable, and/or diverse populations. |
|
Provide coverage that is widely available for those at high-risk across all regions. |
|
Maximize participation of residents in high-risk areas. |
|
Provide value for money for governments and taxpayers. |
|
When designing an insurance system for Canada, it's important to understand the trade-offs for focusing on one objective versus another and how these decisions impact the relative performance of different insurance models and their suitability for the Canadian context:
- Focusing on availability by way of increasing affordability (i.e., accessibility) may reduce the financial incentive to help drive property-level risk reduction, and likely increases costs to governments.
- Prioritizing risk-based pricing will impact the number of residents that are likely or able to participateFootnote 68.
- Prioritizing affordability requires balancing the trade-offs between what is deemed an adequate level of coverage and an acceptable financial burden to the general publicFootnote 69 Footnote 70 .
- Focusing on cost-effectiveness specifically for FPT governments may shift the burden to homeowners or to municipalities. In other words, the $2.9 billion in flood risk cost does not go away with different arrangements, costs are simply shared differently; the amount of risk can only be reduced through mitigation and prevention.
- Maximizing participation, especially when mandatory provisions are combined with government funding premium caps and subsidies, increases government costs, and needs to be balanced with relative benefit of closing protection gap.
5.4 Insurance Models for Canada
In consideration of the background research, the guiding insights, and Public Policy Objectives, the Task Force proposed six conceptual risk-sharing models for further study. Two of these (variations on parametric community-based insurance) were discounted as further analysis found that they did not meet the policy objectives (full rationale provided in Annex D). The remaining four were then provided to a team of actuarial researchers who worked with Public Safety Canada to outline specific design parameters to enable costing. Section 6 provides the detailed overview of each model, along with the results of the costing exercise. The four models are:
- Flat Cap High-Risk Pool
- Tiered High-Risk Pool
- Public Insurance
- Public Reinsurance (Layered)
All of these models would conceptually have a limited life-span of approximately 25 years, to allow time for the market to transition to full risk-based pricing and for governments, communities, and individuals to make the necessary investments to mitigate risk.
6. Results of Model Analysis
The four conceptual models selected for actuarial analysis are examples of how risk-sharing arrangements may be structured and are meant to provide insights on the impact of features inherent to their designs. The specific parameters chosen within each model are meant to be illustrative for the purposes of comparison and costing across the models, and understanding the relative trade-offs. They have been structured to be distinct from each other in order to provide a meaningful assessment of these differences and trade-offs. The models all contain some baseline limitations.
6.1 Assumptions
Total Flood Risk
Analysis of costs for all models are based on the amount of residential flood damage calculated on behalf of the Task Force that totals an annual average loss of $2.9 billion.
Organizational Start-up Costs
This analysis includes on-going operational and maintenance expenses as they relate to the costs required from an actuarial perspective to cover the annual damages predicted by the hazard modelling. Organizational start-up costs are not included in this report and, depending on the options advanced, could differ between models. Additional work to support start-up costs may be considered within a feasibility analysis in due course.
Lifespan of Model
The analysis of the models is based on the costs and features as they would be defined in a given operational year, although all models are designed with the conceptual intent for a limited lifespan of approximately 25 years. The results do not include the changing costs that might occur as the models aim to transition or wind down, as further work is required to determine the criteria for the end of the arrangement as well as the steps that would be needed to achieve it.
Climate Change
The number, concentration, and regional distribution of homes at high risk of flooding are anticipated to change as a result of the increase and severity of climate events over the lifespan of an insurance arrangementFootnote 71. The Task Force expects that a changing climate will result in differences in the number and costs for households at risk. For the purposes of this costing exercise, levels of risk are set to flood hazard models as of 2020. Forward looking climate modeling is an important component that will be addressed as a part of a multi-year academic research project funded by Natural Sciences and Engineering Research Council of Canada, Public Safety Canada and the Insurance Bureau of Canada that will start in May 2022.
Inflation
Costs associated with this analysis are provided on a 2020 current dollar basis. These values include inputs such as construction costs and living expenses. Future projections and inflationary adjustments are not considered within the scope of this report as it would be difficult to predict these changes over the 25 year life-cycle of an insurance arrangement. Inflation would also be expected to impact the models in the same way, and therefore shouldn't fundamentally alter their comparative assessment.
6.2 Insurance Model Design Features
Threshold for "high risk homeowners"
For the purpose of this report's earlier sections on social vulnerability and Canada-wide damage estimations, high risk is noted as the top 10% of risk, by AAL (highest risk is the top 1%). For the costing of some insurance models in this section, however, a price-based threshold provides a more useful metric for delineating high risk homeowners from those at low/medium risk. Using a ratio of premium price relative to the coverage amount gives a clearer indication of where costs become significantly more burdensome, rather than simply the total damage that can occur. Therefore, 'high risk homeowners' in this section are defined as those for whom the premium price for flood insurance would be higher than 0.1% of coverage amount, or $300 for a $300,000 policy. This price point is generally in line with affordability levels outlined in literature and practice internationally. This threshold also equates to approximately 10% of households. For models that provide coverage only to high-risk homeowners, it is assumed that the private insurance market would expand the availability of coverage to the approximately 90% of homeowners that fall below the high-risk threshold (i.e., those at low and medium risk of flooding).
Affordability
Affordability of insurance is typically measured using the ratio of premiums over an indicator of household wealth or capacity to pay. Household wealth (or net worth) is the total value of financial and non-financial assets owned by households, minus the total value of outstanding liabilities. As a rule of thumb, the value of a home typically accounts for about 70% of a household's net worth; as such, a reasonable measure of wealth can be based on home values. Regarding capacity to pay, the most typical measures are based on income in some way.
Indicators of home values and of the level of household income tend to be positively correlated. Although not perfect, home value can provide a proxy for wealth, while income-based metrics can indicate the capacity to pay. This analysis uses a few methods to address issues of affordability.
Caps on premiums and subsidies are instruments governments can use to target individual homeowners to increase insurance affordability. Premium caps help keep costs reasonable for the majority and increase insurance uptake, while means-tested subsidies to support lower-income households. Both components can work in tandem to help address costs as a barrier to the purchase of insurance.
- Various premium caps are applied in each of the four insurance models. These could phase out over time as transition is made to risk-based pricing, affording time for household/community level mitigation, defense, or relocation.
- The income-based subsidy applied in two of the models is designed as a sliding scale, with a benefit that diminishes as household income increases. From 50% for the lowest income bracket relative to Area Median Income (AMI), the subsidy falls to zero when household income reaches higher thresholds. The subsidy is augmented when premium prices exceed certain income thresholds, providing added affordability for lower income households in high-risk areas.
Premium Loading Factors
In order to calculate the true cost of an insurance premium, a loading factor is applied to the base amount of loss that is expected each year and insured within the policy, or the average annual loss (AAL). The loading factor includes items such as claims administration, overhead costs, costs to purchase reinsurance, safety margins that ensure sufficient funds are collected to cover the expected risks, and additional living expenses (ALE) that would be paid to the insured for temporary lodging and incidentals. Each option has been calculated with a slightly different loading factor that makes careful assumptions about how each model works. Profit margin has been set to zero.
Cross Subsidization
Cross subsidization is a way to redistribute the total amount of premiums paid by high-risk homeowners. Low-risk homeowners would pay a higher premium than if it were fully risk-adjusted, with the objective to reduce, at least in part, the premium paid by high-risk homeowners. In the insurance models considered, a flat levy that ranges from $20-$45 is collected from all homeowners, providing an additional inflow of about $250 million to $650 million per year. In effect, the levy reduces the total amount of funding that comes directly from governments. It could be indexed to attributes such as performance of the arrangement, risks, and premiums as they change over time, however, this was not included as part of the current actuarial analysis. Levels of cross-subsidies in this costing exercise were set to reflect the intended design of each model and to try to optimize the arrangements given the level of government intervention, participation rates, etc.; It is understood, however, that these levels can be adjusted.
Deductibles
Deductibles allocate a first layer of costs to the homeowner and represent an influential lever in shaping the distribution of costs within an insurance arrangement. Deductibles can serve to reduce moral hazard and incentivize risk reduction, but, if too high, can also hinder take-up in a voluntary purchase scenario. For the purpose of costing the models, a deductible of $5,000 was selected as a reasonable starting point; some models, however, may also ultimately offer consumer choice in selecting deductibles. In addition, the relative affordability of a $5000 deductible is something that would need to be explored further. At this costing stage, however, it is set at a uniform level for simplicity.
Participation
Participation, or take-up rate, refers to the proportion of eligible homeowners who choose to buy flood insurance. International evidence as set out by the OEDC shows a strong correlation between participation and regulations. In countries such as Canada, whereby firms are not obligated to offer flood insurance, and homeowners are not obligated to purchase it, participation is low.
From a financial perspective, failing to achieve a high participation rate has several implications. As the risk of flooding is spread over fewer homes, financial stability of any model is more difficult to achieve as a result of a lack of diversification and, consequently, greater concentration of risk. The risk sharing models becomes less cost effective and premiums increase, which, in turn, contributes to a vicious cycle of worsening participation.
More importantly, a lower take-up rate implies that homeowners bear a larger proportion of flood risk. In other words, the take-up rate is inversely proportional to the amount of residual risk borne by homeowners. A risk-sharing model with a low take-up rate simply does not fulfill its primary goal of protecting Canadians against the most frequent and costly type of natural disaster in the country.
Residual Risk is the amount of financial risk left in the system once insurance options have been applied. In moving from public DFA programs funded by all taxpayers to an insurance-based system, it is important to understand how much residual risk exists in each model, as these costs would fall on the shoulders of homeowners who are either uninsured or underinsured.
The status quo in Canada is that flood insurance is not required to be offered by insurers and is not a condition for any financial arrangement such as a mortgage. In addition, households do not have any obligation to purchase flood insurance, though FPT governments have access to financial sector policy tools or other regulatory measures to increase the offer and take-up of insurance. Approximately 40 to 60% of Canadian households are currently estimated to have flood insurance, although policies may have limitations such as a low coverage amount or high deductible (reducing the adequacy of the coverage). Importantly, this uptake is also concentrated in low and medium risk areas. It is expected that behavioural tools to enhance awareness of property-level flood risk can increase participation rates by up to 15%Footnote 72 and this has been incorporated into the baseline participation rates assumed by the actuarial analysis, ranging from 35% for high-risk households to 80% for low-risk households. Although optimistic, this is believed to be achievable through interventions such as enhanced public awareness and the incorporation of affordability supports.
The interventions applied to each of the insurance models were selected to correspond with what was realistic given the level of government involvement associated with each model. A range of illustrative take-up rates were applied, with the highest rate of participation corresponding to the low-risk households and vice versa. The premium price itself is also an important driver of participation rates, and has been factored into the rates assumed for models that have optional insurance. The specific inputs on participation rates for the actuarial analysis are outlined for each model in Section 6.3 below.
Standardization of Flood Insurance Policies
Generally, the more government involvement in the insurance sector, the more likely insurance policies would exhibit some forms of standardization. FPT governments have tools available to bring about such standardization, which itself can come in different forms. Policy language may be standardized to ensure clear, simplified, and understandable policies. Perils and damage covered could be standardized across a group (e.g. high-risk) or all those insured. Coverage could also be bundled for different water-related perils in a standardized way to increase clarity and remove ambiguity of responsibility. While insurers as a group could decide to voluntarily standardize their product offering, this paper assumes that policy standardization is more likely as government involvement increases across the respective models and is a 'soft' feature (i.e. has no implication on costing).
Automatic Ceding of Flood Policies
Three of the four models examined (i.e. all except the Public Insurer model) require a mechanism for the transferring of risk from insurers to another entity – that which manages the high-risk pools for the 'pooled' models, and that which acts as a reinsurer for the Public Reinsurer model (see Section 6.3 below for details). For the purpose of modelling, insurers are assumed to automatically cede their high-risk flood coverage. In practice, ceding or not could also be structured voluntarily, allowing insurers to hold on to that risk if they choose.
6.3 Insurance Models for Actuarial Costing
Note: A detailed breakdown of each insurance model's design features is provided in Annex E.
Model 1: Flat Cap High-risk Pool
This model is based on a pool for high-risk homeowners, with minimal intervention by governments into the operating of the high-risk insurance market, but with significant support from governments to bring about affordability through a single and relatively low flat premium cap for high-risk properties. This high-risk pool is modeled to be stabilized with market-based reinsurance as well as an automatic government backstop. The offer of standardized coverage for high-risk homeowners from insurers is mandatory, while take-up by homeowners is optional. Premiums charged to high-risk homeowners who choose to be covered are risk-based, up to the premium cap placed on coverage. The cost of capping premiums is funded by governments, and a relatively low levy on all residential property policies is assumed. No additional income-based subsidies are applied. For homeowners at low-to-medium risk, there is no intervention in the operating of the insurance market. As a result, there is relatively high variability assumed in the coverage offered by insurers and taken up by homeowners in this group.
Who is included? |
Households at high risk of flooding defined as gross premium > 0.1% of the coverage limit (e.g., $300 for $300,000 of coverage) |
|---|---|
Flood Premium Cap |
$500 |
Income-based subsidies |
None (due to relatively low premium cap in this model) |
Coverage Cap |
$300,000 per event |
Deductible |
$5,000 |
Cross Subsidization |
$20 levy on all residential property policies |
Stabilization |
Reinsurance and automatic government backstop |
Participation Assumptions |
Mandatory offer, optional purchase. Assumes a participation rate ranging from 80% for low risk, 50% for medium risk, and 50% for high-risk households |
Premium Loading Factor |
96% of the Average Annual Insured Loss. Costs are predominantly as a result of the additional living expenses, claims, and claim administration |
Policy Standardization |
Standardized policies for those included in the arrangement. |
Model 2: Tiered High-risk Pool
This model is also based on a pool for high-risk homeowners, but with added government intervention versus the Flat Cap model. Rather than a single flat premium cap, estimated home reconstruction costs are used to divide high-risk homes into quintiles (5 equal shares). Each quintile is assigned a premium cap that increases as reconstruction costs increase. Reconstruction costs were used in the modelling as a simple proxy for wealth and ability to pay. Governments intervene to require a mandatory purchase of flood insurance to those with a mortgage. The costs of applying the tiered premium caps in this model is assumed to be funded by governments as well as a higher levy on all residential property policies. No additional income-based subsidies are applied. As in the case of the Flat Cap High-risk pool, this model has some variability in the coverage of policies for households which are not leveraged by a mortgage.
Who is included? |
Households at high risk of flooding defined as gross premium > 0.1% of the coverage limit (e.g., $300 for $300,000 of coverage) |
|---|---|
Flood Premium Cap |
5 levels of cap based on quintiles of reconstruction costs: $250; $500; $1,000; $2,000, and $4,000 |
Income-based subsidies |
None (due to affordability measures applied through tiered premium caps) |
Coverage Cap |
$300,000 per event |
Deductible |
$5,000 |
Cross Subsidization |
$40 levy on all residential property policies |
Stabilization |
Reinsurance and automatic government backstop |
Participation Assumptions |
Mandatory offer to all; mandatory purchase with mortgage and optional without. Assumes a participation rate ranging from 80% low risk, 65% for medium risk, and 65% among high-risk householdsFootnote * |
Premium Loading Factor |
96% of the Average Annual Insured Loss. Costs are predominantly as a result of the additional living expenses, claims, and claim administration |
Policy Standardization |
Standardized policies for those included in the arrangement; comprehensive bundling of water coverage. |
Model 3: Public Insurer
This model features a Crown corporation which underwrites comprehensive flood insurance through the insurance industry as an intermediary, with an automatic government backstop. Unlike the first two models whereby a pool covers only high-risk properties, the Crown corporation intervenes in the insurance market by covering all overland flood risk in Canada. As such, both the offer and purchase of flood insurance is made mandatory. Private insurers are the customer-facing entities that collect premiums, pay claims, and service policies on behalf of the Crown corporation, in exchange for a fee. The Crown corporation is stabilized through greater pooling ability, private reinsurance, and a government backstop. High-risk premiums are capped at a relatively higher level versus the pooled models, however an income-based subsidy is applied to increase affordability. The cap on premiums and income-based subsidies are funded by governments and a relatively higher levy on all residential home insurance policies. Due to coverage which is provided by governments, policies and coverage levels are more likely to be standardized.
Who is included? |
All households (low, medium, and high risk) |
|---|---|
Flood Premium Cap |
$3,000 |
Income-based subsidies |
Sliding scale based on income, funded by FPT governments |
Coverage Cap |
$300,000 per event |
Deductible |
$5,000 |
Cross Subsidization |
$45 levy on all residential property policies |
Stabilization |
Reinsurance and stabilized via an automatic government backstop |
Participation Assumptions |
Mandatory offer and mandatory purchase via bundling with home insurance. Assumes a participation rate of 95% for low and medium-risk households (i.e., have home insurance) and 90% for high-risk householdsFootnote ** |
Premium Loading Factor |
66% of the Average Annual Loss and includes annual living expenses. This factor is lower than that of prior models because administration costs are charged as a flat fee from insurers to the Crown corporation. |
Policy Standardization |
Standardized policies for all those with home insurance; comprehensive bundling of water coverage. |
Model 4: Public Reinsurer
This model introduces a layered approach that builds on both public and private-based elements of previous models. The provision of flood insurance occurs in two layers: the first layer provides the homeowner the option to purchase insurance from the private market, at the full risk-based price, which must offer coverage up to a modest limit ($25,000); the second layer involves the mandatory purchase of flood insurance above this coverage limit up to a high limit ($300,000) from the insurance industry. The Crown corporation would sell subsidized excess of loss reinsurance to private insurers, and reimburse insurers for losses covered in the second layer. For the second layer, the premium cap and funding structure, and provision of supports for low-income homeowners are as specified in the Public Insurer model. The Crown corporation is stabilized through a government backstop and market-based reinsurance. For the first layer, due to the pure market nature of insurance in this model, policies are unlikely to be standardized. For the second layer, however, standardization may be more likely as a condition of access to subsidized reinsurance for insurers. Full risk-based pricing for the first layer may be very costly and can serve as an effective price-signal to homeowners of their risk exposure. Particularly for those at high-risk, it can serve as an incentive for property-level mitigation, moving, or choosing to self-insure on this first layer, but would be protected for catastrophic costs through the second layer.
First Layer |
Second Layer |
|
|---|---|---|
Who is included? |
All households (low, medium, and high risk) |
All households (low, medium, and high risk) |
Flood Premium Cap |
None |
$3,000 |
Income-based subsidies |
None |
Sliding scale based on income, funded by FPT governments |
Coverage Cap |
$25,000 |
$300,000 |
Deductible |
$5,000 |
N/A |
Cross Subsidization |
$20 levy on all residential property policies |
|
Stabilization |
Determined by individual insurers' business model |
Reinsurance and stabilized via an automatic government backstop |
Participation Assumptions |
Mandatory offer and voluntary purchase. Assumes a participation rate ranging from 80% for low risk, 50% for medium risk, and 35% for high-risk households |
Mandatory offer and mandatory purchase via bundling with home insurance. Assumes same participation rate as Public Insurance model |
Premium Loading Factor |
166% of the Average Annual Insured Loss. This factor is higher than that of prior models due to the reinsurance costs, claims costs, additional living expenses, and enhanced safety margin |
66% of the Average Annual Loss and includes annual living expenses. This factor is lower because administration, distribution & overhead are assumed by the private market |
Policy Standardization |
Non-standardized policies; comprehensive bundling of water coverage |
Standardized policies for all homeowners; comprehensive bundling of water coverage |
6.4 Actuarial Results of Four Models
The structures and features set out above have enabled additional analysis regarding each of the models examined. The analysis includes examining assumed participation according to low and high-risk households; the required annual funding; residual risk according to low and high-risk households; payments for losses when a flood occurs, and; the value and probability of a government backstop. The following figures synthesize key outputs in the modeling, and draw attention to how variations in the inputs impact findings.
Participation
For modelling purposes, participation in each insurance model is treated as an input and not as a result of the modeling analysis. Future participation rates can be difficult to predict, and would be influenced by factors such as the withdrawal of DFA for flooding, risk mitigation investments, and supports for strategic relocation. For the purposes of this analysis, participation is considered using take-up rates currently observed in the market for optional offer and purchase of flood insurance (i.e. 40-60%), adjusted for the circumstances in each model, and categorized according to low and high risk. Public education efforts on flood-risk are assumed within the participation rates for each model.
It is also important to compare the models in terms of which households are participating from a risk-based perspective. For the Flat Cap high-risk pool model, low-risk households are assumed to have a take-up rate of 80%, due to the relatively low absolute cost for this group; a lower take-up rate for medium risk is assumed at 50%, and; high risk take-up is also assumed at 50% due to the relatively low cap as the key driving force. For the Tiered high-risk pool, low risk households are still assumed to participate at 80% while medium and high-risk households are assumed to increase participation to 65% due to the introduction of mandatory purchase requirement for those with mortgages. For the Public Insurance model, participation rates for all risk levels range from 90% to 95% due to the mandatory bundling of flood insurance with property insurance. For the first tier of the Public Reinsurance model, low and medium risk homeowners are assumed to have the same take-up rate as the Flat Cap model, while high risk participation rates are assumed to be 35% - fairly low due to full-risk-based pricing. For the second tier, participation rates are assumed to be the same as for the Public Insurance model, due to the mandatory bundling with property insurance.
Figure 9: Participation according to high and low risk insured and uninsured households, by arrangement

Image description
- A comparison that shows the percentage of all households that are assumed to be insured and uninsured by level of risk in each insurance model, either by the proposed model directly, or by the private market. All numbers are approximations.
- The Flat Cap high-risk pool model would leave the most (31%) of all households uninsured, while the Public Insurer model would leave the least (5%) of households uninsured. In the Tiered High-Risk pool model, about 23% would be uninsured. Owing to the layered nature of the Public Reinsurance model, the number of total uninsured across the two layers lands between that of the Tiered and Public insurer models.
Participation rate, all households |
|||||
|---|---|---|---|---|---|
Low-risk |
High-risk |
Total |
|||
Model |
Uninsured |
Insured |
Uninsured |
Insured |
|
Flat cap high-risk pool |
25.1% |
63.7% |
5.4% |
5.8% |
100% |
Tiered high-risk pool |
18.7% |
70.1% |
3.9% |
7.3% |
100% |
Public insurer |
4.3% |
84.5% |
1.1% |
10.1% |
100% |
Public reinsurer layer 1 |
19.7% |
69.1% |
8.4% |
2.8% |
100% |
Public reinsurer layer 2 |
4.3% |
84.5% |
1.1% |
10.1% |
100% |
Required Annual Funding
A comparison of the annual funding by source and model demonstrates the expected requirements to support funding of each model. While there is significantly more funding from all sources required to support the Public Insurer model, the resulting residual risk in the system is lowered as a higher proportion of homeowners are covered at all risk levels.
Figure 10: Required annual funding, by arrangement, $billions

Notes:
- Funding by government represented in blue and includes: costs of premium caps and costs of premium subsidies.
- Funding by household represented in green and includes: premiums external to the model, premiums paid within the model, and cross subsidization.
Image description
- A comparison of the annual funding, by source, required to support each model, as well as the residual risk in each model. The analysis distinguishes costs that are funded by households versus those funded by government through caps and subsidies. All amounts are approximate.
- Total funding from government is highest in the Flat Cap High-Risk pool model ($1.2 billion. The Public Insurer model has a similar level of government funding support ($1.1 billion) and the lowest amount of residual risk ($850 million).
- The Tiered High-Risk pool and Public Reinsurer models have a similar level of government support required (about $900 million) with residual risk higher in the Tiered High-Risk pool model ($1.4 billion) than the Public Reinsurer model ($1.2 billion).
- Funding from households are highest in the Public Insurer model ($3 billion), owing to the high participation rate assumed due to a combination of mandatory take-up provision and higher cross subsidy per homeowner, while the Flat Cap High-Risk pool model has the lowest amount of funding from households ($1.2 billion) due to a combination of lower participation rates, relatively higher funding from governments to keep the premium cap low, and lower level of cross subsidy.
- The Public Reinsurer model has the second largest funding requirement from households ($2.7 billion) due to a combination of premiums paid to the private market in Layer 1 and the mandatory take-up provision of Layer 2. The amount of funding required from homeowners in the Tiered High-Risk pool ($2.1 billion) lies between the Flat Cap High-Risk pool and the Public Reinsurer model.
Annual funding in $billions |
|||||
|---|---|---|---|---|---|
By government |
By household |
||||
Model |
Costs of premium subsidies |
Costs of premium caps |
Cross subsidization |
Premiums paid within the model |
Premiums external to the model |
Flat cap high-risk pool |
$0 |
$1,172.4 |
$282 |
$378 |
$580.4 |
Tiered high-risk pool |
$0 |
$893.6 |
$564.1 |
$814 |
$747 |
Public insurer |
$540.5 |
$548.4 |
$634.6 |
$2,383.1 |
$0 |
Public reinsurer |
$446.5 |
$446.5 |
$282 |
$1,344.5 |
$1,069.6 |
Model |
Residual risk in $billions, all households |
|---|---|
Flat cap high-risk pool |
$1,690.2 |
Tiered high-risk pool |
$1,383.2 |
Public insurer |
$850.5 |
Public reinsurer |
$1,232.3 |
In fact, the trend for residual risk is inversely correlated to the funding required in each plan. The analysis distinguishes premiums that are funded by household versus those funded by government through caps and subsidies and considers those which are external to the model itself.
Residual Risk
Each model provides the percentage of those losses that remain on the shoulders of homeowners as a function of both (1) homeowners who choose to not purchase insurance, and (2) deductibles paid by homeowners, and (3) damages that occur above the coverage cap. Differences between the models are largely explained by the differences assumed for participation. For example, for the Public Insurer model, virtually all homeowners are included in the arrangement due to the introduction of mandatory take-up linked with property insurance coverage. As such, residual risk is the lowest overall. For the Flat Cap High-Risk Pool and the Tiered High-Risk Pool, residual risk is higher, given the lower overall participation rates assumed. The Public Reinsurance model has residual risk between the Pool models and the Public Insurer because Layer 1 is optional whereas Layer 2 is mandatory and the model assumes that not all households have purchased the market-based Layer 1 optional insurance.
Figure 11: Residual risk for households according to low and high risk

Notes: Each bar represents the percentage of residual risk relative to the total AAL for that category of risk level (i.e. High or low-risk).
Image description
- Each bar represents the percentage of losses incurred by homeowners in either the high or low-risk groups as a result of (1) homeowners who choose to not purchase insurance, and (2) deductibles paid by homeowners, and (3) damages that occur above the insurance coverage cap. Together, these combine to make up residual risk.
- As residual risk is directly tied to participation rates, all else equal, for those at high risk of flooding, the Flat Cap High-Risk pool model has the highest level of residual risk, while the Public Insurer model has the lowest. The Public Reinsurer model has the second lowest residual risk for those at high-risk of flooding, followed by the Tiered High-Risk pool model.
Percentage of residual risk relative to the total average annual loss |
||
|---|---|---|
Model |
High risk |
Low risk |
Flat cap high-risk pool |
56.4% |
62.4% |
Tiered high-risk pool |
45.2% |
53.4% |
Public insurer |
24.3% |
41.9% |
Public reinsurer |
38.7% |
51.6% |
Mean Premium Costs for High-Risk Households
The table below shows costs associated with premiums for only high-risk households and according to income group. For the Flat Cap High-Risk pool, premium costs are stable across income groups due to the single cap applied in this model, thus limiting excessive premium costs for all high-risk households. The Tiered High-Risk pool includes slightly lower premiums for low and very low income groups, due to the tiered premium caps being applied on the basis of a home's reconstruction costs, which acts as a rough proxy for income and wealth. Insurance provided by the Public Insurer applies a cap to limit the highest premium costs, and also then brings costs down using income-based subsidies. This is why mean premiums for high-risk households in this model are significantly different between the income groups.
Due to the layered approach, results from the Public Reinsurer model are somewhat complex and warrant a closer examination. Layer 1's mean costs appear high relative to the amount of coverage included, due to the concentration of losses that occur below 25K for high-risk households. Participation in Layer 1 is optional and fully risk-based, and it is expected that willingness to purchase this coverage would drop off at a certain (undefined) threshold due to high costs. Layer 1 is not designed to prioritize affordability (no subsidies or caps are applied), instead, it is designed to incentivize property-level risk reduction. While true to some extent in all models, the cost of coverage in Layer 1 is particularly sensitive to property level risk reduction which can be quite effective at mitigating risks for smaller events. Similarly, prevention and relocation measures at the community and watershed level for properties at the highest risk of repetitive flooding are predicted to have a strong effect in lowering costs in Layer 1. In Layer 2, caps and income-based subsidies similar to the Public Insurer model are applied, providing targeted support to lower-income households.
Figure 12: Mean premium costs, high-risk households
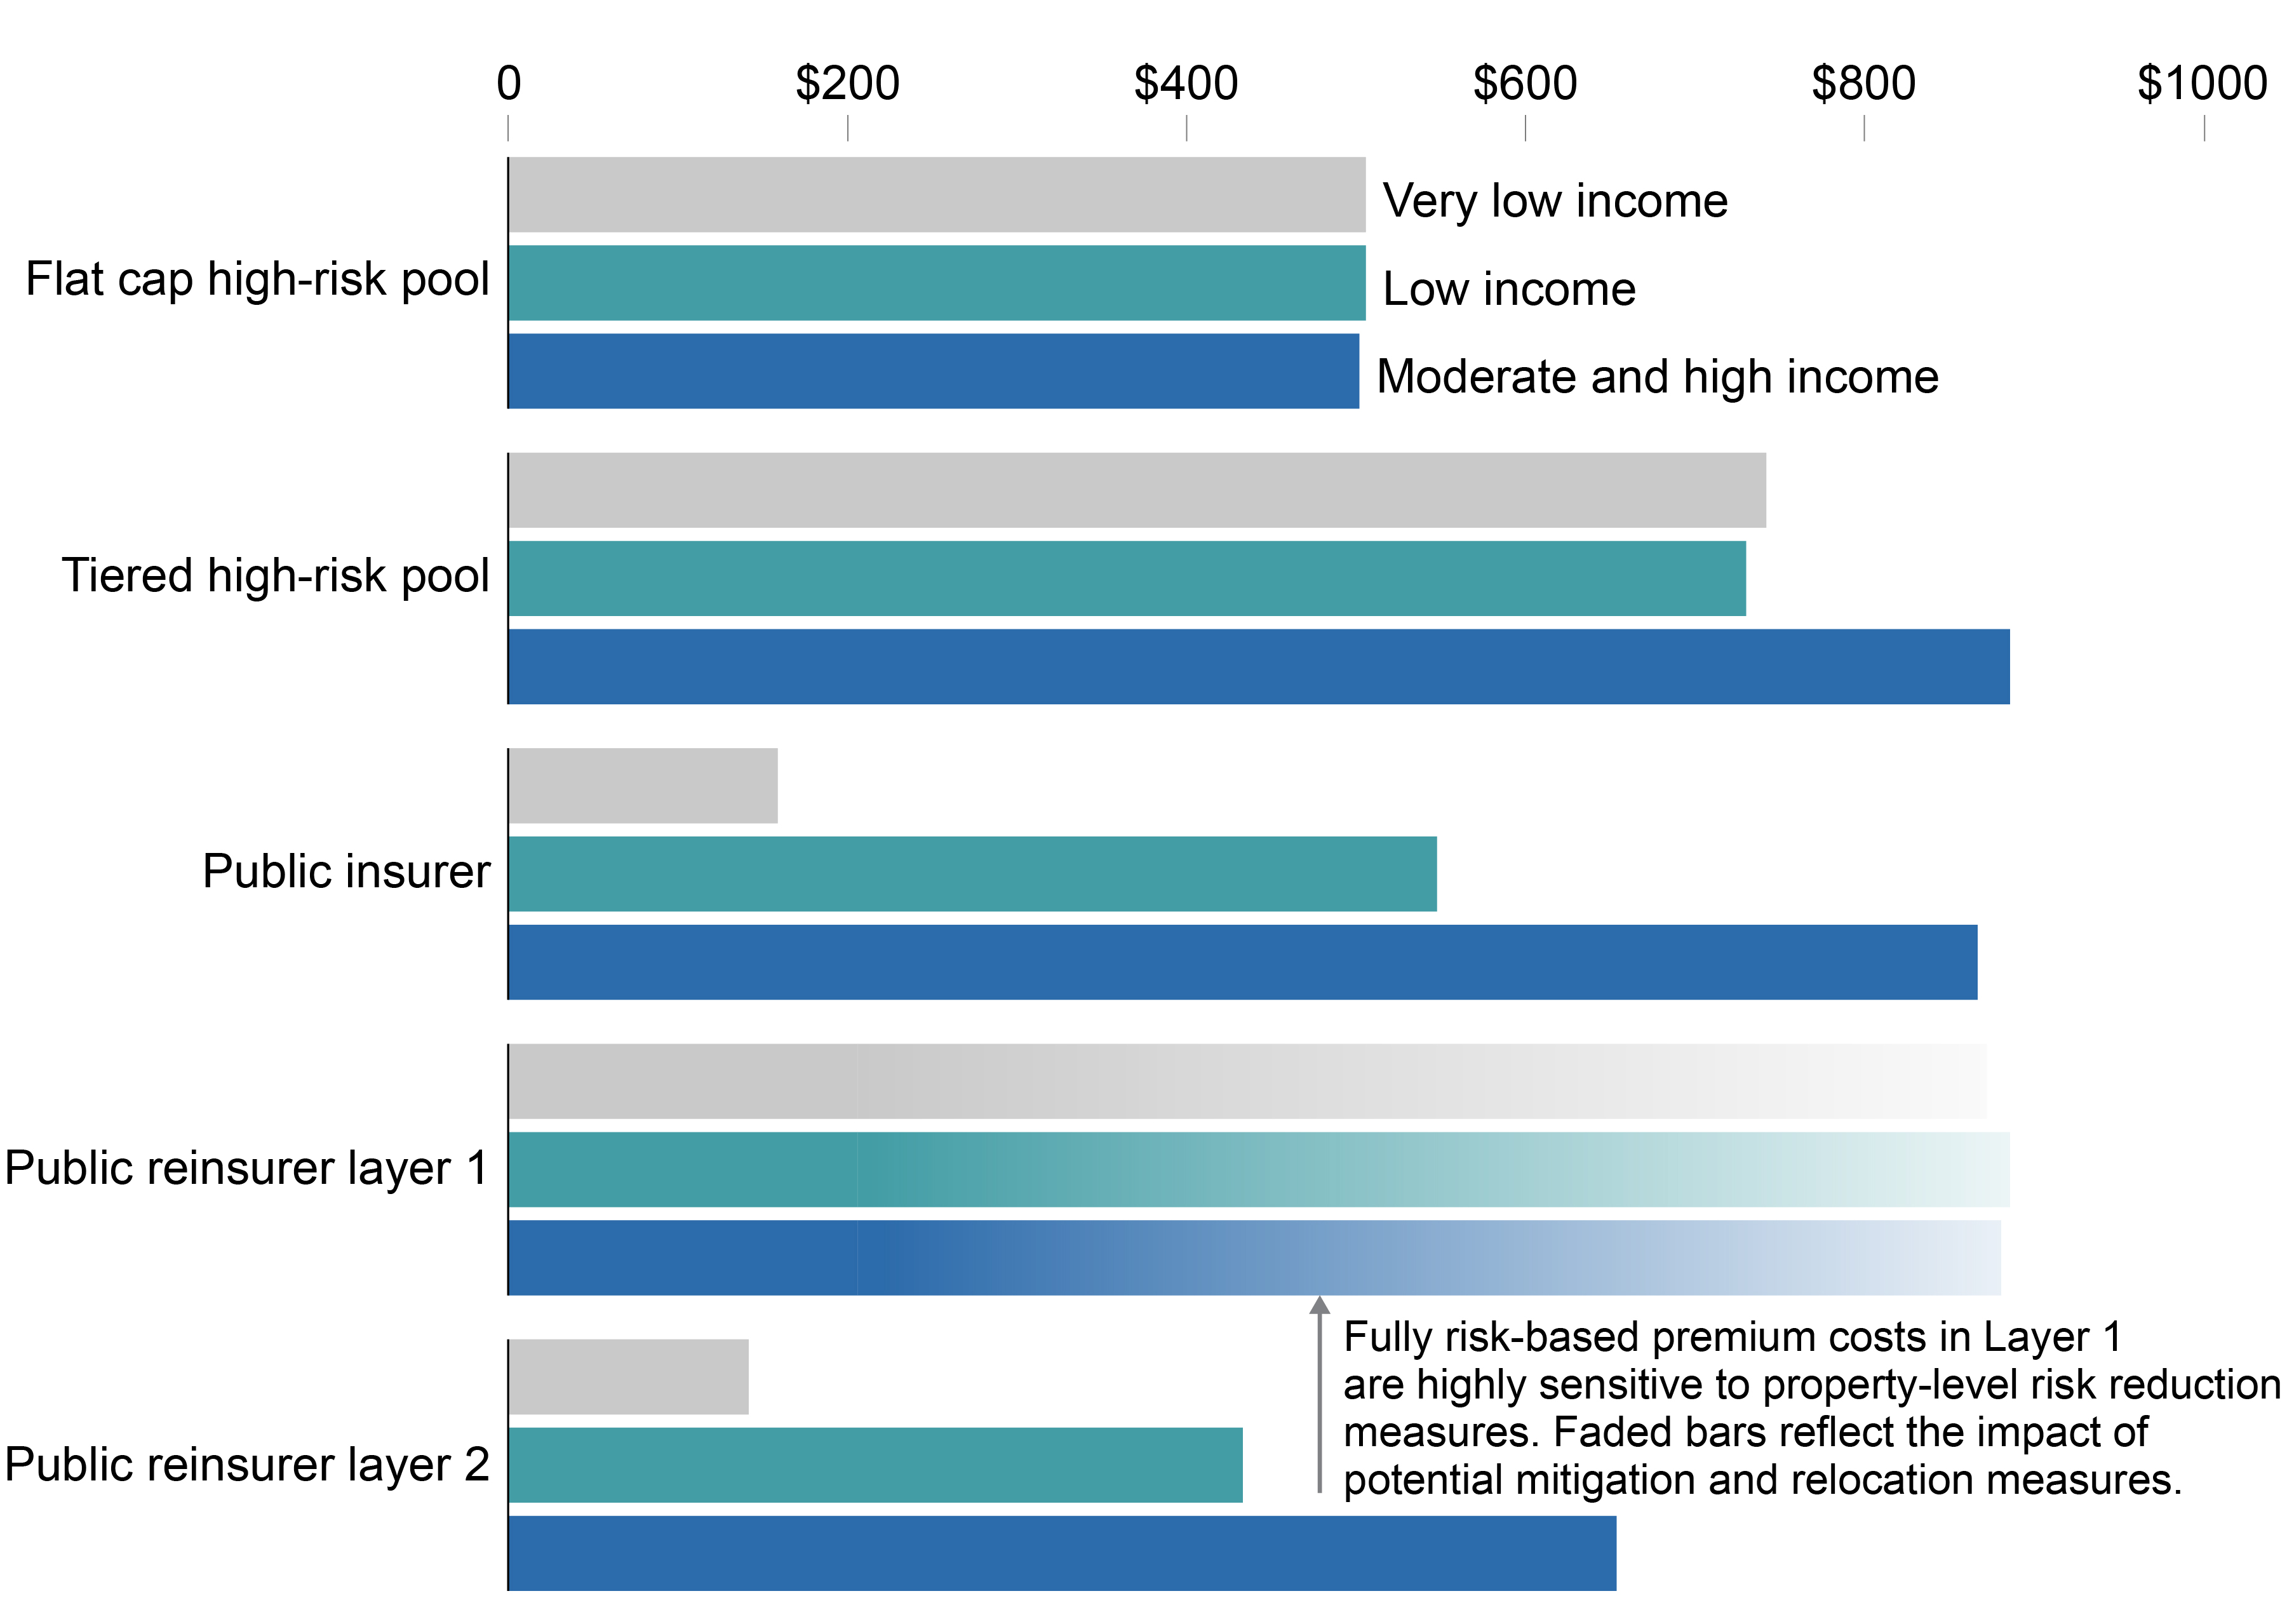
Image description
- The bar graph demonstrates the costs associated with premiums for high-risk households and according to income group, for each model.
- For the Flat Cap High-Risk pool model, average premium costs are stable across income groups, due to the relatively low premium cap applied in that model; premiums for the Tiered High-Risk pool model are stable between the very low and low income groups, which are both lower that premiums associated with moderate and high income groups.
- The Public Insurer and Layer 2 of the Public Reinsurer have the highest variation in premiums according to income group, with the lowest income group being associated with the lowest premium cost and the highest income associated with the highest premiums; the high level of variation across income groups is due to the effectiveness of the income subsidy applied in these two models.
- Premiums of the Layer 1 of the Public Reinsurer are the highest and stable across all income groups because these premiums are based solely on risk, without any caps or subsidies applied. These premiums are highly sensitive to property-level risk reduction measures.
Mean premium costs, high-risk households |
|||
|---|---|---|---|
Model |
Very low income |
Low income |
Moderate and high income |
Flat cap high-risk pool |
$466 |
$467 |
$465 |
Tiered high-risk pool |
$741 |
$729 |
$889 |
Public insurer |
$161 |
$548 |
$867 |
Public reinsurer layer 1 |
$800 |
$868 |
$654 |
Public reinsurer layer 2 |
$141 |
$430 |
$654 |
Average Losses and Those During a Large-scale Catastrophic Event
In low-risk households affected by a major flood, uninsured households, as expected, shoulder a significant portion of the overall losses. This effect is magnified in high-risk households during these types of catastophic events, where lower participation rates in the pool models result in substantial costs on the shoulders of uninsured households.
The following table sets out the rationale for insurance given the probability of flooding for high-risk households. Losses are considered for two scenarios: average annual events and large-scale ones. In the Flat Cap High-Risk Pool, uninsured households will incur significant losses during large-scale events.
The results in this analysis are the consequence of participation and the use of government tools on the requirements of insurance. Optional insurance will result in a share of households uninsured, and evident are the circumstances in which they suffer the most. Low participation or optional provisions will leave governments with a difficult choice when a catastrophic event occurs: allow homeowners to manage the impacts on their own or provide additional post-disaster supports. A plan with high participation due to mandatory provisions is meant to leave no one behind, and gives confidence to homeowners that they will always be covered. Consequently, what appears inexpensive today, may become even more costly in the future.
Figure 13: Losses assumed by high-risk household, $ millions

Image description
- Shows the total flood-related losses assumed by insured and uninsured households from an average event and from a large-scale catastrophic event, by arrangement. Differences amongst the models are largely a reflection of the participation rates across the models.
- Average losses borne by insured households range from about $200 million to $325 million, with the Flat Cap High-Risk pool model and Public Reinsurer at the lower end and the Public Insurer at the higher end. The range for average losses borne by uninsured households is much higher: Between about $200 million for the Public Insurer model to $1 billion for the Flat Cap High-Risk pool model, while the Tiered High-Risk Pool model and Public Reinsurer models were in-between at about $700 million and $600 million, respectively.
- When focusing on large catastrophic events, the difference between insured and non-insured is far more significant: Losses for a catastrophic event range from about $1 billion for the Flat Cap High-Risk pool model to about $5 billion for the Public Reinsurer model, with the Tiered High-Risk pool and Public Insurer models at about $2 billion. Losses borne by uninsured households for a catastrophic event, however, total about $12 billion for the Flat Cap High Risk pool model and decreases substantially as participation rates are increased across the models. The Tiered High Risk Pool model has uninsured homeowners bearing about $6 billion in losses, while both for the Public Insurer and Reinsurer model have the lowest uninsured costs for homeowners, each totaling about $1.6 billion for catastrophic events.
Losses assumed by high-risk household, $ millions |
||||
|---|---|---|---|---|
Average losses: total assumed by households |
Catastrophic event losses: total assumed by households |
|||
Model |
Insured |
Uninsured |
Insured |
Uninsured |
Flat cap high-risk pool |
$195 M |
$1,015 M |
$951 M |
11,983 M |
Tiered high-risk pool |
$236 M |
$719 M |
1,860 M |
8,082 M |
Public insurer |
$325 M |
$190 M |
2,556 M |
1,659 M |
Public reinsurer |
$195 M |
$624 M |
4,510 M |
1,659 M |
Government Backstop: Probability of Use and Value
Each model follows the same general curve regarding the probability of use of the backstop itself. Initial capital invested and accumulation of reserves reduce the probability of drawing down the backstop over time. In the initial years, and while there are less funds accumulated, the probability of having to use the backstop is higher than in future years. There is a sharp decline around the 10-year mark. At this time, the probability of drawing on the backstop if it has not already occurred is approximately 7%. The additional capital at this point may be released to fund risk reduction measures.
Figure 14: Probability of the backstop

Image description
- Shows a graph of the probability of needing to use the backstop for all models, which decreases as time increases.
- All models follow the same general curve starting out at about 16% in the early years of a program, with a sharp decline around the 10-year mark. At this time, the probably of drawing on the backstop, if it has not already occurred, is approximately 7% and decreases thereon.
Probability of drawing down the backstop over time |
||||||
|---|---|---|---|---|---|---|
Model |
1-5 years |
6-10 years |
11-15 years |
16-20 years |
21-25 years |
All years (1-25 years) |
Flat cap high-risk pool |
15% |
7% |
3% |
2% |
1% |
25% |
Tiered high-risk pool |
15% |
7% |
4% |
3% |
1% |
25% |
Public insurer |
16% |
8% |
5% |
4% |
2% |
29% |
Public reinsurer |
15% |
7.5% |
4.5% |
3.5% |
1.5% |
27% |
Average (1 to 25 years) |
|---|
25% Flat Cap High-Risk Pool |
25% Tiered High-Risk Pool |
29% Public Insurer |
27% Public Reinsurer |
In all models, the value of the backstop required is directly proportional to the level of participation and coverage and is calculated at a level so as to support the potential risk that may occur in the initial years of the program. In reality, the potential value of the backstop may be reduced over time, but is path-dependent on the series and scale of events in the early years of an arrangement. Within the analysis, the investment was drawn down given probability assumptions although accumulation of investment income was not calculated. This particular consideration is notable when thinking about the relationship between the model and reality and clarifies that any model is more susceptible to risk at the outset. In the event of an accumulation of funds, the surplus may be used to enhance stability and promote risk reduction or to reduce the premium cost. For the Flat Cap High-Risk Pool, the value is relatively low given that participation is lowest across the arrangements. For the Public Reinsurer arrangement, only the second layer is subject to the backstop.
Figure 15: Average value of the backstop, $ millions

Image description
- Shows the average value of a backstop, if required, over the course of 25 years.
- The value of the backstop required is directly proportional to the level of participation and coverage and is calculated at a level so as to support the potential risk that may occur in the initial years of the program.
- For the Flat Cap High-Risk Pool, the value is relatively low (about $4.2 billion) given that participation is lowest across the arrangements. For the Public Reinsurer arrangement, only the second layer is subject to the backstop, and with a high participation rate, the value is relatively high (about $10.8 billion).
Average value of the backstop, $ millions |
||||||
|---|---|---|---|---|---|---|
Model |
1-5 years |
6-10 years |
11-15 years |
16-20 years |
21-25 years |
All years (1-25 years) |
Flat cap high-risk pool |
$4,228 M |
$4,398 M |
$4,089 M |
$4,213 M |
$4,047 M |
$4,238 M |
Tiered high-risk pool |
$5,226 M |
$5,467 M |
$5,105 M |
$5,079 M |
$5,112 M |
$5,243 M |
Public insurer |
$10,972 M |
$10,493 M |
$10,725 M |
$10,209 M |
$11,001 M |
$10,786 M |
Public reinsurer |
$6,920 M |
$6,667 M |
$6,809 M |
$6,910 M |
$7,082 M |
$6,849 M |
Average (1 to 25 years) |
|---|
$4,238 Flat Cap High-Risk Pool |
$5,243 Tiered High-Risk Pool |
$10,786 Public Insurer |
$6,849 Public Reinsurer |
Summary of Results
In conclusion, while the Flat Cap and Tiered High-Risk pool models require less funding from all sources there remains a significant amount of residual risk. If a large-scale flood occurs, many homeowners will be at risk, with governments facing significant pressure to provide relief. Evident as well is the cost associated with the Public Insurer model. This plan is most costly to governments in absolute terms; however, on a cost per-capita basis for high-risk households, it performs well according to costing metrics. Layered insurance provides flexibility to homeowners in its purchase offer, and provides strong risk reduction incentives to homeowners. This model requires reduced funding to support the arrangement while retaining a high level of coverage for major and catastrophic events.
6.5 The Effect of Risk Reduction
The cost of flood risk will increase over time
The costs of providing flood insurance for all Canadians, based on 2020 figures, are very significant and will grow faster than inflation and gross domestic product in the future. This is because inflation on re/construction costs is typically larger than inflation on common goods and services, and climate change and population growth in the floodplains will put increasing pressure on any risk-sharing plan. It is important to note that inflation on re/construction was historically about 3-4% on an annual basis over the last 30 years, whereas it currently sits at 6-7%Footnote 73. While we do not know exactly by how much flood losses will increase in Canada due to climate change, we can extrapolate from studies in the US which indicate that climate change will increase the frequency and severity of flooding by approximately 0.5-1% on an annual basis. Finally, if significant changes are not made fairly immediately to building codes and land-use planning, and if population grows at the same pace in the floodplains as outside the floodplains (1% per year), which has been the case over the last 30 years, then the accumulated effect is an average growth rate of losses of 5-6% per year. Such a growth rate is unsustainable and Canada must make risk reduction a top priority.
De-risking of the insurance arrangement will be required
One strategy to de-risk the insurance arrangement is to restrict eligibility for the highest-risk homeowners, however this would leave many homeowners unprotected and could require significant government spending in the event of catastrophic flooding. The insurance models were therefore designed to include all high-risk properties, and do not factor any risk reduction measures into their costing. This approach ensures that all households are able to obtain flood insurance in the near term, while efforts would be made to de-risk the insurance arrangement over time.
Risk reduction efforts, whether through strategic relocation or other mitigation measures, should target the riskiest properties. The AAL represented by the top 1%, 0.5% and 0.1% of the riskiest homes are shown in Table 7. First, de-risking significantly reduces the cost of affordability measures targeted to those at high risk. Actuarial analyses indicated that de-risking and/or relocating about 77,000 homes (the 0.5% more risky properties) would decrease the annual costs of caps and subsidies by more than 50% to the FPT governments. Moreover, relocating risky households also means avoiding the expected future sharp increases in losses due to inflation on re/construction and climate change.
Proportion of Properties Removed from the Arrangement |
Top 1% |
Top 0.5% |
Top 0.1% |
|---|---|---|---|
Number of households affected by de-risking |
154,113 |
77,057 |
15,412 |
AAL removed by re-risking ($M) |
1,010.9 |
637.3 |
193.8 |
AAL removed as a percentage of the total AAL |
34.1% |
21.5% |
6.5% |
All options for risk reduction need to be on the table
Given the extent of the flood risk across the country, rapid de-risking is critical. All possible risk reduction tools will need to be employed. A concerted and coordinated risk reduction effort requires measures that both reduce the risk associated with existing buildings and prevent the construction of new buildings in flood-prone areas. Risk reduction efforts must also be underpinned by an accelerated push to identify areas of highest flood risk and scale-up the implementation of mitigation measures by homeowners, communities and at all levels of government.
As of 2020, the average reconstruction cost for a residential structure in Canada (contents excluded) is $405,000. Taken together with additional living expenses and estimated transaction costs, the reconstruction costs represent approximately 50% of the total relocation estimate. For households that are relocated following a catastrophic event, additional expenses for contents would also be factored into the gross relocation estimates.
7. Discussion
The four models shown above provided the opportunity to showcase the relative strengths and weaknesses of different approaches, but are not intended to indicate the exact costs, thresholds, and combination of parameters that would necessarily be applied in implementation. That said, the results of this work have yielded valuable information to inform the development of a high-risk flood insurance solution for Canada.
This section refocuses the results and analysis generated above within the framework of the Task Force's previously stated Public Policy Objectives. Drawing on the findings from the actuarial results, as well as information described in other sections of this Report, this discussion will highlight what the Task Force has learned for each of the policy objectives and how those findings shape the viability of the four models.
An evaluation system has been applied to help give clarity to the discussion. These are qualitative assessments based on the findings of the Task Force. The assessments are:
Strong performance relative to the Policy Objective
Average performance relative to the Policy Objective
Weak performance relative to the Policy Objective
7.1 Adequacy and Predictability of Compensation
The purpose of this policy objective is to ensure that the insurance being offered and provided for Canadians is sufficient to cover their actual risk, and that Canadians can better understand, predict, and count on the kind of financial compensation they receive when experiencing a flood.
What the Task Force learned
Adequacy matters
It is not enough to know how many Canadians have flood insurance, but, additionally, whether coverage is sufficient for their expected losses. Currently, in some PTs, people may have some flood coverage, but might still rely on government assistance for larger events. Across all risk levels, it is vital to ensure that 'having flood insurance' means having enough flood insurance.
Coverage needs to be clear
Standardized policy language, including on coverage types, can help simplify policies and empower consumers who have a rich array of linguistic backgrounds, or who may have diverse levels of financial/legal literacy. Comprehensive flood insurance that covers all water infiltration (e.g., overland flooding, seepage, sewer back-up) could help make insurance policies more clear both pre- and post-event, by alleviating ambiguity and complexity around coverage amounts or responsibility for flooding based on its source and cause. Given that some high-risk areas tend to include higher than average proportions of people with lower incomes, Indigenous peoples, elderly residents, people with physical or mental disabilities, and people living alone, clear policy language can help to ensure adequate coverage for diverse populations.
Post-disaster is not the ideal time to find out what insurance coverage includes
Coverage and exclusions should be clear so Canadians can understand and prepare for the risks they assume on their own. Comprehensive flood coverage can greatly reduce the post-disaster stress and mental anguish that are often worsened by confusing, overlapping, and, sometimes, inadequate private and public compensation mechanisms.
What this means for the four models
Flat Cap High-Risk Pool – Evaluation Average
The optional purchase of insurance in this model allows consumers to choose the risks for which they are willing to self-insure, at the potential expense of ensuring adequate coverage. For high-risk homeowners, easy to understand standardized coverage helps to meet this policy objective, but only for those who choose to insure. For low and medium risk homeowners, varying policy structures (e.g. limits, exclusions, lack of comprehensive bundling, etc.) and optionality reduces the potential for broad adequacy. Some homeowners may choose coverage that is inadequate for their level of risk, or may choose none at all.
Tiered High-Risk Pool – Evaluation Average
Mandatory take-up of flood insurance for mortgage-holders is introduced in this model and necessarily increases the need for greater standardization of policy language, coverage types (through comprehensive flood coverage bundling), and coverage amounts. This increases the level of adequacy for those who purchase coverage. For those not a part of the arrangement, coverage adequacy may still be highly variable.
Public Insurer – Evaluation Strong
A public insurer could ensure clear, consistent, and standardized policy language and flood coverage to all homeowners at all levels of risk. A minimum level of adequacy could be provided for all policyholders up to the coverage cap. Comprehensive bundled flood coverage removes ambiguity for water-related perils and is particularly important for reducing financial uncertainty and mental-health impacts post disaster, though there would be less choice for consumers to accept risks they are willing to self-insure on.
Layered Public Reinsurer – Evaluation Strong
Mandatory take-up at higher loss levels (in Layer 2) would ensure that homeowners are sufficiently insured for major flood events, and standardized policy language and coverage types increases adequacy for all homeowners. Optional coverage in Layer 1 provides choice for homeowners on whether to self-insure up to the Layer 1 limit, but would be subject to the same variable adequacy expected in the Flat Cap High-Risk Pool.
7.2 Risk Reduction
This policy objective is intended to help change behaviours, promote risk-appropriate land use, and maximize risk reduction at all levels using the levers available through insurance arrangements.
What the Task Force learned
Insurance alone is not likely to substantially reduce risk.
Analysis shows that price signals through risk-based premiums are important for people to appreciate their risk, and can incentivize some mitigation; the impact of such actions, however, is unlikely to be significant at the aggregate level due to high up-front costs for homeowners. To affect more significant change it is necessary to mobilize governments and communities to improve risk-informed decision-making and target substantial investments in flood mitigation.
Willingness to undertake risk reduction comes down to 'skin in the game'.
The likelihood that individuals will seek ways to reduce their flood risk depends on the level of awareness of the risks, premium price, deductible, capacity to pay, and extent to which premiums reflect risk. Individual risk reduction behaviour can be incentivized if the costs of premiums and deductibles are explicitly linked to mitigation actions; in other words, if risk reduction is rewarded at the consumer level. Property-level protections can be further incentivized with increased use of public education tools and financial incentives, however, such protections are only effective to a point. On a larger scale, the extent to which governments bear the costs for premium caps and affordability subsidies provides incentive to invest more in mitigation and better land-use practices. Community level mitigation can have a greater impact on reducing overall flood risk, and is fundamental to achieving the risk reduction levels necessary to address climate change over time.
In all models
Community-level mitigation could be further incentivized through linking insurance with the development of a community rating system that could reward communities that adopt flood resilient land-use planning rules and invest in mitigation.
What this means for the four models
Flat Cap High-Risk Pool – Evaluation Average
With a single low premium cap for high-risk properties, the price signal to incentivize property-level mitigation is smaller than the other models. While a low cap will encourage higher take-up amongst high-risk homeowners than would otherwise happen with optional purchase, the incentive to mitigate risk in exchange for a lowered premium may be muted, or homeowners may not choose to make improvements, instead feeling financially protected. On the other hand, high costs to governments in this model create incentive for community-level investments in mitigation and improved public policy choices.
Tiered High-Risk Pool – Evaluation Average
Incorporating progressive premium caps, particularly at the high end, can improve the risk-informed price signal received by homeowners to better incentivize property-level risk reduction than the Flat Cap High-Risk Pool. This price signal is also stronger than the Public models because it does not incorporate additional income-based subsidies.
Public Insurer – Evaluation Average
The single and relatively high cap included in this model provides for a relatively strong price signal to incentivize risk reduction at the property level, although for some households, it may be reduced due to the incorporated income-based subsidies. A public insurer model may also be in an advantageous position to pass along premium discounts from property-level mitigation efforts, and can ensure alignment with broader public mitigation programming. The high annual costs of government subsidies provides incentive for government to invest strategically in community/regional mitigation efforts, and such investments would also reduce the likelihood of having to provide a backstop due to catastrophic losses over time.
Layered Public Reinsurer – Evaluation Strong
This model offers a balance for incentivizing both homeowner and government investment in mitigation. Homeowners are responsible for covering losses in Layer 1, either through unsubsidized insurance or self-insurance, providing an incentive for those at high risk to invest in property-level protections that can be quite effective at mitigating smaller but potentially frequent losses. In providing insurance for Layer 2, government responsibility for larger-scale and catastrophic losses incentivizes strategic investment in community/watershed level risk reduction.
7.3 Affordability
To meet this policy objective, insurance models must consider two components of affordability. For households with little or no disposable income, who struggle to meet their most basic needs of food and shelter, a flood insurance premium may be unaffordable at almost any price. For households with more economic security and disposable income, affordability has a subjective element, and especially because, for many people, this could be a new cost. Willingness to pay will depend on a variety of social, economic, historical, cultural, and behavioural factors.
What the Task Force learned
Defining an affordability threshold is incredibly complex.
Determining one set price point oversimplifies people's ability to pay; their relative risk, income, and housing costs; the type of coverage sought, and; the regional differences across Canada. For this reason, the Task Force examined different methods including premium caps and means-tested subsidies. Caps are effective at keeping costs reasonable for the majority, and when applied at different levels for different home values, they can aim support towards more vulnerable households, though the method is imprecise. Means-tested subsidies that consider income and/or wealth can better target assistance to economically-vulnerable households on a sliding scale, including adjusting for regional differences, but this could be more challenging to implement effectively, and may be less transparent overall.
Investments in affordable insurance protect Canadians better than the status quo.
Ensuring that insurance remains affordable could cost in the range of $1 billion for FPT governments collectively, though the exact amount and how it is targeted can be adjusted. Although this amount is comparable to the costs governments could expect to pay for the estimated flood risk in Canada under the current system of recovery programming, insurance-based programs can provide better and broader protection for Canadians that improve recovery outcomes and move towards better aligning responsibility for risks. Over the lifespan of an insurance arrangement, affordability supports would be designed with a paced withdrawal, to sensitize people gradually to the risk-based prices that will eventually be charged, and provide time for risk reduction actions to be undertaken at the individual, community, and regional levels.
Affordability is critical for program equity.
The Task Force's analysis shows that compared to lower risk areas, there is more social vulnerability in high-risk areas. In the North and in many off-reserve Indigenous communities, housing affordability and lower income levels remain persistent issues. It is critical that an insurance solution avoids exacerbating the challenges already faced by vulnerable groups across Canada. From an equity perspective, consideration is also warranted for how secondary or vacation properties are treated with respect to affordability measures.
What this means for the four models
Flat Cap High-Risk Pool – Evaluation Strong
The single low premium cap in this model provides for generally highly affordable insurance in high-risk areas, reducing the need for income-based subsidies. However, this model also creates a regressive approach where wealthy homeowners, and those with the highest expected property losses benefit from a significant price discount subsidized by governments, while low-income Canadians may still struggle with affordability of premiums, even with the relatively low price cap.
Tiered High-Risk Pool – Evaluation Average
Recognizing that home value (e.g., tax-assessed value; estimated reconstruction costs) is not a perfect proxy for household wealth or ability to pay, employing a range of premium caps tied to the intersection of risk and home value can still be a reasonable alternative to both a single low cap and income-based subsidies, to provide an affordability mechanism in high-risk areas. While this affordability method may be easier to implement than a means-tested approach, it may not target subsidies where they may be needed most: those with the least capacity to pay, regardless of the type of home they live in, or their neighbourhood.
Public Insurer – Evaluation Strong
The combination of a single higher premium cap to reduce the most excessive costs, and means-tested subsidies helps provide a balanced approach to affordability. The cap in this model applies to the highest risk properties, and others in high-risk areas will see high premiums attenuated by subsidies on means-tested basis.
Layered Public Reinsurer – Evaluation Average
Although Layer 2 has the same premium cap as the Public Insurer model, premiums for any given homeowners are lower in Layer 2 due to the removal of the Layer 1 risks. Competitive reinsurance rates provided by the public reinsurer to private primary insurers to cover Layer 2 also help to lower these otherwise risk-based premiums, and income subsidies help reduce costs for low-income households. The balance for this collective enhanced affordability in Layer 2 is that households are responsible for flooding losses up to the Layer 1 coverage cap. Private insurance can be purchased for Layer 1, and while the costs for this can be high for high-risk homeowners, affordability measures would not be provided in order to better incentivize property-level risk reduction.
7.4 Availability
This policy objective was created to ensure that insurance coverage is available for all types of flood risk (fluvial, pluvial, coastal) and all levels of risk (high, medium, low), in all regions of Canada, and that barriers to accessing insurance for homeowners are removed or reduced.
What the Task Force learned
Insurance is not uniformly available in Canada, even for low/medium risk areas.
In parts of Canada's North, in some off-reserve Indigenous communities, and for certain kinds of risk, insurance may be difficult or impossible to acquire.
After a flooding event, insurance can be more difficult to obtain, even with the same theoretical level of risk.
Models that rely on the private market to provide insurance need to consider how to ensure coverage remains available even after a flood.
What this means for the four models
All Models – Evaluation Strong
The two high-risk pool models, and Layer 1 of the Public Reinsurance model, have assumed it would be compulsory for all companies offering home insurance to offer protection across all flood hazards, and in all geographic regions in which they operate. The Public Insurer and Layer 2 of the Public Reinsurer both include mandatory offer and mandatory purchase with home insurance, and would leverage the reach of the private insurance market to be the customer-facing entities that collect premiums, pay claims, and service policies. Challenges may persist in all models, however, for regions where there is a limited presence of insurance companies (northern, remote, and/or some Indigenous communities), or in places where a residential insurance solution may not be suitable or applicable due to different forms of home ownership or other factors. In addition, the possibility that some insurers may choose to leave certain markets or regions should be acknowledged as a risk.
7.5 Participation
This policy objective aims to ensure that participation in a flood insurance arrangement is maximized, reducing the number of people who are underinsured, or uninsured. Under the assumption that FPT DFA programs have been withdrawn for residential flood risk, lower participation (or take-up) results in greater residual risk shouldered by homeowners. The financial impacts are particularly striking when a catastrophic event occurs, especially in high-risk regions. Interventions to increase participation can be applied to both the offer and take-up of insurance, which are currently both voluntary in the existing flood insurance market.
What the Task Force learned
Current take-up of flood insurance is low
It is estimated that 40 to 60% of Canadian homeowners have purchased some amount of coverage for flood damage, though this uptake is concentrated almost exclusively in low/medium risk areas. While those with negligible risk may feel they have made an informed decision on whether or not to purchase insurance, others may find they do not have, or cannot purchase coverage adequate to cover larger flood losses. Generally speaking, homeowners in high-risk areas are unlikely to be offered coverage by insurers, and, if available, the cost is likely to be prohibitive. As a consequence, participation is low compared to other international jurisdictions in the OECD with different requirements for both offer and purchase.
Mandatory offer of flood insurance is required
Findings from a wide variety of sources including academic and industry experts, policy reviews, and lessons learned from the international community, demonstrate that the mandatory offer of flood insurance by insurers is a fundamental requirement for the success of any flood insurance arrangement in Canada. Market penetration beyond the current take-up would not be possible without a mandatory offer.
Mandatory purchase is the best way to protect the most people
To significantly reduce overall residual risk, participation in high-risk areas needs to be targeted. This is most easily done via mandatory or quasi-mandatory levers such as bundling with other perils, automatic inclusion with home insurance, or through mortgage requirements, among other options. These regulatory and non-regulatory approaches should be carefully considered for their feasibility and their impacts (i.e., using mortgage requirements may exclude seniors, who more often own their homes outright).
If insurance is not mandated, there are still tools in the toolbox
Increased risk awareness and the application of behavioural insights and choice architecture can be employed to nudge participation rates up. Public education on risk and on the options and compensation available will be a key step in the implementation of any model.
What this means for the four models
With enhanced public awareness of property-level flood risk, the expanded availability of insurance within high-risk areas, and withdrawal of FPT DFA programs, all models are expected to raise participation rates above what we currently observe in the insurance market.
Flat Cap High-Risk Pool – Evaluation Weak
The use of a single low cap in this model is the main driver of participation in high-risk areas, and those at highest risk are likely to be attracted by the relatively low costs of coverage. The optionality of coverage, however, is still likely to leave a substantial amount of residual risk to be absorbed by homeowners, compared to other models. This model prioritizes consumer choice, though it could also be constructed with other policy tools or nudge options to help increase participation should such features be operationally feasible and desirable.
Tiered High-Risk Pool – Evaluation Average
The mandatory purchase provision for those with a mortgage in this model would increase participation across the risk spectrum relative to the Flat Cap High-Risk Pool model. There is a significant decrease in the residual risk borne by high-risk homeowners as mortgage requirements help to concentrate added participation in this group.
Public Insurer – Evaluation Strong
Mandatory bundling of flood insurance with home policies in this model achieves near complete levels of participation across all risk levels. The residual risk that remains is the lowest of all the models, and consists of damage that occurs above the coverage cap, the cost of deductibles, and those who choose not to purchase any home insurance at all.
Layered Public Reinsurer – Evaluation Strong
Participation rates in Layer 2, for larger-scale losses achieve the same participation rates as the Public Insurer, due to the same mandatory bundling with home policies. In Layer 1, participation is more in line with the pool models. Because of this, overall residual risk in this model lands between the Tiered High-Risk Pool and Public Insurer.
7.6 Value for Money
This policy objective is intended to maximize the efficiency of public funds, and ensure effective and equitable outcomes for Canadians. By shifting expenditures from recovery to pre-event risk transfer and mitigation, governments can expect more predictable fiscal liabilities, better return on investment, and a gradual shift of financial liabilities to those who choose to bear risk instead of being shouldered across all Canadian taxpayers.
What the Task Force learned
Assessing value for money will require more extensive investigation
Research that evaluates the governance of flood insurance (i.e., the roles and responsibilities of different stakeholders, including the value and clear triggers of a government backstop) should be prioritized to better understand cost-benefits, and financial sustainability.
A government backstop can reduce how much risk insurance needs to cover, but at a cost
The government is currently serving as the de facto backstop for all uninsured losses. Among the models studied, the more risk that is assumed by a government backstop, the more affordable insurance becomes for all stakeholders on an annual basis, but governments must be prepared to shoulder larger costs when a catastrophic event occurs. Conversely, employing a smaller backstop requires more annual funding; however, it also offers the advantage of fiscal predictability for governments.
Government intervention in flood risk management should be clear and predictable
To maximize value for taxpayers, government investments in mitigation should target the highest-risk areas. A risk-based approach, as well as one that aims to help address systemic -inequalities, can deliver a stronger return-on-investment compared to competitive funding programs that tend to benefit communities with higher capacity to participate in flood risk management. Funding should be provided predictably over long time horizons, such that stakeholders can benefit from stability and plan complex risk reduction endeavours such as relocation, which is inherently a long-term process. Erratic or frequent government interventions, including providing ad-hoc disaster relief, undermines the incentives for risk reduction and the system of risk transfer, penalizing those who made the decision to purchase insurance.
What this means for the four models
Taxpayers currently fund disaster recovery (i.e., DFA programs), which acts as 'last resort' financial assistance and provides little motivation for individual and community risk reduction. The models examined all shift some costs to homeowners through predictable annual premiums, and all of them provide more predictable fiscal expenditures for governments than exist currently, particularly under mature conditions (i.e., sufficient reserves are built up to reduce the probability for the need of a backstop). The amount of risk absorbed by a government backstop can help to lower costs for homeowners and governments on an annual basis, but this requires more flexibility on the part of government to shoulder a larger burden when one, or a set of, catastrophic events occurs. Models that involve more public intervention naturally bring higher costs for governments, though outcomes for Canadians are also likely to improve with reduced residual risk and resulting protection gap. In addition, value for money in all models is driven by having a finite lifespan of 25 years, which helps to drive risk reduction as a transition is made to risk-based pricing.
Flat Cap High-Risk Pool – Evaluation Weak
This option requires a significant amount of government funding in order to provide affordable coverage, though only a portion of high-risk homeowners are likely to be covered. This results in the highest level of residual risk among the models. With a significant number of homeowners choosing not to purchase optional insurance, there may be added pressure on governments to provide ad-hoc relief when significant events occur and FPT DFA programs are no longer in place for residential flooding. Over time, with strong public awareness efforts and perhaps influenced by flooding events where DFA is not made available, participation rates could be expected to rise.
Tiered High-Risk Pool – Evaluation Average
Due to its mandatory take-up provision for those with a mortgage and its tiered premium cap feature, this model strikes a balance between government funding relative to residual risk remaining; The residual risk is, however, concentrated in high-risk areas. As uninsured losses could be substantial for some homeowners, a similar risk of ad-hoc relief exists as in the Flat Cap High-Risk Pool.
Public Insurer – Evaluation Strong
This model has the lowest overall residual risk of the four models, meaning that Canadians across all risk levels are well protected from flooding events; however, this comes at higher cost to governments. Annual fiscal liabilities for both homeowners and governments to achieve comprehensive protection are high on an absolute basis, but more economical on the basis of costs per covered high-risk homeowner. Costs are also predictable. Over the 25 year lifespan of an arrangement, this model would bring all homeowners along on the transition to risk-based pricing, incentivizing and rewarding mitigation efforts.
Layered Public Reinsurer – Evaluation Strong
This model strikes a compromise of government funding relative to residual risk, though the residual risk exists mostly for lower cost events, meaning that for those impacted by uninsured losses, the losses are likely to be smaller in scale. The use of government funds is focused on protecting people from significant flood events, rather than covering all flood losses. Over the lifespan of the model, the early presence of risk-based pricing in Layer 1 could help to gradually sensitize Canadians to the eventual risk-based pricing of Layer 2 as well.
7.7 Summary of Discussion Results
Policy Objective |
Flat Cap High-Risk Pool |
Tiered High-risk Pool |
Public Insurer |
Public Reinsurer |
|---|---|---|---|---|
Adequacy/Predictability of Compensation |
Average |
Average |
Strong |
Strong |
Risk Reduction |
Average |
Average |
Average |
Strong |
Affordability |
Strong |
Average |
Strong |
Average |
Availability |
Strong |
Strong |
Strong |
Strong |
Participation |
Weak |
Average |
Strong |
Strong |
Value for Money |
Weak |
Average |
Strong |
Strong |
8. Key Findings
The work of the Task Force covered research on understanding Canada's risk landscape, analyzing social vulnerability in areas of high flood risk, examining models for flood insurance, and exploring how relocation can help to reduce risk. Key findings are summarized here:
8.1 Current Flood Risk
- Total residential flood risk in Canada is estimated at $2.9billion per year
Markedly higher than previous estimates, this amount includes the effects of larger 'tail risk' events and reflects more accurate estimations of a number of residences and predicted damages (based on 2020 data). - The vast majority of risk is concentrated in a small number of the highest risk homes
Of the $2.9 billion, 89.3% is concentrated in the top 10% highest risk homes. 34.1% is concentrated in the top 1% of highest risk homes.
8.2 Insurance Considerations
- Some standardization is needed in the market
Moving towards clear and standardized language in flood insurance reduces confusion about coverage and allows for a more informed choice for homeowners. Making flood coverage more comprehensive and seamless through bundling of flood insurance products is likely to streamline the claim process, improving both financial and mental health outcomes post-flood. Furthermore, ensuring that Canadians are not left underinsured for their risk is an important consideration for the design of any insurance model. - Participation is key
A carefully designed flood insurance solution can ensure better protection for Canadians, help to share the costs more broadly, and provide incentive for risk reduction. However if such a solution is to replace government financial assistance for residential flood risk, maximizing participation in the insurance arrangement through affordability measures, incentives and/or mandates, is critical to protecting Canadians. Without these interventions, barriers to insurance will remain, leaving more risk on vulnerable Canadians and people living in high-risk areas. - Greater public intervention can more fully close protection gaps, but at a cost
Costs paid by governments are aimed at achieving higher participation rates and increasing affordability. These costs viewed in isolation may seem high, but they must be compared with the alternative scenario: the costs otherwise fall to public DFA programs or on the shoulders of un- or under-insured homeowners. There is no scenario in which these costs disappear without significant investments to remove, or reduce, the risk.
8.3 Relocation Considerations
- Relocation can be a powerful risk reduction tool
Relocating the highest risk and repetitive loss properties removes risk rather than transferring or mitigating it, and can be very impactful in improving overall viability and lowering the costs of insurance options. At the same time, the practicality of relocation in areas already experiencing a shortage of available and affordable housing necessitates considerations for in-place mitigation measures. - Relocation must be informed at the community level
Despite the clear risk reduction benefits, relocation is highly complex, and can have major impacts on households and communities. The decision is especially significant for Indigenous communities with strong ties to their ancestral, traditional land. It is important that engagement on how to apply relocation happens early - between jurisdictions and with communities - and offers communities and impacted residents the opportunity to provide input, increasing their sense of agency and trust in the process.
8.4 Equity Considerations
- Affordability of flood insurance premiums is key to enabling equitable access
Without supports for socio-economically disadvantaged groups, any program where insurance is optional will likely exacerbate their exclusion and marginalization. For mandatory insurance models, consideration must be given to individuals and communities for whom insurance may not be an appropriate solution (e.g., due to differing home/land ownership arrangements, or for those living in significant poverty). Moreover, targeting affordability measures where needed most can be complex, and considerations of feasibility should factor into model design. - Pathways to accessing insurance are about more than just money
Considerable effort is needed to remove barriers and support access to insurance, which includes promoting greater financial literacy around insurance, building capacity within community organizations that support housing for vulnerable populations, and ensuring a national-level solution can adapt to regional or cultural contextsFootnote 74. The realities for many Indigenous and Northern communities also call for balance and cohesion with related initiatives on housing, poverty, and health. Policies should strive to more broadly reduce the impacts to those most vulnerable to the effects of flooding. - The cultural connections of Indigenous peoples to water and land must be respected
Indigenous knowledge, culture and perspectives on the natural world must be respected, and should be recognized as foundational in informing how all stakeholders can approach flood risk management across Canada. Further engagement with and learning from Indigenous communities, governments, organizations and individuals, including in the form of healing and sharing circles, would help to ensure that FRM initiatives are informed by Indigenous voices.
9. Conclusion and Way Forward
Canada is flooding more often, more severely, and with growing social, environmental, and economic impacts. Flood-related disaster costs are at an all-time high and projected to keep rising, exacerbated by climate change and continued asset concentration in high-risk areas. It is a challenge that requires collaboration and commitment across organizational boundaries to reduce risk in systemic ways.
As an instrument of financial risk transfer, insurance can be a powerful tool in helping communities to recover after a flood, and can help share the costs normally borne by governments and taxpayers across a wider range of stakeholders. Risk-priced insurance also helps to incentivize more partners to undertake proactive mitigation. While the models presented in this paper outline several different ways an insurance arrangement could be constructed, the success of any will rely on a number of preconditions.
9.1 Preconditions for success
Risk awareness of Canadians must improve
Increasing the risk awareness and savvy of Canadians at key risk-decision milestones, such as when purchasing a home and purchasing/renewing home insurance policies, can empower better decision-making in managing flood risk. Informed consumer behaviour can also help influence land use planning. Although flood disclosures can temporarily marginally reduce property values in high risk areasFootnote 75, this is offset with the significant benefits of risk awareness, including increased property-level mitigation efforts, ensuring transparency for buyers and sellers, and keeping flood risk top-of-mind for homeowners. On the other hand, the actual occurrence of flooding significantly negatively impacts housing prices (8.2% decline) and the time to sell (20% longer) in the entire community, not just for impacted properties.Footnote 76
A range of risk awareness strategies, such as an online flood portal to provide open and accurate information on risk, are needed to inform decision-making by all levels of government, insurance companies, developers and builders, realtors, financial institutions, and homeowners. Such a tool could also be used to provide information on mitigation opportunities and government funding that may be available.
More and sustained investment in mitigation is required from all stakeholders
While insurance can provide security to individuals and governments for the cost of a flood disaster, mitigation efforts are required to reduce the overall risk that exists, as well as attenuate the actual lived impact of flood events, particularly in the context of a changing climate. Building on Canada's EM Strategy priority for increased focus on whole-of-society disaster prevention and mitigation, all stakeholders have a responsibility to reduce risk. Investments and incentives are important at all levels: property-level protections by homeowners, community and neighbourhood land-use and urban planning, regional watershed management, and national and sub-national support for relocation, risk reduction, and climate and disaster-resilient building codes. Stronger policy integration and program cohesion of these elements will increase the likelihood that insurance can be an effective tool to help protect Canadians.
For insurance models to work, a 'hand shake transition' with DFA programs is needed
Once an insurance program is launched, and the previous two preconditions are in place, recovery funding provided to residential properties for flooding through FPT DFA programs will need to cease in relatively short order to avoid undermining the insurance system. This is an important step towards aligning responsibilities for flood risk. A transition plan will be needed to avoid incentivizing any further development in such areas while an insurance option is phased in, such as excluding new builds or occupancy conversions in high-risk areas from insurance subsidies or premium price caps.
9.2 Additional Work
The next milestone in this work is to seek a decision on whether a high-risk flood insurance solution should be pursued for Canada and if so what type of model should be further examined. Following these decisions, there are a number of areas that will require additional analysis to support the eventual implementation of an insurance arrangement. The models outlined in this report were designed to showcase the relative strengths and weaknesses of different approaches, but were not intended to indicate the exact costs, parameters, and logistics that would be applied in implementation. That work, which would follow a future decision, would be informed in part by some of the components described below.
Iterative improvements to foundational data
The flood modelling in this project was more complete and higher resolution than in any previous FRM research. Both flood modelling and the actuarial analysis, however, faced some limitations based on information currently available in the time frame of this work. Further modelling and analysis that incorporate climate models, inflation rates, and more advanced social vulnerability data will help to understand the longitudinal risk that this program seeks to address.
Understanding implementation pathways
This report remained generally neutral to some of the precise tools and policy levers that could be applied to the proposed insurance arrangements, as the scope was limited to exploring the viability of possible options for Canada, and understanding the implicit trade-offs that exist. As governments move closer to implementing a particular option, financial and logistical considerations on how to operationalize a new insurance model will of course become increasingly important. Examples of such topics include: what kind of entity and governance might be responsible for managing the insurance arrangement; the precise cost-share breakdown amongst governments; the construct of financial elements such as backstops, capitalization, and investments; the possible legal, regulatory, or agreements that might be required to operate the arrangement; the application for social housing, purpose-built rental properties, or secondary residences; and the available modes and methods for how subsidies could best target households that need them and create equitable outcomes for vulnerable or marginalized Canadians.
Defining objectives for the lifespan of the insurance arrangement
Any insurance option would ideally be designed with a lifespan of approximately 25 years to allow time for mitigation and risk reduction, before the transition would be made to full risk-based pricing. Precise objectives and criteria would need to be set for the end of the arrangement (e.g., target reductions in overall risk in Canada), as well as planned changes that occur in different phases (e.g., stepped reductions in subsidies, lifting of premium caps, or transitioning to alternate funding mechanisms). This will provide all stakeholders full awareness of changes that are coming, and allow homeowners and communities to plan for the future.
Considerations for a multi-peril approach
While the Task Force's work focused exclusively on residential flood risk, the analysis often found parallels and synergies with ongoing work related to wildfire and earthquake risk, as well as for other water-related perils such as tsunamis or landslides linked to flood events. While the nature of some of these risks contrast in different ways from that of flood, similar underlying issues exist with respect to underinsurance, unavailability of coverage, adverse selection of insurance in lower risk areas, and reliance on public recovery funding. In particular for wildfire, historically a staple component of home insurance, more stringent underwriting and risk mitigation requirements has already been observed in California and parts of western Canada in recent years, resulting in new challenges for consumers to acquire adequate coverage. Further analysis and design of any flood insurance arrangement should keep in mind the potential for expansion into other peril areas.
9.3 Way Forward
The Task Force has built on the collaborative framework that began with the interdisciplinary Advisory Council on Flooding in 2018 and this ongoing and unique partnership between public and private sectors has been a first of its kind for FRM in Canada. Within the Task Force, a wide range of stakeholders collaborated to better understand flood risk, developed concrete options based on international best practices, agreed upon policy objectives to guide the analysis, and undertook a comprehensive exploration of how insurance could better support Canadians in high-risk areas. This kind of collaboration will be a necessary and valuable component of future steps towards the common goal of reducing the impact of flood hazard for all Canadians.
It is clear that there are viable policy options to support flood insurance in high-risk areas. The facts presented in this report provide governments with the foundation needed to understand the different policy levers and important considerations that should be factored into decision-making, and to ensure that any future program effectively meets the defined policy objectives and best serves all Canadians impacted by flooding.
Canada has the benefit of following in the footsteps of other countries who have already established national flood insurance schemes and whose lessons and best practices are presented here alongside the analysis of the Canadian context. A clear lesson is that the first iteration of the Canadian program will require regular tweaks and adjustments early in implementation.
It is now up to government policy makers to use the evidence presented herein to inform their decision making processes, and develop a way forward for implementation, consultation, and negotiation. Above all, this will require coordination and commitment from each stakeholder to exercise their jurisdictional role in bringing an insurance solution to fruition. The collective challenge will be to not let the perfect be the enemy of the good, thereby preventing the implementation of a solution that could nonetheless be a dramatic improvement to the status quo for Canadians who remain at high risk and who continue to experience tremendous loss from ever-increasing flood events. A new approach to flood insurance will not solve all vulnerability to flooding. However, with a strong stakeholder commitment and decisive action, it could play an important role in empowering Canadians to adapt to flood risk, and building disaster resilience across our nation.
10. Annexes
10.1 Annex A – Task force diagram & list of member organisations
Task Force Secretariat |
|||
|---|---|---|---|
Principals Commitee |
PC-FTT |
PC-ITT |
PC-PTT |
Task Teams |
FTT |
ITT |
PTT |
Plenary Task Force |
PS CMHC ISC CIRNAC |
IBC Reinsurers Underwriters Brokers Others |
Alberta British Columbia Manitoba New Brunswick Newfoundland and Labrador Nova Scotia Northwest Territories Nunavut Ontario Prince Edward Island Quebec Saskatchewan Yukon |
Task Force's Principals Committee's list of members
Federal Task Team
- Trevor Bhupsingh, Assistant Deputy Minister, Emergency Management Programs branch, Public Safety Canada
- Steven Mennill, Chief Climate Officer, Canada Mortgage and Housing Corporation
Provincial and Territorial Task Team
- Dave Peterson, Assistant Deputy Minister, Community Disaster Recovery, Emergency Management BC
- Helen Collins, Director (A), Municipal Programs and Analytics Branch, Ministry of Municipal Affairs and Housing, Government of Ontario
Industry Task Team
- Jordan Brennan, Vice President, Policy Development, Insurance Bureau of Canada
- Amy Graham, Senior Market Underwriter, VP Americas, Swiss Reinsurance Company
Task Force Secretariat
- Stéphanie Durand (Project Lead), Director General, Policy and Outreach, Emergency Management Programs Branch, Public Safety Canada
Task Force's Federal Task Team's list of member organizations
- Public Safety Canada
- Canada Mortgage and Housing Corporation
- Crown-Indigenous Relations and Northern Affairs Canada
- Indigenous Services Canada
- Finance Canada - Observer-role only
Task Force's Provincial and Territorial Task Team's list of members
- British Columbia – Co-chair
- Ontario – Co-chair
- Alberta
- Manitoba
- New Brunswick
- Newfoundland and Labrador
- Northwest Territories
- Nova Scotia
- Prince Edward Island
- Québec
- Saskatchewan
Yukon and Nunavut were invited to join the Task Force but declined to participate. They were, however, consulted in some of the work conducted by the Task Force.
Task Force's Industry Task Team's list of members
- Aviva
- Canadian Association of Direct Relationship Insurers (CADRI)
- Canadian Association of Mutual Insurance Companies (CAMIC)
- Co-operators
- Desjardins
- Insurance Brokers Association of Canada (IBAC)
- Insurance Bureau of Canada (IBC)
- Intact Insurance
- Odyssey America Reinsurance Company (Canadian Branch)
- Swiss Re
- TD Insurance
- Travelers Insurance Company of Canada
10.2 Annex B – Best Practices for Strategic Relocation
Strategic relocation may take place before a significant flood occurs, based on the assessed level of risk (e.g., determined through flood hazard maps), or, only when a homeowner suffers significant material losses following a catastrophic flood. In addition to material losses, there are significant negative psychological effects that can impact the mental health of residents who experience a flood. As such, is it advantageous to consider relocation of high-risk households in advance of a flood event. At the household and community levels, however, strategic relocation can be highly disruptive. Economic and social equity implications must be carefully considered alongside the risk reduction benefits.
Over the past decade, municipal, provincial, and territorial governments in Canada have demonstrated an increased willingness to consider strategic relocation. Property buyout programs have primarily been ad hoc, developed by local or PT governments in the aftermath of a disaster. This reactive response has created considerable variability in how these programs have been designed, delivered, and funded.
It is important to note that strategic relocation is a tool to address risk at existing properties. Given the complexity of implementing property buyouts, it is critical flood risk reduction efforts be paired with improved land use planning practices to restrict new development in high-risk areas to ensure the need for relocation does not grow moving forward.
With mounting flood risk and changing flood patterns under climate change, the relocation of some neighbourhoods and communities will be inevitable. The risk to some households will become too great, and the ability to rebuild after disasters will become unfeasible. By starting the conversation about strategic relocation, and supporting these conversations with risk communication tools such as flood risk mapping, governments at all levels can begin to address how housing needs can be met in the context of a climate-impacted future.
Best practices for strategic relocation, developed through an assessment of past programs, can be categorized according to three key areas: design and practice, financial considerations, and public engagement.
Design and Practice
Canadian programs have varied in terms of their coerciveness, that is, the perceived degree of choice a homeowner has in whether to accept a buyout. Some programs maintained that the decision to participate was entirely voluntary, while others resorted to expropriation to acquire select properties. It is recommended that, when strategic relocation presents as the most feasible option, the coerciveness of the program be limited to the extent possible. There may be a role for mandatory buyouts, particularly in a climate-impacted future, but their use should be limited and justified by the severity of the flood risk. Furthermore, the timeline homeowners are given to make their decision should be appropriate and flexible to reflect the significance and weight of the decision that comes with leaving a home.
Best practices emphasize the role that clear and consistent messaging from officials has in building support for buyout programs. Frequent updates combined with opportunities for two-way discussion enhance public trust in the process. Yet, the human resource capacity needed to support such an effort cannot be underestimated. Previous programs have assigned designated case workers to homeowners, staffed temporary departments or hired external consulting firms to bolster their capacity to deliver buyouts.
Financial Considerations
The compensation offered to homeowners has also varied across Canadian programs, with some programs providing payments based on fair market value, tax assessed value, or a pre-determined capped limit. At the household level, compensation should also consider what would be required to purchase a comparable property, in a comparable neighbourhood, but in an area with less risk. Support for additional expenses such as moving costs and legal fees is also warranted, particularly for vulnerable groups such as low-income Canadians, to ensure that no one is made worse off as a result of a buyout.
Government funding to support buyout programs for flood risk reduction is fragmented; there is no constant source of funding for such programs in Canada. Though federal funding for relocation has been available on an individual program basis through the National Disaster Mitigation Program (NDMP) and through the Disaster Financial Assistance Arrangements (DFAA), most Canadian property buyouts program have been funded through a combination of municipal and PT funding. In order for strategic relocation to be employed proactively for disaster risk reduction and not just as a disaster recovery tool, funding for these programs must exist separate from reactionary arrangements such as the DFAA. Since municipalities must often turn to PT and federal governments for financial support to deliver property buyout programs, intergovernmental collaboration will be critical to develop and advance policy options for strategic relocation.
Public Engagement
Efforts to engage the public early in the planning process should offer residents the opportunity to provide meaningful input. Such collaboration helps to ensure transparency and build trust, and can contribute to overall flood risk awareness in the community. In some instances, discussions surrounding relocation could be focused on a longer time horizon, working with residents to co-develop FRM solutions for a climate-impacted future through collaborative, vision-setting exercises.
Insights from Behavioural Economics
Best practices emphasize that significant efforts should be directed towards communicating flood risk with the public, educating residents on their risk reduction options and involving them in community-level decision-making. Even if risk information is made available and accessible at the property level, however, there is no guarantee that homeowners will react in the perfectly rational way that may be expected of them by policymakers.
Behavioural economics is a field that studies how psychological factors can impact the economic decisions made by individuals. In the case of strategic relocation, it seeks to identify psychological barriers that would prevent an individual from accepting the offer of a buyout, despite the significance of their flood risk. By applying a behavioural lens, we can derive insight that can be applied to identify solutions for overcoming these barriers.
Strategies exist to counteract "status quo biases" that lead people to favour their current situation and to procrastinate on taking action, even if those actions might lead to improved future outcomes. Opt-in defaults are a powerful nudge towards a particular course of action, and while you wouldn't auto-enroll someone into a move, you could apply the nudge to informational campaigns that share information on the details of relocation with homeowners. Homeowners may not be interested in moving right away for a variety of reasons, but may consider it once a future condition is met. For example, a family may highly value their local school district, but would consider moving once their children have graduated high school. Working with households to develop implementation intentions could be a powerful tool to ensure that residents maintain a sense of agency, while accomplishing flood risk reduction in the long term.
During the property acquisition stage, the negotiation process should seek to leverage "elegant trades", identifying items that provide great value to homeowners and are relatively cheap and simple for the government to provide. One example is liquidity. Advanced cash payments or support such as bridge loans are extremely valuable to homeowners trying to purchase and move into a new home, and can be relatively inexpensive for government to provide.
It is important to note that much of the research on property buyout programs and the associated insight from behavioural economics is focused at the individual or household level, particularly in identifying what factors weigh into a homeowners' decision to accept the offer of a buyout. The broader economic, social and cultural impacts of relocation on a community, however, must also be considered. This is especially true for Indigenous communities who have historically been impacted by displacement from their traditional territories and who hold strong ties to their land. Important considerations for the implementation of flood risk reduction strategies for Indigenous communities is provided in Section 4 of the report.
10.3 Annex C – Flood Mapping methodology
Flood Hazard Assessment
In order inform flood risk and to estimate the flood hazard across the country, broad-coverage models were procured from three firms providing modelling and mapping products to the Canadian (and global) insurance markets: JBA Risk Management Limited, KatRisk, and Aon Impact Forecasting. Before proceeding with the modeled flood hazard data provided from each firm, an internal flood hazard assessment was conducted to better understand how these models perform against high-resolution engineered mapping conducted across Canada. Based on available data, each model was evaluated against hazard mapping that has been conducted across Canada by calculating metrics such as the spatial agreement, overprediction, and underprediction of the models as shown in Figure A. The purpose of this step was to understand the performance of these flood hazard models in predicting high-resolution flood hazard at varying flood probabilities and magnitudes.
Figure A: National fluvial flood hazard model

Image description
National fluvial flood hazard model (Canada Flood Map © JBA Risk Management Limited 2022) with site isolation to compare against local engineered mapping in Fort Macleod, AB (Northwest Hydraulic Consultants Ltd., shared by Province of Alberta, 2020). Other map data: Google, Imagery ©2022 CNES / Airbus, Landsat / Copernicus, Maxar Technologies, S. Alberta MD's and Counties; Statistics Canada (2017) provinces and territories boundary file
A map of Canada showing lakes and rivers, with a magnified area that illustrates how the fluvial hazard models perform against high-resolution engineered regulatory mapping across Canada. It shows where there was agreement, overprediction, and underprediction.
This analysis was conducted at 87 locations and used up to eight different return periods across the three models. Spatial agreement was measured by determining what proportion of the high-resolution flood hazard data was predicted by the vendor flood model, based on the same return period and flood mechanism. Underprediction and overprediction was measured by determining how much more area or less area was predicted within a study site compared to the high-resolution flood hazard area. Overall, the average spatial agreement was roughly 65% across all models, with roughly 50% overprediction and 35% underprediction. Through both quantitative assessment using the hazard assessment performance metrics, as well as manual site inspection, the overall model performance was deemed acceptable for the objective of the analysis.
Exposure Analysis
One of the major challenges national flood cost estimation is establishing a comprehensive database of residential properties. In order to develop this residential property layer, a variety of different building and address datasets were evaluated and used. The main input was the DMTI CanMap Address Point data, which provided high resolution point locations for residential addresses across Canada. Additional processing, cross-referencing and improvements were made to this data set using Public Safety Canada-implemented algorithms and modeling, as to combine knowledge from numerous datasets and reduce some uncertainty in the exposure data. These improvements were informed by integrating intelligence from other data sources, including Canadian Census data, Canada Mortgage and Housing Corporation data, Microsoft Building Footprints data, Open Street Map building data, and other Statistics Canada data.
In order to obtain more information about the residential structures, building attribute data was obtained from Opta Information Intelligence at the Statistics Canada dissemination block level (generally 20 – 30 properties), and was disaggregated to the residential address points. Building attribute data included factors such as structure replacement cost, presence of a basement, and other relevant information which informs value at risk and susceptibility to flooding. Overall, developing this comprehensive, high quality exposure data set for residential addresses was a highly complex task involving several quality control steps. This led to a final residential address dataset with 15.4 million address points and associated building attribute data. Though the housing landscape is dynamic, this is predicted to be one of the most comprehensive national residential datasets used in a Canadian national disaster project to date. This data was then situated within the various flood hazard and damage data procured by Public Safety Canada in order to estimate flood exposure, as seen in Figure B.
Figure B: Satellite overview of Brossard, Québec showing residential building location data

Image description
Satellite overview of Brossard, Québec showing residential building location data (CanMap Address Points, 2020 – DMTI Spatial ULC/LightBox ) and one of the flood hazard models showing the fluvial 100-year return period flood (Aon Impact Forecasting, 2020). Other map data: Google, Imagery ©2022 CNES / Airbus, Maxar Technologies
Two side-by-side satellite images of Brossard, Québec showing residential building location data on the left, and on the right, the same residential neighbourhood showing different depths of water at the fluvial 100-year return period flood using one of the flood hazard models.
Flood Damage Estimation
In addition to flood hazard data, JBA Risk Management Limited, KatRisk, and Aon Impact Forecasting each provided a damage estimation methodology for relating flood depths in their models to estimated flood losses to residential properties. Generally, this is performed by applying 'depth-damage functions', which are relationships between flood depths and expected percentage damage to residential structures. These relationships have been developed by each firm (and others) as a further application of their flood information to their primary clients: the insurance industry.
In addition to the damage estimation methods provided by JBA Risk Management Limited, KatRisk, and Aon Impact Forecasting, Public Safety worked with Fathom to develop and implement another set of depth-damage functions that were applied to the flood hazard data provided by JBA Risk Management Limited, KatRisk, and Aon Impact Forecasting as a consistent framework for estimating flood damages and control for differences between firm damage estimation models. This allowed Public Safety to generate a 'mini-ensemble' of flood damage estimates for almost every residential address in Canada (model coverage in the North was not fully consistent across vendors), therefore addressing some of the uncertainty with relying on one single estimate:
- JBA Flood Hazard Estimate + JBA Damage Estimate
- JBA Flood Hazard Estimate + Fathom Damage Estimate
- KatRisk Flood Hazard Estimate + KatRisk Damage Estimate
- KatRisk Flood Hazard Estimate + Fathom Damage Estimate
- Aon Flood Hazard Estimate + Aon Damage Estimate
- Aon Flood Hazard Estimate + Fathom Damage Estimate
The result of this approach was six estimates of average annual loss expected from flooding per residential address across Canada, with two estimates of average annual loss in the northern portions of Canada (due to model extent limitations from two vendors). This multi-estimate approach was used to account for uncertainty and model differences. The average damage across estimates for each residential address was calculated to provide a more robust understanding of the flood risk. A visual example of address points with the estimated average annual loss is provided in Figure C.
Figure C: Satellite overview showing average annual loss estimates at each residential address point

Image description
Satellite overview showing average annual loss estimates at each residential address point (CanMap Address Points, 2020 – DMTI Spatial ULC/LightBox) from fluvial, pluvial and storm surge flood mechanisms, and the relationship to one of the flood hazard models at the fluvial 500-year return period (KatRisk, 2021). A to E reflects increasing amounts of average annual loss. Other map data: Google, Imagery ©2022 CNES / Airbus, Landsat / Copernicus, Maxar Technologies, S. Alberta MD's and Counties
A visual example of address points shown on a satellite image of neighbourhoods beside a river. Address points are shown as small circles with different colours for different levels of average annual loss, and higher loss address points are generally closest to the river.
Overall, the methodology was designed to capture the key information required when evaluating national residential flood risk across Canada. Numerous datasets and resources were utilized throughout the analysis, while research and collaboration with experts helped to inform the overall flood risk estimation across Canada.
10.4 Annex D – Parametric Models
Model 5: Parametric Community-Based Insurance (PBCI) – private variation
This model involves municipalities negotiating parametric insurance coverage with an insurer with no additional government intervention. Parametric policies are paid out not on damage assessment, but pre-determined payments are instead triggered by defined event threshold (flood depths, for example). Payouts for individuals would be minimal, with homeowners having the option to purchase private insurance coverage above the cap (second layer of risk).
Model 6: Parametric Community-Based Insurance (PBCI) – public variation
The public version of the parametric model involves a federal government Crown corporation that acts as an insurance facility and/or broker between municipalities and insurers to develop parametric covers for high-risk areas. The crown corporation would fund modelling and monitoring, and support claims management to property-owners with the payouts, once again, meant to be minimal, and with private insurance coverage made available for those above the cap (second layer of risk).
One of the main drawbacks for both PBCI models, however, is the administrative and technical burden placed on municipalities and communities. Municipalities, particularly smaller ones, have indicated that they do not have the expertise to manage such arrangements and would likely be overwhelmed by claims should an event be triggered. While a crown corporation could alleviate these drawbacks, feasibility would likely remain an issue because there is not enough availability of parametric insurance in Canada to service the scope of the solution for residents in high risk of flooding. Overall, it was ascertained that municipalities would not have the financial ability to manage the financial risks and costs which stem from the adoption of such PBCI models. The PBCI models also do not fully meet several of the policy objectives, namely for availability, compensation, and risk reduction. For these reasons, the Task Force ultimately chose to discount the PBCI models for this work. Parametric options remain a tool that could be explored at other levels of government but would not be an option for a national approach.
10.5 Annex E – Detailed Overview of Parameters of Costed High-Risk Insurance Models
Summary
Model 1 |
Model 2 |
Model 3 |
Model 4 |
|---|---|---|---|
High-risk pool with single low-coverage cap structure |
High-risk pool with tiered premium cap structure |
Public insurer with insurer partnership for |
Layered insurance structure with public reinsurer |
Pool for high-risk homeowners. Can be managed by Crown corporation, NFP, private entity, etc. Pool stabilized w/ market-based reinsurance and government backstop Mandatory coverage offer from insurers, w/ optional homeowner purchase Risk-based premiums up to low premium cap for high-risk homeowners No additional financial assistance provided to low-income homeowners Pool funded by premiums, $20 levy on all residential property policies; premium caps funded by governments |
Pool for high-risk homeowners. Can be managed by Crown corporation, NFP, private entity, etc. Pool is stabilized w/ market-based reinsurance and w/ government backstop Mandatory coverage offer and purchase (w/ mortgage); optional purchase otherwise Bundled comprehensive water coverage and standardized policies Risk-based premiums up to premium cap; multiple caps linked to home reconstruction costs No additional financial assistance provided to low-income homeowners Pool funded by premiums, $40 levy on all residential property policies; premium caps funded by governments |
Crown corporation provides comprehensive flood insurance to entire market through industry as intermediary Insurers collect premiums, pay claims, and service policies on behalf of Crown corporation, in exchange for fee Crown corporation stabilized w/ market-based reinsurance and government backstop. Mandatory coverage offer and purchase (w/ property insurance); optional purchase otherwise Bundled comprehensive water coverage and standardized policies Risk-based price up to high premium cap Additional financial assistance provided through income-based subsidies Funded through premiums, $45 levy on all residential policies; premium caps subsidized by governments |
Layered approach w/ Crown corporation selling subsidized excess-of-loss reinsurance directly to private industry; Crown corporation stabilized w/ market-based reinsurance and w/ government backstop Mandatory offer of first layer (modest limit) of coverage by insurers, w/ optional homeowner take-up Mandatory purchase (w/property insurance) of the second layer by homeowner above the first-layer coverage up to coverage limit Bundled comprehensive water coverage for both layers Public reinsurance only available for second layer, insurers underwrite risk and are reimbursed for losses Risk-based premiums for first layer (private market) Risk-based premiums for second layer up to high premium cap Additional financial assistance provided through income-based subsidies Funding through premiums, $20 levy on all residential property policies; governments subsidize premium caps subsidized by governments |
Coverage options
(a) Size of the market (who could be covered by the pool?)
Model 1 |
Model 2 |
Model 3 |
Model 4 |
Model 4 |
|---|---|---|---|---|
Pool: homeowners at high risk of flooding (Risk-based premium > $300) |
Pool: homeowners at high risk of flooding (Gross premium > 0.1% of coverage limit) |
All homeowners |
All homeowners |
All homeowners |
(b) Mechanisms to promote participation in high-risk area
Flat Cap High-Risk Pool |
Tiered High-Risk Pool |
Public Insurer |
Public Reinsurer (Layer 1) |
Public Reinsurer (Layer 2) |
|---|---|---|---|---|
Mandatory offer and optional purchase; Take-up rate = 50% based on low premium cap ($500) |
Mandatory offer; Mandatory purchase with mortgage requirement; Optional purchase otherwise; Bundle w/ comp. water coverage; Overall take-up rate = 65% based on mortgage requirement |
Mandatory offer and mandatory purchase with property insurance; Bundle comp. water coverage; Overall take-up rate =90% based on bundling with property insurance |
Mandatory offer but optional purchase; Bundle in comp. water coverage Overall take-up rate = 35% based on optional purchase with full risk-based pricing |
Mandatory offer and mandatory purchase with property insurance; Bundle in comp. water coverage; Overall take-up rate = 90% based on bundling with property insurance |
(c) Participation in low/medium risk area assumed in modelling
Flat Cap High-Risk Pool |
Tiered High-Risk Pool |
Public Insurer |
Public Reinsurer (Layer 1) |
Public Reinsurer (Layer 2) |
|---|---|---|---|---|
80% participation in low risk; 50% in medium risk |
80% participation in low risk; 65% in medium risk based on mortgage requirement |
95% participation in low risk; 95% in medium risk |
80% participation in low risk. 50% in medium risk |
95% participation in low risk. 95% in medium risk |
(d) Coverage limit (in $)
Flat Cap High-Risk Pool |
Tiered High-Risk Pool |
Public Insurer |
Public Reinsurer (Layer 1) |
Public Reinsurer (Layer 2) |
|---|---|---|---|---|
$300,000 |
$300,000 |
$300,000 |
$25,000 |
$300,000 |
(e) Deductible (in $)
Flat Cap High-Risk Pool |
Tiered High-Risk Pool |
Public Insurer |
Public Reinsurer (Layer 1) |
Public Reinsurer (Layer 2) |
|---|---|---|---|---|
$5,000 |
$5,000 |
$5,000 |
$5,000 |
$25,000 |
Costing options
(a) Indemnities to repair/rebuild and ALE
Model 1 |
Model 2 |
Model 3 |
Model 4 |
Model 4 |
|---|---|---|---|---|
Homeowners paid by insurers; Insurers reimbursed by pool |
Homeowners paid by insurers; Insurers reimbursed by pool |
Homeowners paid by insurers; Insurers reimbursed by Crown corp. insurer |
Homeowners paid by insurers |
Homeowners paid by insurers; Insurers reimbursed by public reinsurer for losses > 25k$ and below coverage limit |
(b) Mechanism to cede risk to pool / public (re)insurer
Flat Cap High-Risk Pool |
Tiered High-Risk Pool |
Public Insurer |
Public Reinsurer (Layer 1) |
Public Reinsurer (Layer 2) |
|---|---|---|---|---|
Automatic ceding of policy to pool when premium > $300 (high risk) |
Automatic ceding of policy to pool when gross premium > 0.1% of coverage cap (high risk) |
Automatic for all homeowners |
None |
Automatic for all homeowners |
(c) Governmental backstop
Flat Cap High-Risk Pool |
Tiered High-Risk Pool |
Public Insurer |
Public Reinsurer (Layer 1) |
Public Reinsurer (Layer 2) |
|---|---|---|---|---|
Backstop if reserves fall under 2x average annual insured losses. Capital injection to reach 5x AAIL |
Backstop if reserves fall under 2x average annual insured losses. Capital injection to reach 5x AAIL |
Backstop if reserves fall under 2x average annual insured losses. Capital injection to reach 5x AAIL |
None |
Backstop if reserves fall under 2x average annual insured losses. Capital injection to reach 5x AAIL |
(d) Claim administration
Flat Cap High-Risk Pool |
Tiered High-Risk Pool |
Public Insurer |
Public Reinsurer (Layer 1) |
Public Reinsurer (Layer 2) |
|---|---|---|---|---|
Performed by the primary private insurer |
Performed by the primary private insurer |
Performed by the private insurer through partnership |
Performed by the primary private insurer |
Performed by the primary private insurer |
(e) Distribution, marketing and promotion
Flat Cap High-Risk Pool |
Tiered High-Risk Pool |
Public Insurer |
Public Reinsurer (Layer 1) |
Public Reinsurer (Layer 2) |
|---|---|---|---|---|
Performed by the primary insurer |
Performed by the primary insurer |
Performed by the private insurer through partnership; fixed cost equally distributed across insured HH (not risk based) |
Performed by the primary private insurer |
Performed by the primary insurer |
(f) Overhead (IT, HR, lawyers, …)
Flat Cap High-Risk Pool |
Tiered High-Risk Pool |
Public Insurer |
Public Reinsurer (Layer 1) |
Public Reinsurer (Layer 2) |
|---|---|---|---|---|
Primary insurer pays/benefits for these expenses |
Primary insurer pays/benefits for these expenses |
Public insurer mostly pays/benefits for these expenses. Some expenses paid by private insurers. Fixed cost equally distributed across insured HH (not risk based) |
Primary insurer pays/benefits for these expenses. |
Public reinsurer pays/benefits for these expenses. Some expenses paid by private insurer. Fixed cost equally distributed across insured HH (not risk based) |
(g) Reinsurance
Flat Cap High-Risk Pool |
Tiered High-Risk Pool |
Public Insurer |
Public Reinsurer (Layer 1) |
Public Reinsurer (Layer 2) |
|---|---|---|---|---|
Stop-Loss reinsurance to absorb losses over 99th percentile of insured annual losses |
Stop-Loss reinsurance to absorb losses over 99th percentile of insured annual losses |
Stop-Loss reinsurance to absorb losses over 99th percentile of insured annual losses |
Stop-Loss reinsurance to absorb losses over 95th percentile of insured annual losses |
Stop-Loss reinsurance to absorb losses over 99th percentile of insured annual losses |
(h) Safety loading and initial Capital
Flat Cap High-Risk Pool |
Tiered High-Risk Pool |
Public Insurer |
Public Reinsurer (Layer 1) |
Public Reinsurer (Layer 2) |
|---|---|---|---|---|
Safety loading: Probability of ruin of 1% up to 90th percentile; Initial capital: 5x AAIL |
Safety loading: Probability of ruin of 1% up to 90th percentile; Initial capital: 5x AAIL |
Safety loading: Probability of ruin of 1% up to 90th percentile; Initial Capital: 5x AAIL |
Probability of ruin of 1% up to 95th percentile; Initial Capital : 5x AAIL |
Safety loading: Probability of ruin of 1% up to 90th percentile; Initial Capital: 5x AAIL |
Funding options
(a) Premium determination
Flat Cap High-Risk Pool |
Tiered High-Risk Pool |
Public Insurer |
Public Reinsurer (Layer 1) |
Public Reinsurer (Layer 2) |
|---|---|---|---|---|
Risk-based up to premium cap of $500 |
Risk-based up to premium caps; 5 levels of caps based on quintile of reconstruction cost distribution: Quintile 1 : $250 (least costly properties) Quintile 2: $500 Quintile 3: $1,000 Quintile 4: $2,000 Quintile 5: $4,000 (most costly properties) |
Risk-based up to premium caps of $3,000; Subsidies applied to increase affordability |
Risk-based |
Risk-based reinsurance premium but reinsurance is subsidized (caps and subsidies) |
(b) Cross-subsidization
Flat Cap High-Risk Pool |
Tiered High-Risk Pool |
Public Insurer |
Public Reinsurer (Layer 1) |
Public Reinsurer (Layer 2) |
|---|---|---|---|---|
Levy of $20 per homeowner added to property insurance |
Levy of $40 per homeowner added to property insurance |
Levy of $45 per homeowner added to property insurance |
$20 per homeowner. Amount added on home insurance |
Levy of $20 per homeowner added to property insurance |
(c) Funding of premium caps
Flat Cap High-Risk Pool |
Tiered High-Risk Pool |
Public Insurer |
Public Reinsurer (Layer 1) |
Public Reinsurer (Layer 2) |
|---|---|---|---|---|
Governments pay for risk-based premium in excess of $500 premium cap |
Governments pay for risk-based premium in excess of given premium caps |
Governments pay for risk-based premium in excess of $3,000 premium cap |
None |
Governments pay for risk-based premium in excess of $3,000 premium cap |
(c2) Subsidies funding
Flat Cap High-Risk Pool |
Tiered High-Risk Pool |
Public Insurer |
Public Reinsurer (Layer 1) |
Public Reinsurer (Layer 2) |
|---|---|---|---|---|
No additional income-based subsidy applied |
No additional income-based subsidy applied |
Governments pay for income-based subsidies; Progressive subsidy structure modelled: rate of subsidy applied (40-50%) increases in relation to premium-to- household income; Additional subsidies provided for low and very low-income households |
None |
Governments pay for income-based subsidies; Progressive subsidy structure modelled: rate of subsidy applied (40-50%) increases in relation to premium-to- household income; Additional subsidies provided for low and very low-income households |
Others
(a) DFA
Flat Cap High-Risk Pool |
Tiered High-Risk Pool |
Public Insurer |
Public Reinsurer (Layer 1) |
Public Reinsurer (Layer 2) |
|---|---|---|---|---|
FPT DFA programs for flooding of residential properties assumed to be removed with existence of insurance arrangement |
||||
- Date modified: