2021 Corrections and Conditional Release Statistical Overview
Erratum
Date: June 20, 2023
Location:Figure C28, Table C28, Figure D4
Revision: The notes for Figure C28 and Table C28 were adjusted to specify that data was only available for Quebec and Ontario provincial parole boards in 2020 and did not include Alberta provincial parole boards. The second bullet in Figure D4 was changed to reflect the decrease for non-Indigenous offenders as (34.8; -7.9) rather than (32.3; -7.9).
Rationale for the revision: Public Safety was asked to clarify the notes for Figure C28 and Table C28 and was made aware of a mistake in the data for Figure D4.
 2021 Corrections and Conditional Release Statistical Overview PDF Version (5.8 MB)
March 2023
This document was produced by the Public Safety Canada Portfolio Corrections Statistics Committee which is composed of representatives of Public Safety Canada, Correctional Service of Canada, Parole Board of Canada, the Office of the Correctional Investigator and the Canadian Centre for Justice and Community Safety Statistics (Statistics Canada).
Table of contents
- Preface
- Contributing Partners
- Section A: Crime and the Criminal Justice System
- Police-reported crime rate
- Police-reported crime rates by province/territory
- Police-reported violent victimization: 5-year trend
- Police-reported violent victimization of sexual and non-sexual violent offences by age: 5-year trend
- Police-reported violent crime by type and gender of victim
- Self-reported victimization rate
- Self-reported violent victimization rate by type, gender, and age
- Self-reported victimization reported to police by crime
- The rate of adults charged
- Criminal Code and other Federal Statute charges among adults
- Decisions in adult criminal court
- Length of adult custodial sentences
- The rate of youth charged
- Criminal Code and other Federal Statute charges among youth
- Youth criminal court sentences: 5-year trend
- Youth criminal court sentences for most serious sentence: 5-year trend
- Incarceration rates across Western and European countries
- Incarceration rates across Western and European countries: 10-year trend
- Section B: Corrections Administration
- Correction costs federally and provincially/territorially
- Number of CSC employees by location
- Cost of incarceration in a federal institution: 5-year trend
- The number of Parole Board of Canada employees
- The number of employees in the Office of the Correctional Investigator
- Most common offender complaints to the Office of the Correctional Investigator
- Section C: Federal Offender and Registered Victims Populations
- Offenders under the responsibility of CSC
- Number of registered victims and offenders with a registered victim: 4-year trend
- The number of in-custody offenders: 10-year trend
- Number of admissions to CSC facilities
- Warrant of committal admissions to CSC facilities by sex: 10-year trend
- Number of registered victims by sex: 4-year trend
- CSC total offender population by sentence length
- Offences of victimization among registered victims
- Warrant of committal admissions to a CSC facility by age
- Number of registered victims by age
- Warrant of committal admissions to a CSC facility for Indigenous and non-Indigenous offenders
- Age of the CSC in-custody offender population compared to the Canadian adult population
- CSC offender population by self-reported race
- Number of registered victims by race
- CSC offender population by religion
- CSC offenders by Indigenous and non-Indigenous self-identification
- Offenders in-custody at a CSC facility by risk classification
- Admissions to federal jurisdiction with a life and/or indeterminate* sentence: 10-year trend
- Proportion of offenders with life and/or indeterminate sentences
- Percentage of total offender population serving a violent offence
- Indigenous offenders under the responsibility of CSC
- Admissions to administrative segregation in a federal institution: 5-year trend
- 72% of placements in administrative segregation in a CSC facility were for less than 30 days
- Number of offender deaths while in custody: 10-year trend
- The number of escapees from federal institutions
- CSC offenders in community under supervision: 10-year trend
- Offenders under provincial/territorial supervision on probation or conditional sentence: 10-year trend
- Population of offenders on provincial parole: 10-year trend
- Section D: Conditional Release
- Number of CSC offenders granted temporary absences: 10-year trend
- Offenders released from federal institutions including Healing Lodges on parole: 10-year trend
- Federal day and full parole grant rates: 10-year trend
- Federal day and full parole grant rates by Indigenous and non-Indigenous: 10-year trend
- Number of federal Elder-assisted parole hearings: 10-year trend
- Proportion of sentence served prior to being released on parole: 10-year trend
- Proportion of sentence served prior to being released on parole by Indigenous and non-Indigenous: 10-year trend
- Outcome of federal day parole supervision periods
- Outcome of federal full parole supervision periods
- Offenders released from federal institutions including Healing Lodges on statutory release: 10-year trend
- Outcome of federal statutory release supervision periods
- Rates of violent offence convictions for offenders on federal conditional release: 10-year trend
- Section E: Special Applications of Criminal Justice
- Section F: FEDERAL SERVICES TO REGISTERED VICTIMS
- Number of notifications to registered victims: 4-year trend
- Number of victim statements received for consideration in release decisions: 4-year trend
- Requests for financial assistance to attend parole hearings: 5-year trend
- Number of Parole Board of Canada contacts with victims: 10-year trend
- Victim presentations at PBC Hearings: 10-year trend
- Number of requests made by victims to access the PBC decision registry: 10-year trend
- Number of decisions sent from PBC decision registry
Preface
The Corrections and Conditional Release Statistical Overview (CCRSO) has been published annually since 1998. The purpose of the CCRSO is to assist the public in understanding statistical information on corrections and conditional release. A primary consideration in producing the CCRSO was to present general statistical information in a user friendly way that will facilitate understanding by a broad audience. There are several features of this document that make it different from typical statistical reports:
- The visual representation of the statistics is simple and uncluttered, and under each chart, a few key points assists the reader in extracting information from the chart.
- For each chart, a table of numbers corresponds to the visual representation. In some instances, the table includes additional numbers, (e.g., a five-year series), even though the chart depicts the data for the most recent year (e.g., Figure A2).
The data used in the CCRSO reflects the most recent data available at the time of publication. For much of the report the data is available from the 2021 calendar year or the fiscal year from April 1, 2020 - March 31, 2021. For some data there is a lag in reporting so the most recent data is from 2020 (or April 1, 2019 - March 31, 2020). There are a few figures where the cycle of data collection is more infrequent, for example the General Social Survey on Canadians’ Safety (Victimization) is administered on a 5-year cycle with the most recent data from 2019.
Considering much of the new data in the 2021 CCRSO was collected during the COVID-19 pandemic, the report provides an important snapshot of how the pandemic has impacted the criminal justice system. Therefore, trend data is often calculated up to and during the pandemic rather than in the standard 5 to 10 year timeframes. A notable change in the 2021 CCRSO is that information that was found in the victim section of prior CCRSO reports is now integrated throughout the report to better illustrate that victims should be taken into consideration throughout the entire criminal justice process and system.
The CCRSO includes data from partners that have different measures and methods for assessing gender and sex, and use different labels for these terms. For example, the Correctional Service of Canada (CSC) collects data on the sex of offenders; though in previous versions of the CCRSO the term gender was reported on by CSC, biological sex was still what was measured. Recent attention to the distinction between sex and gender has highlighted the importance of being clear and transparent in what is measured. Therefore, the description and labels used for CSC are labeled as sex and the categories used are Male, Female, and Another Sex. In contrast, the Uniform Crime Reporting (UCR) uses the terms Male and Female for identifying the gender of victims. For consistency, in the CCRSO, when sex was measured the terms Male, Female, and Another Sex were used whereas when gender was measured, the terms Men and Women and Boys and Girls were used.
In addition, some data that was previously labelled as measuring ethnicity has been changed in the current CCRSO to race to more accurately reflect the identity concepts used by partners. As work in measuring racialized groups advances, these terms and identity concepts may change in future years.
The format of this document has been updated to optimize the user experience by implementing industry-standard data visualization techniques to improve accessibility and usability. For more information, see the Standard on Web Accessibility and the Standard on Web Usability.
To continually improve this annual publication, we welcome your comments. Any correspondence regarding this report, including permission to use tables and figures should be directed to PS.CPBResearch-RechercheSPC.SP@ps-sp.gc.ca.
Contributing Partners
Public Safety Canada
Public Safety Canada (PS) is Canada’s lead federal department for public safety, which includes emergency management, national security and community safety. Its many responsibilities include developing legislation and policies that govern corrections, implementing innovative approaches to community justice, and providing research expertise and resources to the corrections community.
Correctional Service Canada
The Correctional Service of Canada (CSC) is the federal government agency responsible for administering sentences of a term of two years or more, as imposed by the courts. CSC is responsible for managing institutions of various security levels and supervising offenders under conditional release in the community.
Parole Board of Canada
The Parole Board of Canada (PBC) is an independent administrative tribunal responsible for making decisions about the timing and conditions of release of offenders into the community on various forms of conditional release. The Board also makes pardon, record suspension and expungement decisions and recommendations respecting clemency through the Royal Prerogative of Mercy.
Office of the Correctional Investigator
The Office of the Correctional Investigator (OCI) is an ombudsman for federal offenders. It conducts investigations into the problems of offenders related to decisions, recommendations, acts or omissions of the Correctional Service of Canada that affect offenders individually or as a group.
Canadian Centre for Justice and Community Safety Statistics (Statistics Canada)
The Canadian Centre for Justice and Community Safety Statistics (CCJCSS) is a division of Statistics Canada. The CCJCSS is the focal point of a federal-provincial-territorial partnership, known as the National Justice Statistics Initiative, for the collection of information on the nature and extent of crime and the administration of civil and criminal justice in Canada.
Section A: Crime and the Criminal Justice System
Police-reported crime rate

Image description
Line graph showing police-reported crime rates for violent, property, traffic, other criminal code, drugs, other federal statutes, total offences, and total, from 2011 to 2020. Traffic, drugs, and other federal statutes trends are the least frequent with relatively little difference over time. Violent crimes and the category of other criminal code offences trends are slightly more prevalent, with slim variation until a small spike in 2019, which decreases again in 2020. The trend in property crime decreases from 2011 until 2014 where it begins to rise until it reaches its apex in 2019, then drops in 2020. The number of total offenses mirrors the property crime trend line, decreasing from 2011 to 2014, then steadily rising until it's pinnacle in 2019, prior to dropping again in 2020. Full data are available immediately below.
Figure A1 Notes
Source: Table 35-10-0177-01, Incident-based crime statistics, by detailed violations, Canada, provinces, territories and Census Metropolitan Areas
- The police-reported crime rate increased 8.4% from 2016 to 2019 and then decreased 9.8% from 2019 to 2020.
- Other federal statutes and drug offences were the only two types of offences that decreased from 2016 to 2019. All other crime types increased during this time.
- All crime types declined from 2019-20, with violent crime showing the smallest decrease (2.0%) and other federal statutes showing the largest decrease (19.0%).
Other Criminal Code offences includes administration of justice violations, weapons/firearms violations, counterfeit, possession of, accessing, making or distribution of child pornography and prostitution.
Other federal statutes refer to offences against Canadian federal statutes, such as Customs Act, Employment Insurance Act, Firearms Act, Food and Drugs Act (FDA), Income Tax Act, Controlled Drugs and Substances Act (CDSA) and Narcotic Control Act (NCA). This offence category excludes Criminal Code of Canada offences.
The total crime rate in the Corrections and Conditional Release Statistical Overview includes traffic offences and violations of federal statutes to provide a measure of all criminal offences. As a result, the Total Crime Rate reported here is higher than the crime rate reported by Statistics Canada.
These crime statistics are based on crimes that are reported to the police. Since not all crimes are reported to the police, these figures underestimate actual crime. See A6 to A8 for self-reported rates based on General Social Survey on Canadians’ Safety surveys (victimization), an alternative method of measuring crime.
The figure includes data from the most recent year available at the time of publication.
| Year | Violent | Property | Traffic | Other CCC | Drugs | Other Fed. Statutes | Total Charged |
|---|---|---|---|---|---|---|---|
| 1998 | 1,345 | 5,696 | 469 | 1,051 | 235 | 40 | 8,915 |
| 1999 | 1,440 | 5,345 | 388 | 910 | 264 | 44 | 8,474 |
| 2000 | 1,494 | 5,189 | 370 | 924 | 287 | 43 | 8,376 |
| 2001 | 1,473 | 5,124 | 393 | 989 | 288 | 62 | 8,390 |
| 2002 | 1,441 | 5,080 | 379 | 991 | 296 | 54 | 8,315 |
| 2003 | 1,435 | 5,299 | 373 | 1,037 | 274 | 46 | 8,532 |
| 2004 | 1,404 | 5,123 | 379 | 1,072 | 306 | 50 | 8,391 |
| 2005 | 1,389 | 4,884 | 378 | 1,052 | 290 | 60 | 8,090 |
| 2006 | 1,387 | 4,809 | 376 | 1,050 | 295 | 57 | 8,004 |
| 2007 | 1,354 | 4,525 | 402 | 1,029 | 308 | 59 | 7,707 |
| 2008 | 1,334 | 4,258 | 437 | 1,039 | 308 | 67 | 7,475 |
| 2009 | 1,322 | 4,122 | 435 | 1,017 | 291 | 57 | 7,281 |
| 2010 | 1,292 | 3,838 | 420 | 1,029 | 321 | 61 | 6,996 |
| 2011 | 1,236 | 3,536 | 424 | 1,008 | 330 | 60 | 6,628 |
| 2012 | 1,199 | 3,438 | 407 | 1,001 | 317 | 67 | 6,466 |
| 2013 | 1,096 | 3,154 | 387 | 956 | 311 | 52 | 5,982 |
| 2014 | 1,044 | 3,100 | 365 | 918 | 295 | 49 | 5,793 |
| 2015 | 1,070 | 3,231 | 353 | 930 | 280 | 51 | 5,934 |
| 2016 | 1,076 | 3,239 | 346 | 982 | 267 | 60 | 5,987 |
| 2017 | 1,113 | 3,265 | 343 | 997 | 254 | 69 | 6,056 |
| 2018 | 1,152 | 3,348 | 340 | 1,013 | 229 | 58 | 6,152 |
| 2019 | 1,279 | 3,512 | 365 | 1,087 | 186 | 55 | 6,492 |
| 2020 | 1,254 | 3,071 | 330 | 977 | 176 | 45 | 5,856 |
Table A1 Notes
Source: Table 35-10-0177-01, Incident-based crime statistics, by detailed violations, Canada, provinces, territories and Census Metropolitan Areas
Other Criminal Code offences (Other CCC) includes administration of justice violations, weapons/firearms violations, counterfeit, possession of, accessing, making or distribution of child pornography and prostitution.
Other federal statutes refer to offences against Canadian federal statutes, such as Customs Act, Employment Insurance Act, Firearms Act, Food and Drugs Act (FDA), Income Tax Act, Controlled Drugs and Substances Act (CDSA) and Narcotic Control Act (NCA). This offence category excludes Criminal Code of Canada offences.
The total crime rate in the Corrections and Conditional Release Statistical Overview includes traffic offences and violations of federal statutes to provide a measure of all criminal offences. As a result, the Total Crime Rate reported here is higher than the crime rate reported by Statistics Canada.
Comparable data for police-reported crime are only available starting in 1998 due to changes from Uniform Crime Reporting (UCR) to the (UCR2). As a result the data presented in this year's report are not comparable to the data reported in the Corrections and Conditional Release Statistical Overview prior to 2010.
These crime statistics are based on crimes that are reported to the police. Since not all crimes are reported to the police, these figures underestimate actual crime. See A6 to A8 for self-reported rates based on General Social Survey on Canadians’ Safety surveys (victimization), an alternative method of measuring crime.
The table includes data from the most recent year available at the time of publication.
Police-reported crime rates by province/territory
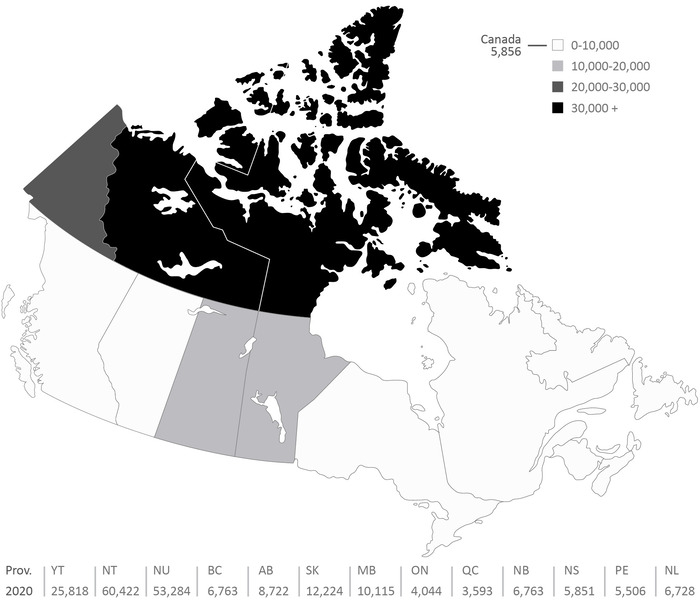
Image description
Map of Canada showing the police-reported crime rates by province and territory in 2020. Provinces and territories with the highest crime rates were Nunavut and the Northwest Territories with crime rates over 30,000 per 100,000. The Yukon has the next highest crime rate, between 20,000 and 30,000 per 100,0000. Saskatchewan and Manitoba both had rates between 10,000 and 20,000. The provinces with the lowest crime rates were British Columbia, Alberta, Ontario, Quebec, New Brunswick, Nova Scotia, Prince Edward Island and Newfoundland and Labrador, with crime rates between 0 to 10,000 per 100,000. Full data are available immediately below.
Figure A2 Notes
Source: Table 35-10-0177-01, Incident-based crime statistics, by detailed violations, Canada, provinces, territories and Census Metropolitan Areas
- Crime rates were higher in central Canada and highest in the territories. This general pattern has been stable over time.
- Between 2016 to 2019 the crime rate in most provinces and territories increased. The largest increases were 36.8% and 28.0% in Nunavut and the Northwest Territories respectively. Quebec and Saskatchewan were the only two of the provinces and territories to see a decrease during this time.
- Between 2019 to 2020 the crime rate in most provinces and territories decreased. The largest decrease was 13.0% in Alberta.
These crime statistics are based on crimes that are reported to the police. Since not all crimes are reported to the police, these figures underestimate actual crime. See A6 to A8 for self-reported rates based on General Social Survey on Canadians’ Safety surveys (victimization), an alternative method of measuring crime.
The Crime Rate in the Corrections and Conditional Release Statistical Overview includes traffic offences and violations of federal statutes to provide a measure of all criminal offences. As a result, the Crime Rate reported here is higher than the crime rate reported by Statistics Canada.
The figure includes data from the most recent year available at the time of publication.
| Province/Territory | 2016 | 2017 | 2018 | 2019 | 2020 |
|---|---|---|---|---|---|
Newfoundland & Labrador |
6,501 | 6,042 | 6,042 | 6,687 | 6,728 |
Prince Edward Island |
5,013 | 4,713 | 5,392 | 6,279 | 5,506 |
Nova Scotia |
5,590 | 5,732 | 5,686 | 5,873 | 5,851 |
New Brunswick |
5,276 | 5,753 | 6,056 | 6,752 | 6,763 |
Quebec |
4,233 | 4,330 | 4,165 | 4,066 | 3,593 |
Ontario |
4,091 | 4,259 | 4,509 | 4,544 | 4,044 |
Manitoba |
9,508 | 9,758 | 9,998 | 10,864 | 10,115 |
Saskatchewan |
13,511 | 12,983 | 12,665 | 12,898 | 12,224 |
Alberta |
9,026 | 9,335 | 9,392 | 10,027 | 8,722 |
British Columbia |
8,489 | 8,090 | 8,251 | 9,574 | 8,532 |
Yukon Territories |
23,543 | 22,191 | 21,638 | 26,391 | 25,818 |
Northwest Territories |
43,320 | 44,537 | 45,461 | 55,470 | 60,422 |
Nunavut |
35,935 | 36,912 | 40,094 | 49,158 | 53,284 |
Canada |
5,987 | 6,056 | 6,152 | 6,492 | 5,856 |
Table A2 Notes
Source: Table 35-10-0177-01, Uniform Crime Reporting Survey, Canadian Centre for Justice and Community Safety Statistics, Statistics Canada.
These crime statistics are based on crimes that are reported to the police. Since not all crimes are reported to the police, these figures underestimate actual crime. See A6 to A8 for self-reported rates based on General Social Survey on Canadians’ Safety surveys (victimization), an alternative method of measuring crime.
The Crime Rate in the Corrections and Conditional Release Statistical Overview includes traffic offences and violations of federal statutes to provide a measure of all criminal offences. As a result, the Crime Rate reported here is higher than the crime rate reported by Statistics Canada.
The figure includes data from the most recent year available at the time of publication.
Police-reported violent victimization: 5-year trend
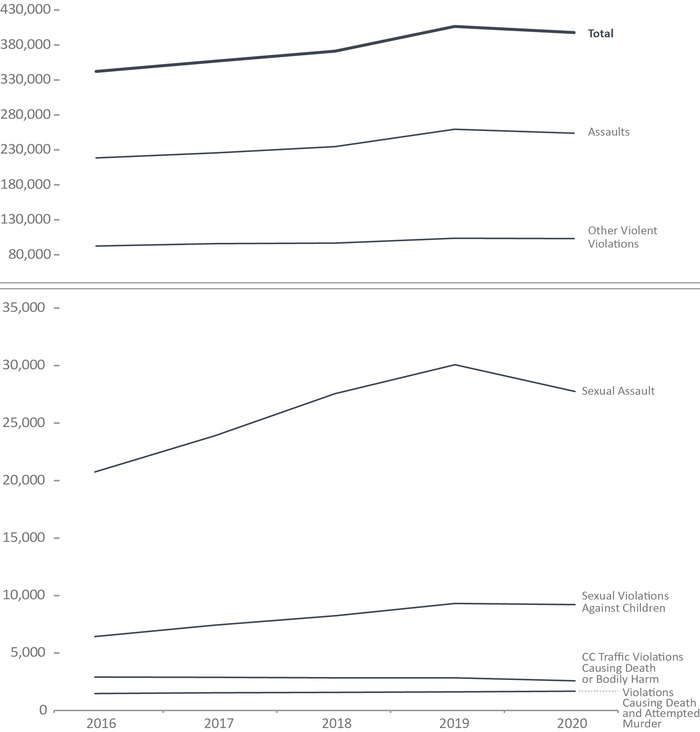
Image description
Line graph showing the police-reported violent victimization rates for a 5-year period from 2016 to 2020. The graph reports the crime categories of assaults, other violent violations, sexual assault, sexual violations against children, criminal code traffic violations causing death or bodily harm, violations causing death or attempted murder, as well as providing a total. The criminal code traffic violations causing death or bodily harm, and violations causing death or attempted murder trends were the lowest, remaining relatively consistent from 2016 to 2020. Sexual violations against children increased steadily from 2016 until its peak in 2019, then decreased in 2020. The number of sexual assaults also rose steadily until an apex in 2019, decreasing in 2020. The crimes categorized as other violent violations rose slightly until 2019, then decreased in 2020. The assaults also rose slightly until 2019, then decreased in 2020, increasing from 2016 until the peak in 2019 then slightly dropping in 2020. Full data are available immediately below.
Figure A3 Notes
Source: Table 35-10-0049-01, Uniform Crime Reporting Survey, Canadian Centre for Justice and Community Safety Statistics, Statistics Canada.
- Police-reported violent victimization increased 18.8% from 2016 to 2019 and then decreased 2.2% in the last year (from 2019 to 2020). This pattern was consistent for each type of violent victimization with the exception of criminal code traffic violations causing death or bodily harm which has been on a decline since 2016.
- Police-reported sexual violations against childrenFootnote * increased 44.9% from 2016 to 2019 and then declined 1.1% from 2019 to 2020. This was the largest increase across crime type from 2016-2019 and the smallest decline from 2019 to 2020.
- Footnote *
-
Sexual violations against children are a set of Criminal Code violations that specifically concern violations involving child and youth victims. These include violations such as sexual interference, invitation to sexual touching and sexual exploitation, but exclude sexual violations not specific to children.
Includes dangerous operation of a motor vehicle, failure to stop and other Criminal Code traffic violations.
These crime statistics are based on crimes that are reported to the police. Since not all crimes are reported to the police, these figures underestimate actual crime. See A6 to A8 for self-reported rates based on General Social Survey on Canadians’ Safety surveys (victimization), an alternative method of measuring crime.
Excludes victims where age is over 89.
Figure A3 in the 2021 CCRSO corresponds to Figure F4 in the 2020 CCRSO.
| Type of Crime | 2016 | 2017 | 2018 | 2019 | 2020 |
|---|---|---|---|---|---|
Assaults |
218,238 | 225,350 | 234,398 | 259,175 | 253,510 |
Other violent violations |
92,182 | 95,569 | 96,302 | 103,271 | 102,790 |
Sexual assault (levels 1, 2, 3) |
20,748 | 23,905 | 27,561 | 30,081 | 27,755 |
Sexual violations against children |
6,428 | 7,424 | 8,239 | 9,313 | 9,215 |
Criminal Code traffic violations causing death or bodily harm |
2,910 | 2,883 | 2,842 | 2,841 | 2,584 |
Violations causing death and attempted murder |
1,472 | 1,538 | 1,579 | 1,624 | 1,680 |
Total |
341,978 | 356,669 | 370,921 | 406,305 | 397,534 |
Table A3 Notes
Source: Table 35-10-0049-01, Uniform Crime Reporting Survey, Canadian Centre for Justice and Community Safety Statistics, Statistics Canada.
Sexual violations against children are a set of Criminal Code violations that specifically concern violations involving child and youth victims. These include violations such as sexual interference, invitation to sexual touching and sexual exploitation, but exclude sexual violations not specific to children.
Includes dangerous operation of a motor vehicle, failure to stop and other Criminal Code traffic violations.
These crime statistics are based on crimes that are reported to the police. Since not all crimes are reported to the police, these figures underestimate actual crime. See A6 to A8 for self-reported rates based on General Social Survey on Canadians’ Safety surveys (victimization), an alternative method of measuring crime.
Excludes victims where age is over 89.
Table A3 in the 2021 CCRSO corresponds to Table F4 in the 2020 CCRSO.
Police-reported violent victimization of sexual and non-sexual violent offences by age: 5-year trend

Image description
Line graph showing the police-reported victimization of non-sexual violent offences by age from calendar year 2017 to 2021. Those under 12 years of age and over 45 years of age reported the least victimizations, which rose slightly over the 5 year trend. For those 12 to 17 years of age, the trend fluctuated each year with the highest point in 2019, and the lowest in 2020. Ages 25 to 44 reported the most victimizations, a number that rose steadily over time. Ages 18 to 24 reported even more victimizations to police than those Aged 25 to 44. While there were fluctuations in the non-sexual violent crime victimizations reported by 18 to 24 year old victims to police, the trend was at its highest point in 2019 and lowest point in 2020. Full data are available immediately below.

Image description
Line graph showing the police-reported victimization by age from calendar year 2017 to 2021 for violent sexual offences. Those over 45 years of age, 25 to 44, under 12, and between 18 to 24 years of age, all had relatively consistent trends in reporting this crime type to police over time. For those aged 12 to 17, rates increased steadily from 2017 to 2019, dropped in 2020, then rose to their apex in 2021. Full data are available immediately below.
Figure A4 Notes
Source: Uniform Crime Reporting Survey, Canadian Centre for Justice and Community Safety Statistics, Statistics Canada.
- Adults aged 18-24 years had the highest rate of police-reported non-sexual violent victimization across the past 5 years (2017 to 2021).
- Youth aged 12-17 years consistently had the highest rate of police-reported sexual violent victimization in the past 5 years (2017 to 2021).
- The rate of police-reported sexual and non-sexual violent victimization was on an upward trend from 2017-2019 among all age groups. Rates then declined during the pandemic from 2019 to 2020 followed by an increase from 2020 to 2021.
- Youth aged 12-17 had the highest increase in both police-reported sexual and non-sexual violent victimization from 2020 to 2021 (26.8% and 15.9% respectively).
Non-sexual violent offences include 1) violations causing death and attempted murder, 2) Assaults, 3) other violent violations (e.g., robbery; criminal harassment; indecent/harassing communications; uttering threats; kidnapping, forcible confinement, abduction or hostage taking; trafficking in persons and prostitution; violent firearm violations; extortion; and other violent violations), and Traffic offences causing bodily harm.
Sexual violent offences include 1) sexual assaults, 2) sexual violations against children (e.g., child and youth victims). These include violations such as sexual interference, invitation to sexual touching and sexual exploitation.
Excludes victims where age is over 89.
Figures A4a and A4b in the 2021 CCRSO corresponds to Figures F5a and F5b in the 2020 CCRSO.
The 2020 CCRSO reported rates per 1,000 whereas in the current report, they are per 100,000.
| Year | Under 12 | Age 12 - 17 | Ages 18 - 24 | Ages 25 - 44 | Ages 45 + | ||||||||||
|---|---|---|---|---|---|---|---|---|---|---|---|---|---|---|---|
| Total Gender | Boys | Girls | Total Gender | Boys | Girls | Total Gender | Men | Women | Total Gender | Men | Women | Total Gender | Men | Women | |
| Victimization of non-sexual violent offences | |||||||||||||||
| 2017 | 2.4 | 2.8 | 2.0 | 13.6 | 14.3 | 12.9 | 18.4 | 16.7 | 20.3 | 14.3 | 13.6 | 15.1 | 4.8 | 5.6 | 4.1 |
| 2018 | 2.5 | 2.8 | 2.1 | 13.4 | 13.9 | 12.9 | 18.0 | 16.4 | 19.8 | 14.7 | 13.9 | 15.5 | 5.0 | 5.7 | 4.3 |
| 2019 | 2.9 | 3.3 | 2.4 | 15.0 | 15.6 | 14.3 | 18.7 | 17.3 | 20.3 | 15.8 | 14.9 | 16.7 | 5.4 | 6.2 | 4.6 |
| 2020 | 2.4 | 2.7 | 2.1 | 11.8 | 11.9 | 11.7 | 17.9 | 16.1 | 19.9 | 16.0 | 15.0 | 17.0 | 5.5 | 6.5 | 4.7 |
| 2021 | 2.8 | 3.1 | 2.5 | 13.7 | 13.7 | 13.7 | 18.1 | 16.3 | 20.1 | 16.4 | 15.2 | 17.6 | 5.7 | 6.6 | 4.9 |
| Victimization of sexual violent offences | |||||||||||||||
| 2017 | 1.2 | 0.6 | 1.8 | 4.6 | 0.9 | 8.5 | 1.8 | 0.3 | 3.5 | 0.7 | 0.1 | 1.2 | 0.1 | 0.0 | 0.3 |
| 2018 | 1.3 | 0.6 | 1.9 | 5.1 | 1.0 | 9.3 | 2.1 | 0.3 | 4.0 | 0.8 | 0.1 | 1.5 | 0.2 | 0.0 | 0.3 |
| 2019 | 1.5 | 0.7 | 2.2 | 5.6 | 1.1 | 10.3 | 2.1 | 0.3 | 4.1 | 0.8 | 0.1 | 1.6 | 0.2 | 0.0 | 0.3 |
| 2020 | 1.4 | 0.7 | 2.2 | 5.1 | 1.0 | 9.4 | 2.0 | 0.3 | 3.8 | 0.8 | 0.1 | 1.5 | 0.2 | 0.0 | 0.3 |
| 2021 | 1.7 | 0.7 | 2.7 | 6.5 | 1.2 | 12.0 | 2.2 | 0.3 | 4.2 | 0.9 | 0.2 | 1.7 | 0.2 | 0.0 | 0.3 |
Table A4 Notes
Source: Uniform Crime Reporting Survey, Canadian Centre for Justice and Community Safety Statistics, Statistics Canada.
Non-sexual violent offences include 1) violations causing death and attempted murder, 2) Assaults, 3) other violent violations (e.g., robbery; criminal harassment; indecent/harassing communications; uttering threats; kidnapping, forcible confinement, abduction or hostage taking; trafficking in persons and prostitution; violent firearm violations; extortion; and other violent violations), and Traffic offences causing bodily harm.
Sexual violent offences include 1) sexual assaults, 2) sexual violations against children (e.g., child and youth victims). These include violations such as sexual interference, invitation to sexual touching and sexual exploitation.
Excludes victims where age is over 89.
Tables A4a and A4b in the 2021 CCRSO corresponds to Tables F5a and F5b in the 2020 CCRSO.
The 2020 CCRSO reported rates per 1,000 whereas in the current report, they are per 100,000.
Police-reported violent crime by type and gender of victim
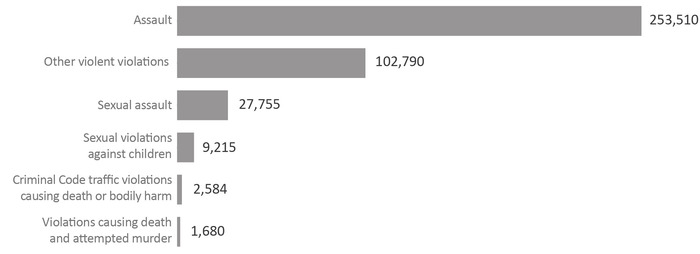
Image description
Bar graph showing the number of victims of police-reported violent crime by type in calendar year 2020. Assault was the most common crime that was reported to police with 253,510 victims; followed by a category called “other violent violations” with 102,790 victims reporting their victimization to the police; sexual assault with 27,755 victims; sexual violations against children with 9,215 victims; Criminal Code traffic violations causing death or bodily harm with 2,584 victims; and finally, violations causing death and attempted murder with 1,680 victims. Full data are available immediately below.

Image description
Bar graph showing the gender of the victims of violent crime whose victimization was reported to the police in calendar year 2020. Assaults, other violent offences, and criminal code traffic violations causing death or bodily harm were all relatively evenly represented by the gender of the victim. Sexual assault and sexual violations against children were mainly perpetrated upon victims that are women or girls, at over 80 percent of all offences of this type. The victims of “violations causing death” or of “attempted murder” were primarily boys and men at 70 percent. Full data are available immediately below.
Figure A5 Notes
Source: Table 35-10-0049-01, Uniform Crime Reporting Survey, Canadian Centre for Justice and Community Safety Statistics, Statistics Canada.
- Physical assaults accounted for nearly two-thirds of all police-reported violent crime.
- Girls/women accounted for slightly more than half (52.7%) of violent crime. Boys/men were more likely to be victims of violations causing death (73.2%) and females were more likely to be victims of sexual violence.
*Sexual violations against children are a set of Criminal Code violations that specifically concern violations involving child and youth victims. These include violations such as sexual interference, invitation to sexual touching and sexual exploitation, but exclude sexual violations not specific to children.
**Criminal Code traffic violations causing death or bodily harm includes dangerous operation of a motor vehicle, failure to stop and other Criminal Code traffic violations.
Excludes victims where age is over 89.
Figures A5a and A5b in the 2021 CCRSO corresponds to Figure F6a and F6b in the 2020 CCRSO.
The 2020 CCRSO reported rates per 1,000 whereas in the current report, they are per 100,000.
| Type of Crime | Gender of Victim | Total | ||||||
|---|---|---|---|---|---|---|---|---|
| Girls and Women | Boys and Men | Not Reported | ||||||
| # | % | # | % | # | % | # | % | |
| Assaults | 123,710 | 58.7 | 128,993 | 69.5 | 807 | 74.4 | 253,510 | 63.8 |
| Other violent violations | 52,993 | 25.1 | 49,620 | 26.7 | 177 | 16.3 | 102,790 | 25.9 |
| Sexual assault | 24,881 | 11.8 | 2,814 | 1.5 | 60 | 5.5 | 27,755 | 7.0 |
| Sexual violations against children | 7,715 | 3.7 | 1,480 | 0.8 | 20 | 1.8 | 9,215 | 2.3 |
| Criminal Code traffic violations causing death or bodily harm | 1,129 | 0.5 | 1,444 | 0.8 | 11 | 1.0 | 2,584 | 0.7 |
| Violations causing death and attempted murder | 409 | 0.2 | 1,262 | 0.7 | 9 | 0.8 | 1,680 | 0.4 |
| Total | 210,837 | 185,613 | 1,084 | 397,534 | ||||
Table A5 Notes
Source: Table 35-10-0049-01, Uniform Crime Reporting Survey, Canadian Centre for Justice and Community Safety Statistics, Statistics Canada
Sexual violations against children are a set of Criminal Code violations that specifically concern violations involving child and youth victims. These include violations such as sexual interference, invitation to sexual touching and sexual exploitation, but exclude sexual violations not specific to children.
Criminal Code traffic violations causing death or bodily harm includes dangerous operation of a motor vehicle, failure to stop and other Criminal Code traffic violations.
Excludes victims where age is over 89.
Table A5 in the 2021 CCRSO corresponds to Table F6 in the 2020 CCRSO.
Self-reported victimization rate
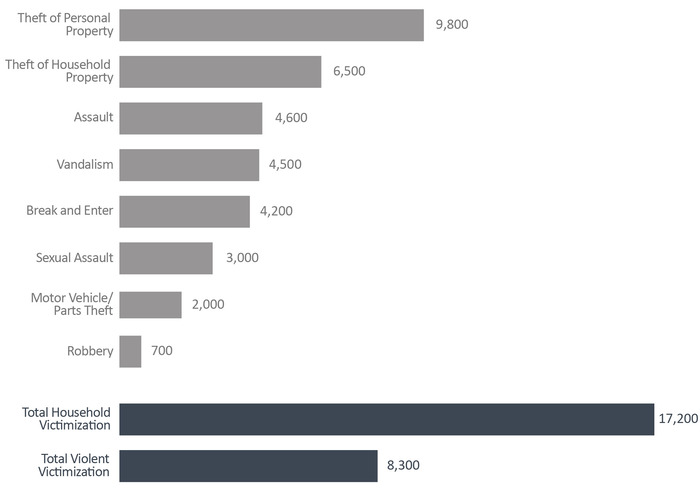
Image description
Bar graph showing the number of victims of crime per 100,000 population that self-reported an experience of criminal victimization in calendar year 2019. Theft of personal property was the most frequent criminal victimization experienced by the public with 9,800 victims per 100,000 people; followed by theft of household property with 6,500 victims per 100,000 people; assault with 4,600 victims; vandalism with 4,500 victims; break and enter with 4,200 victims; sexual assault with 3,000 victims; motor vehicle or parts theft with 2,000 victims; and finally, robbery with 700 victims. Full data are available immediately below.
Figure A6 Notes
Source: General Social Survey (GSS) Canadians’ Safety, Statistics Canada.
- In 2019, theft of personal property was the most common self-reported crime followed by theft of household property.
- Assault was the third most common self-reported crime and the most common violent crime.
General Social Survey (GSS) Canadians’ Safety are reported per 1,000 population, these are converted to per 100,000 in the CCRSO for ease of comparison with police reported rates.
Total household victimization includes the following categories asked in the General Social Survey: motor vehicle/parts theft, break and enter, vandalism, theft of household property.
Total violent victimization includes the following categories asked in the General Social Survey: physical assault, sexual assault, and robbery.
The GSS Canadians’ Safety is conducted every 5 years, the most recent data available is from 2019. The GSS excludes those under age 15.
Figure A6 in the 2021 CCRSO corresponds to Figure F3 in the 2020 CCRSO. The 2020 CCRSO reported rates per 1,000 whereas in the current report, they are per 100,000 to allow for easier comparison to police-reported crime rates.
| Type of Violent Victimization | Rate |
|---|---|
Theft of Personal Property |
9,800 |
Theft of Household Property |
6,500 |
Physical Assault |
4,600 |
Vandalism |
4,500 |
Break and Enter |
4,200 |
Sexual Assault |
3,000 |
Motor Vehicle/Parts Theft |
2,000 |
Robbery |
700 |
Total Household Victimization |
17,200 |
Total Violent Victimization |
8,300 |
Table A6 Notes
Source: General Social Survey (GSS) Canadians’ Safety, Statistics Canada.
General Social Survey (GSS) Canadians’ Safety are reported per 1,000 population, these are converted to per 100,000 in the CCRSO for ease of comparison with police reported rates.
Total household victimization includes the following categories asked in the General Social Survey: motor vehicle/parts theft, break and enter, vandalism, theft of household property.
Total violent victimization includes the following categories asked in the General Social Survey: physical assault, sexual assault, and robbery.
The GSS Canadians’ Safety is conducted every 5 years, the most recent data available is from 2019. The GSS excludes those under age 15.
Table A6 in the 2021 CCRSO corresponds to Table F3 in the 2020 CCRSO. The 2020 CCRSO reported rates per 1,000 whereas in the current report, they are per 100,000 to allow for easier comparison to police-reported crime rates.
Self-reported violent victimization rate by type, gender, and age
Image description
Bar graph showing the self-reported violent victimization rate by age and gender in calendar year 2019 per 100,000 population. Of the 15 to 24 age group, women accounted for 25,700 self-reported violent crimes and men accounted for 10,300. Of the 25 to 34 age group, women accounted for 17,900 self-reported violent crimes and men accounted for 9,100. Of the 35 to 44 age group, women accounted for 8,300 of violent crime victims and men accounted for 7,500. Of the 45 to 54 age group, women accounted for 9,800 of violent victimizations and men accounted for 4,200 of self-reported violent victims. Of the 55 to 64 age group, women accounted for 4,500 victims and men accounted for 3,900. Of the 65 and older age group, women accounted for 2,400 of self-reported violent crimes and men accounted for 1,500. Full data are available below.
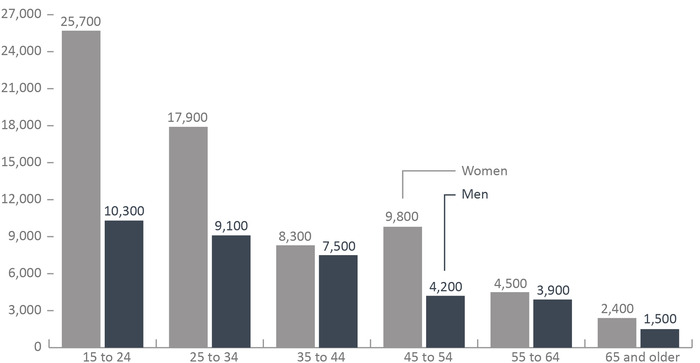
Image description
Bar graph showing the number of violent victimizations that were self-reported as being experienced by Canadians by offence type and gender per 100,000 population in calendar year 2019. Of the total number of victims of violent crime, women accounted for 10,600 of victimizations and men accounted for 5,900. Of people being sexually assaulted, women accounted for 5,000 people per 100,000 reporting this victimization in 2019 and men accounted for 900 victims per 100,000 people. Experiences of being victimized by a robbery were similar, with both women and men being victimized by this offence at a rate of about 700 victimizations per 100,000 population. For the physical assault rate, women accounted for 4,900 of the self-reported victimizations and men accounted for 4,300. Full data are available below.
Figure A7 Notes
Source: General Social Survey (GSS), Statistics Canada.
- Women were more likely to experience violent victimization than men. When broken down into types of crime, the gender difference is largely due to the substantially higher number of women who report sexual assault.
- The gender difference in self-reported crime was greatest at ages 15 to 24 (with a difference of 15,400 per 100,000), followed by ages 25 to 34 (with a difference of 8,800 per 100,000).
General Social Survey (GSS) Canadians’ Safety are reported per 1,000 population, these are converted to per 100,000 in the CCRSO for ease of comparison with police reported rates.
Total household victimization includes the following categories asked in the General Social Survey: motor vehicle/parts theft, break and enter, vandalism, theft of household property.
Total violent victimization includes the following categories asked in the General Social Survey: physical assault, sexual assault, and robbery.
The GSS Canadians’ Safety is conducted every 5 years, the most recent data available is from 2019. The GSS excludes those under age 15.
Figures A7a and A7b in the 2021 CCRSO corresponds to Figures F2a and F2b in the 2020 CCRSO. The 2020 CCRSO reported rates per 1,000 whereas in the current report, they are per 100,000 to allow for easier comparison to police-reported crime rates.
| Type of Violent Victimization | Women | Men |
|---|---|---|
Sexual Assault |
5,000 | 900 |
Robbery |
700 | 700 |
Physical Assault |
4,900 | 4,300 |
Total Violent Victimization |
10,600 | 5,900 |
| Age Group | Women | Men |
|---|---|---|
15 to 24 |
25,700 | 10,300 |
25 to 34 |
17,900 | 9,100 |
35 to 44 |
8,300 | 7,500 |
45 to 54 |
9,800 | 4,200 |
55 to 64 |
4,500 | 3,900 |
65 and older |
2,400 | 1,500 |
Table A7 Notes
Source: General Social Survey (GSS) Canadians’ Safety, Statistics Canada.
General Social Survey (GSS) Canadians’ Safety are reported per 1,000 population, these are converted to per 100,000 in the CCRSO for ease of comparison with police reported rates.
Total household victimization includes the following categories asked in the General Social Survey: motor vehicle/parts theft, break and enter, vandalism, theft of household property.
Total violent victimization includes the following categories asked in the General Social Survey: physical assault, sexual assault, and robbery.
The GSS Canadians’ Safety is conducted every 5 years, the most recent data available is from 2019. The GSS excludes those under age 15.
Tables A7a and A7b in the 2021 CCRSO corresponds to Tables F2a and F2b in the 2020 CCRSO. The 2020 CCRSO reported rates per 1,000 whereas in the current report, they are per 100,000 to allow for easier comparison to police-reported crime rates.
Self-reported victimization reported to police by crime

Image description
Bar graph showing what percentage of criminal victimizations of members of the public were also reported to a police service in calendar year 2019. Motor vehicle or parts theft was the crime most frequently reported to the police with 52 percent of victimizations of this type being reported to the police; followed by robbery with 47 percent of all victimizations being reported to the police; break and enter offences were reported to the police about 45 percent of the time; vandalism 37 percent of the time; only 36 percent of the physical assaults that were experienced were reported to the police; theft of personal property was reported to the police 28 percent of the time; theft of household property offences were reported to the police in only about 1 in 5 instances; and, finally, of the offence types for which victimization data is available, sexual assaults were only reported to the police 6 percent of the time this offence occurred. Of total household victimizations, 35 percent were reported to the police; of total violent victimizations, 24 percent were reported to the police; and of total victimizations, 29 percent were reported to the police. Full data are available below.
Figure A8 Notes
Source: General Social Survey (GSS) Canadians’ Safety, Statistics Canada.
- Motor vehicle/parts theft was most frequently reported to police with 52% of self-reported motor vehicle/parts theft reported to police. Sexual assault was least frequently reported to police, with only 6% of self-reported sexual assaults reported to police.
- Self-reported household victimization was more commonly reported to police than self-reported violent victimization.
General Social Survey (GSS) Canadians’ Safety are reported per 1,000 population, these are converted to per 100,000 in the CCRSO for ease of comparison with police reported rates.
Total household victimization includes the following categories asked in the General Social Survey: motor vehicle/parts theft, break and enter, vandalism, theft of household property.
Total violent victimization includes the following categories asked in the General Social Survey: physical assault, sexual assault, and robbery.
The GSS Canadians’ Safety is conducted every 5 years, the most recent data available is from 2019. The GSS excludes those under age 15.
Figure A8 in the 2021 CCRSO corresponds to Figure F1 in the 2020 CCRSO. The 2020 CCRSO reported rates per 1,000 whereas in the current report, they are per 100,000 to allow for easier comparison to police-reported crime rates.
| Type of Victimization | Percent Reported to Police |
|---|---|
Motor Vehicle/Parts Theft |
52 |
Robbery |
47 |
Break and Enter |
45 |
Vandalism |
37 |
Physical Assault |
36 |
Theft of Personal Property |
28 |
Theft of Household Property |
20 |
Sexual Assault |
6 |
Total Household Victimization |
35 |
Total Violent Victimization |
24 |
Total Victimization |
29 |
Table A8 Notes
Source: General Social Survey (GSS) Canadians’ Safety, Statistics Canada.
General Social Survey (GSS) Canadians’ Safety are reported per 1,000 population, these are converted to per 100,000 in the CCRSO for ease of comparison with police reported rates.
Total household victimization includes the following categories asked in the General Social Survey: motor vehicle/parts theft, break and enter, vandalism, theft of household property.
Total violent victimization includes the following categories asked in the General Social Survey: physical assault, sexual assault, and robbery.
The GSS Canadians’ Safety is conducted every 5 years, the most recent data available is from 2019. The GSS excludes those under age 15.
Table A8 in the 2021 CCRSO corresponds to Table F1 in the 2020 CCRSO. The 2020 CCRSO reported rates per 1,000 whereas in the current report, they are per 100,000 to allow for easier comparison to police-reported crime rates.
The rate of adults charged
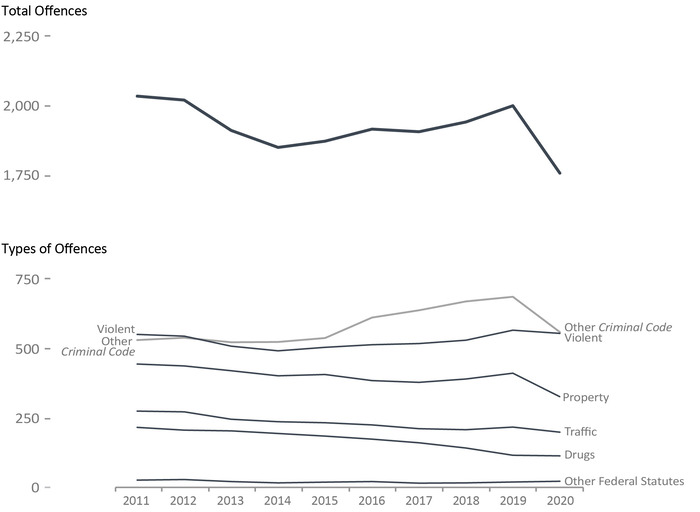
Image description
Line graph of the number of adults charged with a Criminal Code offence, by total offences and by types of offences per 100,000 population. Starting in calendar year 2011 there were just over 2,000 criminal offenders charged per 100,000 Canadians, dropping to around 1,800 offenders being charged per 100,000 between 2012 and 2018, seeing a more slight increase to nearly 2,000 offenders being charged again in 2019, precipitously dropping to nearly 1,750 offenders being charged per 100,000 in 2020. From 2011 to 2020 “Other Criminal Code” offences increased from just over 500 per 100,000 to at least 600 per 100,000 only to drop back to 500 in the year 2020. Violent crimes have remained fairly stable over this period at just over 500 charges per 100,000 population. Property offences went from under 500 per 100,000 in 2011 to under 400 by 2019, falling off quickly to around 300 by 2020. Traffic offender charges went from just over 250 per 100,000 in 2011 to less than 250 in 2020. Drug offence charges saw the most steady decline over this period dropping from just under 250 charges per 100,000 in 2011 to around 100 per 100,000 in 2020. “Other Federal statue” offences have remained stable in very low numbers at a rate far lower than 100 per 100,000 Canadians.
Figure A9 Notes
Source: Table 35-10-0177-01, Incident-based crime statistics, by detailed violations, Canada, provinces, territories and Census Metropolitan Areas
- The rate of adults charged increased 4.4% from 2016 to 2019. This was followed by a sharp decline of 12.1% between 2019 to 2020. The 2020 rate was 13.6% lower than 2011 and 8.3% lower than 2016.
- The rate of adults charged with violent crimes increased 10.3% between 2016 to 2019 and then showed a 2.1% decrease between 2019-2020. The 2020 rate is 0.7% lower than 2011 and 8.0% lower than 2016.
- The rate of adults charged with other Criminal Code offences increased by 29.6% between 2011 to 2019 and then decreased by 18.6% between 2019 and 2020.
- The rate of adults charged with Other Federal Statutes decreased 29.4% from 2011 to 2019 and then increased 15.6% from 2019 to 2020.
Other Criminal Code offences includes administration of justice violations, weapons/firearms violations, counterfeit, possession of, accessing, making or distribution of child pornography and prostitution.
Other federal statutes refer to offences against Canadian federal statutes, such as Customs Act, Employment Insurance Act, Firearms Act, Food and Drugs Act (FDA), Income Tax Act, Controlled Drugs and Substances Act (CDSA) and Narcotic Control Act (NCA). This offence category excludes Criminal Code of Canada offences.
Unlike Statistics Canada, the total crime rate in the Corrections and Conditional Release Statistical Overview includes traffic offences and violations of federal statutes to provide a measure of all criminal offences. As a result, the Total Crime Rate reported here is higher than that reported by Statistics Canada.
Violent crimes include homicide, attempted murder, assault, sexual offences, abduction, extortion, robbery, firearms, and other violent offences such as uttering threats and criminal harassment. Property crimes include break and enter, motor vehicle thefts, other thefts, possession of stolen property, fraud, mischief and arson.
The figure includes data from the most recent year available at the time of publication.
Figure A9 in the 2021 CCRSO corresponds to Figure A5 in the 2020 CCRSO.
| Year | Violent | Property | Traffic | Other CCC | Drugs | Total Other Fed. Stat. | Total Charged |
|---|---|---|---|---|---|---|---|
| 1998 | 563 | 677 | 374 | 430 | 168 | 12 | 2,236 |
| 1999 | 590 | 632 | 371 | 396 | 185 | 18 | 2,203 |
| 2000 | 615 | 591 | 349 | 411 | 198 | 16 | 2,190 |
| 2001 | 641 | 584 | 349 | 451 | 202 | 18 | 2,256 |
| 2002 | 617 | 569 | 336 | 460 | 199 | 18 | 2,211 |
| 2003 | 598 | 573 | 326 | 476 | 172 | 15 | 2,168 |
| 2004 | 584 | 573 | 314 | 490 | 187 | 22 | 2,180 |
| 2005 | 589 | 550 | 299 | 479 | 185 | 22 | 2,131 |
| 2006 | 594 | 533 | 300 | 498 | 198 | 20 | 2,150 |
| 2007 | 577 | 499 | 298 | 521 | 208 | 20 | 2,132 |
| 2008 | 576 | 487 | 307 | 540 | 207 | 22 | 2,149 |
| 2009 | 585 | 490 | 311 | 532 | 201 | 20 | 2,152 |
| 2010 | 576 | 473 | 295 | 545 | 211 | 22 | 2,132 |
| 2011 | 548 | 441 | 271 | 527 | 213 | 23 | 2,034 |
| 2012 | 541 | 434 | 269 | 536 | 203 | 25 | 2,020 |
| 2013 | 505 | 417 | 242 | 519 | 200 | 18 | 1,910 |
| 2014 | 489 | 399 | 233 | 520 | 191 | 13 | 1,849 |
| 2015 | 501 | 403 | 230 | 535 | 182 | 15 | 1,872 |
| 2016 | 511 | 381 | 222 | 609 | 171 | 18 | 1,915 |
| 2017 | 515 | 375 | 208 | 635 | 157 | 12 | 1,906 |
| 2018 | 527 | 387 | 204 | 667 | 138 | 13 | 1,941 |
| 2019 | 563 | 408 | 214 | 683 | 113 | 16 | 1,999 |
| 2020 | 551 | 324 | 196 | 556 | 110 | 19 | 1,757 |
Table A9 Notes
Source: Table 35-10-0177-01, Incident-based crime statistics, by detailed violations, Canada, provinces, territories and Census Metropolitan Areas
Other Criminal Code offences (Other CCC) includes administration of justice offences, counterfeit, weapons/firearms violations, possession of, accessing, making or distribution of child pornography and prostitution.
Other federal statutes refer to offences against Canadian federal statutes, such as Customs Act, Employment Insurance Act, Firearms Act, Food and Drugs Act (FDA), Income Tax Act, Controlled Drugs and Substances Act (CDSA) and Narcotic Control Act (NCA). This offence category excludes Criminal Code of Canada offences.
Violent crimes include homicide, attempted murder, assault, sexual offences, abduction, extortion, robbery, firearms, and other violent offences such as uttering threats and criminal harassment. Property crimes include break and enter, motor vehicle theft, other theft, possession of stolen property, fraud, mischief and arson.
Total charges in the Corrections and Conditional Release Statistical Overview includes traffic offences and violations of federal statutes to provide a measure of all criminal offences. As a result, the total charges reported here is higher than that reported by Statistics Canada.
Due to rounding, rates may not add up to totals.
The table includes data from the most recent year available at the time of publication.
Table A9 in the 2021 CCRSO corresponds to Table A5 in the 2020 CCRSO.
Criminal Code and other Federal Statute charges among adults
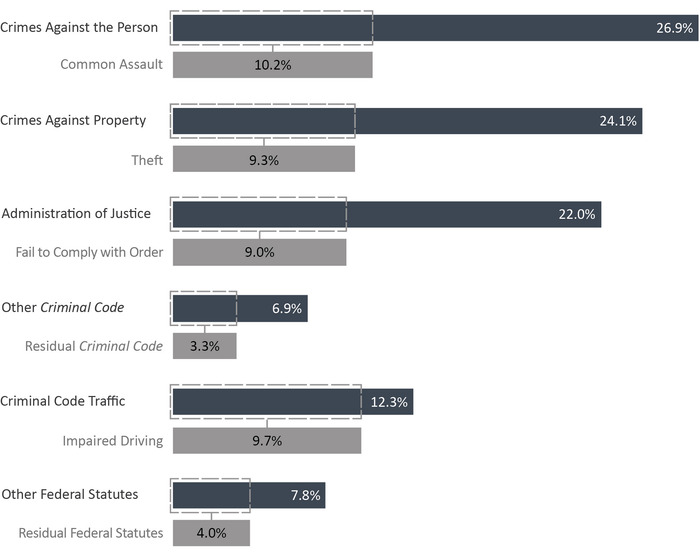
Image description
Bar graph showing Criminal Code and other Federal Statute charges among adults by type of charge in fiscal year 2019 to 20. Crimes against the person accounted for 26.9 percent of charges, with common assault representing 10.2 percent of those charges. Crimes against property accounted for 24.1 percent of charges, with theft representing 9.3 percent of those charges. Administration of justice accounted for 22.0 percent of chargers, with fail to comply with order representing 9.0 percent of those charges. Other Criminal Code accounted for 6.9 percent of charges, with residual Criminal Code representing 3.3 percent of those charges. Criminal Code Traffic accounted for 12.3 percent of charges, with impaired driving representing 9.7 percent of those charges. Finally, other Federal Statutes accounted for 7.8 percent of charges, with residual Federal Statutes representing 4.0 percent of those charges. Full data are available below.
Figure A10 Notes
Source: Table 35-10-0027-01, Integrated Criminal Court Survey, Canadian Centre for Justice and Community Safety Statistics, Statistics Canada.
- Common assault (Level 1) (10.2%), theft (9.3%) and impaired driving (9.7%) were the most frequent cases in adult courts in 2019-20.
- Administration of justice cases (offences related to case proceedings such as failure to appear in court, failure to comply with a court order, breach of probation, and unlawfully at large) accounted for 22.0% of cases completed in adult criminal courts.
Administration of justice includes the offences failure to appear, breach of probation, and unlawfully at large.
Other Criminal Code offences includes administration of justice violations, weapons/firearms violations, counterfeit, possession of, accessing, making or distribution of child pornography and prostitution.
Other federal statute offences refer to offences against Canadian federal statutes, such as Customs Act, Employment Insurance Act, Firearms Act, Food and Drugs Act, Income Tax Act, Controlled Drugs and Substances Act (CDSA) and Narcotic Control Act (NCA). This offence category excludes Criminal Code of Canada offences.
The concept of a case has changed to more closely reflect court processing. Statistics from the Integrated Criminal Court Survey used in this report should not be compared to editions of the Corrections and Conditional Release Statistical Overview prior to 2007. A case is one or more charges against an accused person or corporation, processed by the courts at the same time, and where all of the charges in the case received a final disposition. Where a case has more than one charge, it is necessary to select a charge to represent the case. An offence is selected by applying two rules. First, the most serious decision rule is applied. In cases where two or more offences have the same decision, the most serious offence rule is applied. All charges are ranked according to an offence seriousness scale. Superior Court data are not reported to the Integrated Criminal Court Survey for Prince Edward Island, Quebec, Ontario, Manitoba and Saskatchewan. In addition, information from Quebec's municipal courts is not collected.
The Canadian Centre for Justice and Community Safety Statistics continues to make updates to the offence library used to classify offence data sent by the provinces and territories. These improvements have resulted in minor changes in the counts of charges and cases as well as the distributions by type of offence. Data presented have been revised to account for these updates.
Due to rounding, percentages may not add up to 100 percent.
The figure includes data from the most recent year available at the time of publication.
Figure A10 in the 2021 CCRSO corresponds to Figure A6 in the 2020 CCRSO.
| Type of Charge | 2015-16 | 2016-17 | 2017-18 | 2018-19 | 2019-20 |
|---|---|---|---|---|---|
Crimes Against the Person |
80,824 | 85,112 | 89,159 | 82,797 | 84,052 |
Homicide and Related |
259 | 364 | 376 | 334 | 316 |
Attempted Murder |
206 | 203 | 202 | 214 | 167 |
Robbery |
3,358 | 3,576 | 3,535 | 3,091 | 3,102 |
Sexual Assault |
2,844 | 3,109 | 3,277 | 3,325 | 3,494 |
Other Sexual Offences |
3,695 | 3,950 | 4,345 | 3,971 | 3,941 |
Major Assault (Levels 2 & 3) |
18,900 | 20,201 | 20,804 | 19,604 | 20,326 |
Common Assault (Level 1) |
30,494 | 31,647 | 35,112 | 32,247 | 31,912 |
Uttering Threats |
14,879 | 15,261 | 13,912 | 12,966 | 13,597 |
Criminal Harassment |
3,345 | 3,538 | 3,749 | 3,310 | 3,590 |
Other Crimes Against Persons |
2,844 | 3,263 | 3,847 | 3,735 | 3,607 |
Crimes Against Property |
81,187 | 85,467 | 82,529 | 73,682 | 75,067 |
Theft |
35,197 | 36,138 | 32,710 | 28,292 | 29,108 |
Break and Enter |
9,325 | 9,968 | 9,706 | 9,179 | 9,494 |
Fraud |
11,476 | 12,728 | 12,599 | 11,005 | 11,235 |
Mischief |
12,411 | 12,955 | 13,165 | 12,111 | 11,941 |
Possession of Stolen Property |
10,929 | 11,646 | 11,981 | 10,593 | 10,680 |
Other Property Crimes |
1,849 | 2,032 | 2,368 | 2,502 | 2,609 |
Administration of Justice |
78,195 | 80,940 | 73,809 | 67,925 | 68,492 |
Fail to Appear |
4,113 | 4,442 | 4,159 | 4,461 | 4,126 |
Breach of Probation |
30,396 | 30,955 | 29,008 | 26,047 | 27,169 |
Unlawfully at Large |
2,591 | 2,693 | 2,872 | 2,705 | 2,714 |
Fail to Comply with Order |
33,290 | 34,632 | 30,080 | 27,680 | 27,721 |
Other Admin. Justice |
7,805 | 8,218 | 7,690 | 7,032 | 6,762 |
Other Criminal Code |
18,552 | 20,447 | 23,458 | 22,007 | 21,545 |
Weapons |
10,340 | 10,958 | 11,322 | 10,704 | 10,734 |
Prostitution |
172 | 402 | 52 | 23 | 10 |
Disturbing the Peace |
1,054 | 938 | 740 | 632 | 625 |
Residual Criminal Code |
6,986 | 8,149 | 11,344 | 10,648 | 10,176 |
Criminal Code Traffic |
46,086 | 45,833 | 44,197 | 39,346 | 38,423 |
Impaired Driving |
36,308 | 35,993 | 34,941 | 30,721 | 30,104 |
Other CC Traffic |
9,778 | 9,840 | 9,256 | 8,625 | 8,319 |
Other Federal Statutes |
39,390 | 38,371 | 36,302 | 29,691 | 24,361 |
Drug Possession |
12,517 | 10,675 | 8,592 | 6,531 | 4,925 |
Other Drug Offences |
8,550 | 8,506 | 8,139 | 7,429 | 6,434 |
Residual Federal Statutes |
17,147 | 18,179 | 18,695 | 14,975 | 12,336 |
| Total Offences | 344,234 | 356,170 | 349,454 | 315,448 | 311,940 |
Table A10 Notes
Source: Table 35-10-0027-01, Integrated Criminal Court Survey, Canadian Centre for Justice and Community Safety Statistics, Statistics Canada.
Administration of justice includes the offences failure to appear, breach of probation, and unlawfully at large.
Other Criminal Code offences includes administration of justice violations, weapons/firearms violations, counterfeit, possession of, accessing, making or distribution of child pornography and prostitution.
Other federal statute offences refer to offences against Canadian federal statutes, such as Customs Act, Employment Insurance Act, Firearms Act, Food and Drugs Act (FDA), Income Tax Act, Controlled Drugs and Substances Act (CDSA) and Narcotic Control Act (NCA). This offence category excludes Criminal Code of Canada offences.
The concept of a case has changed to more closely reflect court processing. Statistics from the Integrated Criminal Court Survey used in this report should not be compared to editions of the Corrections and Conditional Release Statistical Overview prior to 2007. A case is one or more charges against an accused person or corporation, processed by the courts at the same time, and where all of the charges in the case received a final disposition. Where a case has more than one charge, it is necessary to select a charge to represent the case. An offence is selected by applying two rules. First, the most serious decision rule is applied. In cases where two or more offences have the same decision, the most serious offence rule is applied. All charges are ranked according to an offence seriousness scale. Superior Court data are not reported to the Integrated Criminal Court Survey for Prince Edward Island, Quebec, Ontario, Manitoba and Saskatchewan. In addition, information from Quebec's municipal courts is not collected.
The Canadian Centre for Justice and Community Safety Statistics continues to make updates to the offence library used to classify offence data sent by the provinces and territories. These improvements have resulted in minor changes in the counts of charges and cases as well as the distributions by type of offence. Data presented have been revised to account for these updates.
Due to rounding, percentages may not add up to 100 percent.
The table includes data from the most recent year available at the time of publication.
Table A10 in the 2021 CCRSO corresponds to Table A6 in the 2020 CCRSO.
Decisions in adult criminal court
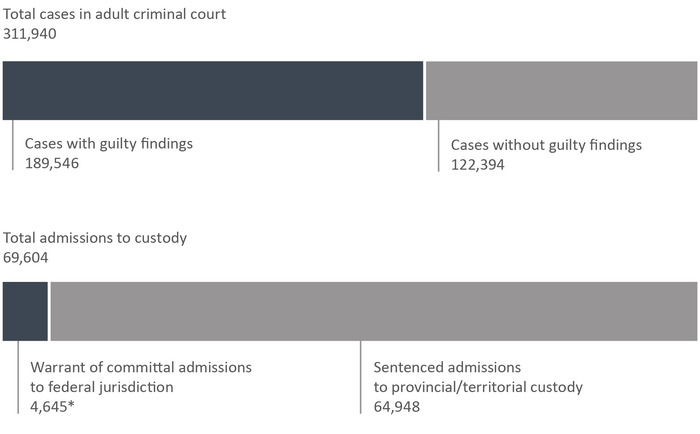
Image description
Bar illustration showing the number of cases in adult criminal court and admissions to custody in the 2019 to 20 fiscal year. Of the total number of cases in adult criminal court, which was 311,940 cases, the number of cases with guilty findings accounted for 189,546 cases and cases without guilting findings accounted for 122,394 cases. Of the total admissions to custody, which was 69,904 cases, warrant of committal admissions to federal jurisdiction accounted for 4,645 cases and sentenced admissions to provincial or territorial custody accounted for 64,948 cases. Full data are available below.
Figure A11 Notes
Sources: Table 35-10-0027-01, Integrated Criminal Court Survey, Canadian Centre for Justice and Community Safety Statistics, Statistics Canada; Table 35-10-0018-01, Adult Correctional Services, Canadian Centre for Justice and Community Safety Statistics, Statistics Canada;
Correctional Service of Canada.
- During 2019-20, there were 4,645Footnote * warrant of committal admissions to a federal institution or Healing Lodge.
- In 2019-20, there were 189,546 cases with guilty findings in adult criminal court.
- In 2019-20, there were 64,948 sentenced admissions to provincial/territorial custody, compared to 4,645 warrant of committal admissions for offenders sentenced to a federal institution or Healing Lodge.
The decision type guilty includes guilty of the offence, of an included offence, of an attempt of the offence, or of an attempt of an included offence. This category also includes cases where an absolute or conditional discharge has been imposed.
This figure only includes cases in provincial court and partial data from Superior Court. Superior Court data are not reported to the Integrated Criminal Court Survey for Prince Edward Island, Quebec, Ontario, Manitoba and Saskatchewan. Information from Quebec's municipal courts is not collected.
These numbers refer to the total number of admissions to a federal institution or Healing Lodge during each fiscal year and may be greater than the actual number of offenders admitted, since an individual offender may be admitted more than once in a given year.
The concept of a case has changed to more closely reflect court processing. Statistics from the Integrated Criminal Court Survey used in this report should not be compared to editions of the Corrections and Conditional Release Statistical Overview prior to 2007. A case is one or more charges against an accused person or corporation, processed by the courts at the same time, and where all of the charges in the case received a final disposition.
Court and prison data are reported on a fiscal year basis (April 1 through March 31).
There is a lag in the data entry of admissions into CSC's Offender Management System. The admission figures for the most recent year are under-reported by 200-400 admissions at the time of year end data extraction. More accurate figures will be available in the next year's publication. Please use caution when including the most recent year in any trend analysis.
The figure includes data from the most recent year available at the time of publication.
Figure A11 in the 2021 CCRSO corresponds to Figure A8 in the 2020 CCRSO.
| 2016-17 | 2017-18 | 2018-19 | 2019-20 | 2020-21 | |
|---|---|---|---|---|---|
| Total Case DecisionsFootnote * in Adult Criminal CourtFootnote 1 | 356,170 | 349,454 | 315,448 | 311,940 | Not availableFootnote ** |
| Cases with Guilty Findings in Adult Criminal CourtFootnote 1 | 224,410 | 217,433 | 193,889 | 189,546 | Not availableFootnote ** |
| Total Cases without Guilty Findings in Criminal CourtFootnote 1 | 131,760 | 132,021 | 121,559 | 122,394 | Not availableFootnote ** |
AcquittedFootnote 1 |
13,029 | 12,637 | 11,340 | 9,714 | Not availableFootnote ** |
Stayed or withdrawnFootnote 1 |
114,554 | 115,291 | 106,200 | 109,008 | Not availableFootnote ** |
Other decisionsFootnote 1 |
4,177 | 4,093 | 4,019 | 3,672 | Not availableFootnote ** |
| Sentenced Admissions to Provincial/Territorial CustodyFootnote 2 | 84,543 | 80,759 | 72,312 | 64,948 | Not availableFootnote ** |
| Warrant of Committal-Admission to FED (CSC)Footnote 3 | 4,907 | 5,001 | 5,014 | 4,645 | 3,133 |
Table A11 Notes
The decision type guilty includes guilty of the offence, of an included offence, of an attempt of the offence, or of an attempt of an included offence. This category also includes cases where an absolute or conditional discharge has been imposed. This figure only includes cases convicted in provincial court and partial data from Superior Court. Superior Court data are not reported to the Integrated Criminal Court Survey for Prince Edward Island, Quebec, Ontario, Manitoba and Saskatchewan. Information from Quebec's municipal courts is not collected.
Police data are reported on a calendar year basis whereas court and prison data are reported on a fiscal year basis (April 1 through March 31).
These numbers refer to the total number of admissions to a federal institution or Healing Lodge during each fiscal year and may be greater than the actual number of offenders admitted, since an individual offender may be admitted more than once in a given year.
There is a lag in the data entry of admissions into CSC's Offender Management System. The admission figures for the most recent year are under-reported by 200-400 admissions at the time of year end data extraction. More accurate figures will be available in the next year's publication. Please use caution when including the most recent year in any trend analysis.
Table A11 in the 2021 CCRSO corresponds to Table A8 in the 2020 CCRSO.
Length of adult custodial sentences
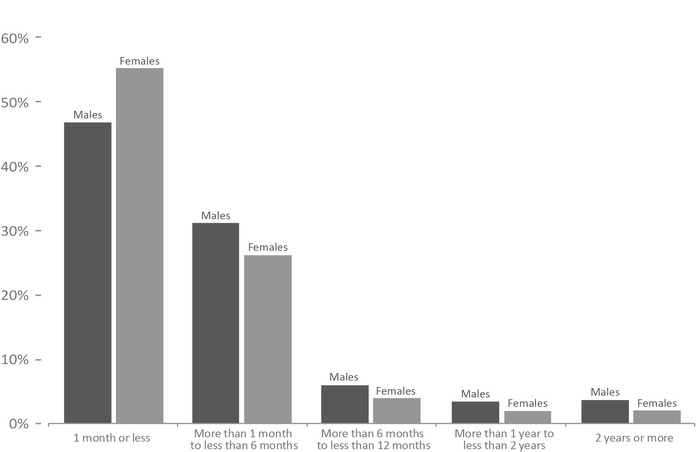
Image description
Bar graph showing the length of adult prison sentences ordered by the court by gender in the 2019 to 20 fiscal year. Women accounted for more sentences of 1 month or less than men. Men accounted for more sentences than women across all other sentence lengths, including: 1 month to 6 months; 6 months to 12 months; 1 year to 2 years; and 2 years or more. Full data are available below.
Figure A12 Notes
Source: Table 35-10-0032-01, Integrated Criminal Court Survey, Canadian Centre for Justice and Community Safety Statistics, Statistics Canada.
- Just under half (44.8%) of all custodial sentences imposed by adult criminal courts were one month or less.
- Prison sentences for males tended to be longer than for females.
- 55.1% of females and 46.7% of males who were incarcerated following a guiltyFootnote * finding received a sentence of one month or less, and 81.2% of females and 77.8% of males received a sentence of six months or less.
Length unknown includes indeterminate custody sentences. In some provinces/territories, particularly British Columbia, Saskatchewan, Quebec and New Brunswick, the unknown category may include guilty cases with custody where the custodial sentence ordered has already been served and the time remaining is equal to zero.
The concept of a case has changed to more closely reflect court processing. Statistics from the Integrated Criminal Court Survey used in this report should not be compared to editions of the Corrections and Conditional Release Statistical Overview prior to 2007.
Superior Court data are not reported to the Integrated Criminal Court Survey for Prince Edward Island, Quebec, Ontario, Manitoba and Saskatchewan. In addition, information from Quebec's municipal courts is not collected.
The Canadian Centre for Justice and Community Safety Statistics continues to make updates to the offence library used to classify offence data sent by the provinces and territories. These improvements have resulted in minor changes in the counts of charges and cases as well as the distributions by type of offence. Data presented have been revised to account for these updates.
Due to rounding, totals may not add up to 100 percent.
The figure includes data from the most recent year available at the time of publication.
Figure A12 in the 2021 CCRSO corresponds to Figure A7 in the 2020 CCRSO.
| Length of Prison Sentence | 2015-16 | 2016-17 | 2017-18 | 2018-19 | 2019-20 |
|---|---|---|---|---|---|
| % | % | % | % | % | |
| 1 month or less | |||||
Females |
64.4 | 63.7 | 62.8 | 59.5 | 55.1 |
Males |
51.9 | 52.0 | 50.3 | 49.4 | 46.7 |
Total |
49.4 | 49.4 | 47.8 | 46.9 | 44.8 |
| More than 1 month up to 6 months | |||||
Females |
22.8 | 22.0 | 22.2 | 23.8 | 26.1 |
Males |
30.4 | 29.9 | 30.1 | 29.9 | 31.1 |
Total |
27.7 | 27.2 | 27.2 | 27.3 | 28.5 |
| More than 6 months up to 12 months | |||||
Females |
3.3 | 3.3 | 3.6 | 3.3 | 3.8 |
Males |
5.5 | 5.2 | 5.4 | 5.4 | 5.8 |
Total |
5.0 | 4.7 | 4.9 | 4.9 | 5.2 |
| More than 1 year up to less than 2 years | |||||
Females |
1.7 | 1.7 | 1.7 | 1.8 | 1.8 |
Males |
3.3 | 3.0 | 3.2 | 3.2 | 3.3 |
Total |
3.0 | 2.8 | 2.8 | 2.9 | 3.0 |
| 2 years or More | |||||
Females |
2.2 | 2.1 | 1.9 | 2.1 | 1.9 |
Males |
3.6 | 3.4 | 3.6 | 3.7 | 3.5 |
Total |
3.2 | 3.0 | 3.1 | 3.3 | 3.1 |
| Length unknown | |||||
Females |
5.5 | 7.2 | 7.8 | 9.6 | 11.3 |
Males |
5.3 | 6.5 | 7.4 | 8.3 | 9.5 |
Total |
11.7 | 12.9 | 14.1 | 14.8 | 15.4 |
Table A12 Notes
Source: Table 35-10-0032-01, Integrated Criminal Court Survey, Canadian Centre for Justice and Community Safety Statistics, Statistics Canada.
Total includes the following categories: Males, Females, Company, and Sex Unknown.
Length unknown includes indeterminate custody sentences. In some provinces/territories, particularly British Columbia, Saskatchewan, Quebec and New Brunswick, the unknown category may include guilty cases with custody where the custodial sentence ordered has already been served and the time remaining is equal to zero.
The concept of a case has changed to more closely reflect court processing. Statistics from the Integrated Criminal Court Survey used in this report should not be compared to editions of the Corrections and Conditional Release Statistical Overview prior to 2007.
Superior Court data are not reported to the Integrated Criminal Court Survey for Prince Edward Island, Quebec, Ontario, Manitoba and Saskatchewan. In addition, information from Quebec's municipal courts is not collected.
The Canadian Centre for Justice and Community Safety Statistics continues to make updates to the offence library used to classify offence data sent by the provinces and territories. These improvements have resulted in minor changes in the counts of charges and cases as well as the distributions by type of offence. Data presented have been revised to account for these updates.
Due to rounding, totals may not add up to 100 percent.
The table includes data from the most recent year available at the time of publication.
Table A12 in the 2021 CCRSO corresponds to Table A7 in the 2020 CCRSO.
The rate of youth charged

Image description
Line graph of the rate of youth charged with a criminal offence, by total offences, and by offence type, from calendar year 2011 to 2020. The total number of youth charged went from over 2,600 per 100,000 young Canadians to close to 1,000 youth being charged in 2020. The charging rates for youth in specific crime categories did not decline as quickly. All rates except that for violent crime and traffic offences declined every year between 2011 and 2020. Violent crime declined from over 800 per 100,000 in 2011 to a low of just over 600 in 2015, rising again to close to 700 per 100,00 in 2019, to decline steeply to closer to 500 in 2020. From 2011 to 2020, youth charged with property offences went from around 800 per 100,000 Canadian youth to close to 200; “Other Criminal Code” offences went from around 600 to around 300; drug offences went from about 250 charges per 100,000 to about only 10 youth being charged per 100,000; “other Federal statute” offences declined from a handful of cases to nearly zero. Criminal traffic offences declined from about 15 per 100,000 to nearly zero over the period.
Figure A13 Notes
Source: Table 35-10-0177-01, Uniform Crime Reporting Survey, Canadian Centre for Justice and Community Safety Statistics, Statistics Canada.
- Since 2011, the rate of youth charged decreased by 60.4%. There was a sharp decline of 29.8% between 2019 to 2020.
- Between 2016 to 2019 there was 10.7% increase in the rate of youth charged with a violent crime followed by a 24.7% decrease between 2019 to 2020. The rate of youth charged with violent crimes is 16.7% lower than 2016.
- Between 2016 to 2019 there was a decrease in all non-violent crime categories. The largest decline was a 65.1% decline in charges for drug offences. The decline in youth charged continued between 2019 to 2020. The largest decline was a 39.7% decline in charges for property crime between 2019 to 2020.
Other Criminal Code offences includes administration of justice violations, weapons/firearms violations, counterfeit, possession of, accessing, making or distribution of child pornography and prostitution.
For criminal justice purposes, youth are defined under Canadian law as persons aged 12 to 17.
Rates are based on 100,000 youth population (12 to 17 years old).
Violent crimes include homicide, attempted murder, assault, sexual offences, abduction, extortion, robbery, firearms, and other violent offences such as uttering threats and criminal harassment. Property crimes include break and enter, motor vehicle theft, other theft, possession of stolen property, fraud, mischief and arson.
The total charges in the Corrections and Conditional Release Statistical Overview includes traffic offences and violations of federal statutes to provide a measure of all criminal charges. As a result, the total charges reported here is higher than that reported by Statistics Canada.
The figure includes data from the most recent year available at the time of publication.
Figure A13 in the 2021 CCRSO corresponds to Figure A9 in the 2020 CCRSO.
| Year | Violent | Property | Traffic | Other CCC | Drugs | Total Other Fed. Stat. | Total Charged |
|---|---|---|---|---|---|---|---|
| 1998 | 994 | 2500 | -- |
870 | 226 | 4 | 4,595 |
| 1999 | 1060 | 2237 | -- |
728 | 266 | 2 | 4,293 |
| 2000 | 1136 | 2177 | -- |
760 | 317 | 4 | 4,393 |
| 2001 | 1157 | 2119 | -- |
840 | 343 | 6 | 4,466 |
| 2002 | 1102 | 2009 | -- |
793 | 337 | 6 | 4,247 |
| 2003 | 953 | 1570 | -- |
726 | 208 | 5 | 3,464 |
| 2004 | 918 | 1395 | -- |
691 | 230 | 5 | 3,240 |
| 2005 | 924 | 1276 | -- |
660 | 214 | 10 | 3,084 |
| 2006 | 917 | 1216 | -- |
680 | 240 | 16 | 3,068 |
| 2007 | 943 | 1211 | 75 | 732 | 260 | 17 | 3,239 |
| 2008 | 909 | 1130 | 74 | 730 | 267 | 19 | 3,130 |
| 2009 | 888 | 1143 | 68 | 698 | 238 | 30 | 3,065 |
| 2010 | 860 | 1035 | 62 | 669 | 255 | 31 | 2,912 |
| 2011 | 806 | 904 | 58 | 636 | 263 | 31 | 2,697 |
| 2012 | 765 | 842 | 58 | 629 | 240 | 20 | 2,556 |
| 2013 | 692 | 722 | 45 | 554 | 229 | 10 | 2,252 |
| 2014 | 625 | 625 | 42 | 526 | 198 | 6 | 2,022 |
| 2015 | 614 | 603 | 44 | 518 | 159 | 10 | 1,946 |
| 2016 | 634 | 503 | 40 | 512 | 135 | 11 | 1,836 |
| 2017 | 668 | 459 | 37 | 482 | 117 | 6 | 1,769 |
| 2018 | 655 | 399 | 34 | 427 | 87 | 5 | 1,607 |
| 2019 | 702 | 348 | 33 | 384 | 47 | 6 | 1,521 |
| 2020 | 528 | 210 | 31 | 254 | 38 | 6 | 1,068 |
Table A13 Notes
Source: Table 35-10-0177-01, Incident-based crime statistics, by detailed violations, Canada, provinces, territories and Census Metropolitan Areas
Other Criminal Code offences (Other CCC) includes administration of justice violations, weapons/firearms violations, counterfeit, possession of, accessing, making or distribution of child pornography and prostitution.
For criminal justice purposes, youth are defined under Canadian law as persons age 12 to 17.
Rates are based on 100,000 youth population (12 to 17 years old). Violent crimes include homicide, attempted murder, assault, sexual offences, abduction, extortion, robbery, firearms, and other violent offences such as uttering threats and criminal harassment. Property crimes include break and enter, motor vehicle theft, other theft, possession of stolen property, fraud, mischief and arson.
Total charges in the Corrections and Conditional Release Statistical Overview includes traffic offences and violations of federal statutes to provide a measure of all criminal offences. As a result, the total charges reported here is higher than that reported by Statistics Canada.
The table includes data from the most recent year available at the time of publication
Table A13 in the 2021 CCRSO corresponds to Table A9 in the 2020 CCRSO.
Criminal Code and other Federal Statute charges among youth

Image description
Bar graph showing the proportion of all Criminal Code and other federal statute crime types that were charged against youth offenders, highlighting the most common offence in the offence category, for the 2019 to 20 fiscal year. Crimes against the person accounted for 46.1 percent of total charges against youthful offenders, with common assault representing 12.7 percent of those charges. Crimes against property accounted for 27.4 percent of total charges, with theft representing 8.8 percent of those charges. Administration of justice accounted for 8.0 percent of total charges, with fail to comply with order representing 4.8 percent of those charges. Other Criminal Code accounted for 7.6 percent of total charges, with weapons or firearms representing 6.1 percent of those charges. Other Federal Statutes accounted for 9.3 percent of total charges, with Youth Criminal Justice Act representing 6.2 percent of those charges. Finally, Criminal Code traffic accounted for 1.6 percent of total charges. Full data are available below.
Figure A14 Notes
Source: Table 35-10-0038-01, Integrated Criminal Court Survey, Canadian Centre for Justice and Community Safety Statistics, Statistics Canada.
- Common assault was the most frequent case in youth court (12.7%), closely followed by theft (8.8%).
- Administration of justice cases (offences related to case proceedings such as failure to appear in court, failure to comply with a court order, breach of probation, and unlawfully at large) accounted for 8.0% of cases completed in youth criminal courts.
Administration of justice includes the offences failure to appear, breach of probation, and unlawfully at large.
Other Criminal Code offences includes administration of justice violations, weapons/firearms violations, counterfeit, possession of, accessing, making or distribution of child pornography and prostitution.
Other federal statute offences refer to offences against Canadian federal statutes, such as Customs Act, Employment Insurance Act, Firearms Act, Food and Drugs Act (FDA), Income Tax Act, Controlled Drugs and Substances Act (CDSA) and Narcotic Control Act (NCA). This offence category excludes Criminal Code of Canada offences.
Youth Criminal Justice Act offences include failure to comply with a disposition or undertaking, contempt against youth court, assisting a youth to leave a place of custody and harbouring a youth unlawfully at large. Also included are similar offences under the Young Offenders Act, which preceded the Youth Criminal Justice Act.
The concept of a case has changed to more closely reflect court processing. Statistics from the Integrated Criminal Court Survey used in this report should not be compared to editions of the Corrections and Conditional Release Statistical Overview prior to 2007. A case is one or more charges against an accused person or corporation, processed by the courts at the same time, and where all of the charges in the case received a final disposition. Where a case has more than one charge, it is necessary to select a charge to represent the case. An offence is selected by applying two rules. First, the most serious decision rule is applied. In cases where two or more offences have the same decision, the most serious offence rule is applied. All charges are ranked according to an offence seriousness scale.
The Canadian Centre for Justice and Community Safety Statistics continues to make updates to the offence library used to classify offence data sent by the provinces and territories. These improvements have resulted in minor changes in the counts of charges and cases as well as the distributions by type of offence. Data presented have been revised to account for these updates.
The figure includes data from the most recent year available at the time of publication.
Figure A14 in the 2021 CCRSO corresponds to Figure A10 in the 2020 CCRSO.
| 2015-16 | 2016-17 | 2017-18 | 2018-19 | 2019-20 | |
|---|---|---|---|---|---|
| Crimes Against the Person | 9,653 | 9,917 | 10,586 | 10,183 | 10,174 |
Common Assault |
2,586 | 2,641 | 2,923 | 2,651 | 2,794 |
Major Assault |
2,094 | 2,149 | 2,154 | 2,076 | 2,099 |
Sexual Assault/Other Sexual Offences |
1,442 | 1,536 | 1,701 | 1,794 | 1,780 |
Robbery |
1,475 | 1,516 | 1,650 | 1,524 | 1,467 |
Homicide and Attempted Murder |
55 | 54 | 43 | 49 | 41 |
Other Crimes Against the Person |
2,001 | 2,021 | 2,115 | 1,977 | 1,993 |
| Crimes Against Property | 10,652 | 9,627 | 8,609 | 7,211 | 6,038 |
Theft |
3,671 | 3,280 | 2,822 | 2,397 | 1,951 |
Break and Enter |
2,386 | 2,193 | 1,854 | 1,502 | 1,126 |
Mischief |
2,091 | 1,819 | 1,676 | 1,460 | 1,280 |
Possession of Stolen Property |
1,817 | 1,621 | 1,490 | 1,183 | 1,060 |
Fraud |
377 | 423 | 405 | 385 | 378 |
Other Crimes Against Property |
310 | 291 | 362 | 284 | 243 |
| Administration of Justice | 3,394 | 3,113 | 2,528 | 2,155 | 1,766 |
Failure to Comply with Order |
2,209 | 2,067 | 1,590 | 1,370 | 1,070 |
Other Administration of Justice |
1,185 | 1,046 | 938 | 764 | 696 |
| Other Criminal Code | 1,946 | 1,888 | 1,875 | 1,650 | 1,688 |
Weapons/Firearms |
1,406 | 1,408 | 1,433 | 1,293 | 1,344 |
Residual Criminal Code |
468 | 416 | 406 | 331 | 310 |
Disturbing the Peace |
65 | 50 | 33 | 26 | 33 |
Prostitution |
7 | 14 | 3 | 0 | 1 |
| Criminal Code Traffic | 569 | 554 | 490 | 426 | 360 |
| Other Federal Statutes | 5,504 | 4,609 | 3,831 | 3,031 | 2,045 |
Drug Possession |
1,551 | 1,129 | 930 | 703 | 254 |
Other Drug Offences |
725 | 653 | 540 | 461 | 326 |
Youth Criminal Justice Act |
3,094 | 2,701 | 2,317 | 1,837 | 1,371 |
Residual Federal Statutes |
134 | 126 | 44 | 30 | 94 |
| Total | 31,718 | 29,708 | 27,919 | 24,656 | 22,071 |
Table A14 Notes
Source: Table 35-10-0038-01, Integrated Criminal Court Survey, Canadian Centre for Justice and Community Safety Statistics, Statistics Canada.
Administration of justice includes the offences failure to appear, breach of probation, and unlawfully at large.
Other Criminal Code offences includes administration of justice violations, weapons/firearms violations, counterfeit, possession of, accessing, making or distribution of child pornography and prostitution.
Other federal statute offences refer to offences against Canadian federal statutes, such as Customs Act, Employment Insurance Act, Firearms Act, Food and Drugs Act (FDA), Income Tax Act, Controlled Drugs and Substances Act (CDSA) and Narcotic Control Act (NCA). This offence category excludes Criminal Code of Canada offences.
Youth Criminal Justice Act offences include failure to comply with a disposition or undertaking, contempt against youth court, assisting a youth to leave a place of custody and harbouring a youth unlawfully at large. Also included are similar offences under the Young Offenders Act, which preceded the Youth Criminal Justice Act.
The concept of a case has changed to more closely reflect court processing. Statistics from the Integrated Criminal Court Survey used in this report should not be compared to editions of the Corrections and Conditional Release Statistical Overview prior to 2007. A case is one or more charges against an accused person or corporation, processed by the courts at the same time, and where all of the charges in the case received a final disposition. Where a case has more than one charge, it is necessary to select a charge to represent the case. An offence is selected by applying two rules. First, the most serious decision rule is applied. In cases where two or more offences have the same decision, the most serious offence rule is applied. All charges are ranked according to an offence seriousness scale.
The Canadian Centre for Justice and Community Safety Statistics continues to make updates to the offence library used to classify offence data sent by the provinces and territories. These improvements have resulted in minor changes in the counts of charges and cases as well as the distributions by type of offence. Data presented have been revised to account for these updates.
The table includes data from the most recent year available at the time of publication.
Table A14 in the 2021 CCRSO corresponds to Table A10 in the 2020 CCRSO.
Youth criminal court sentences: 5-year trend

Image description
Line graph showing the percentages of the types of sentences received in youth criminal court from fiscal year 2015 to 16 until fiscal year 2019 to 20. The proportion of sentences that were for deferred custody and supervision, as well as for fines, were both relatively low at under 5 percent of sentences received by youth offenders. Custody sentences represented 14.9 percent of sentences in fiscal year 2015 to 16, gradually decreasing to 12 percent of sentences in fiscal year 2019 to 20. The trend of community service order began at 24.4 percent, dropping and rising slightly each year with 21.7 percent in fiscal year 2019. The trend for other sentences began at 35.2 percent and rose until it reached its peak in fiscal year 2019 to 20 at 42.3 percent. Lastly, the probation trend increased steadily from 57.2 percent in fiscal year 2015 to 16 to its peak of 59 percent in fiscal year 2019 to 20. Full data are available immediately below.
Figure A15 Notes
Source: Table 35-10-0041-01, Integrated Criminal Court Survey, Canadian Centre for Justice and Community Safety Statistics, Statistics Canada.
- Probation has consistently been the most common sentence in youth criminal court. In 2019-20, 59.0% of youth found guilty were sentenced to probation.
- Custody sentences have been declining in the last 5 years with this decline more pronounced among females than males. In 2019-20, 12.0% of all guilty cases resulted in the youth being sentenced to custody. Among females 6.3% of guilty cases resulted in custody sentences and among males 13.3% of guilty cases resulted in a custody sentence.
Other sentence includes absolute discharge, restitution, prohibition, seizure, forfeiture, compensation, pay purchaser, essays, apologies, counselling programs and conditional discharge, conditional sentence, intensive support and supervision, attendance at non-residential program(s) and reprimand. This category also includes intensive support and supervision, attendance at non-residential program(s) and reprimand where sentencing data under the Youth Criminal Justice Act are not available.
Cases can have more than one sentence. Therefore, sanctions are not mutually exclusive and will not add to 100%. For all sentencing tables, data are for cases with a guilty finding only. Sentencing information is not available for a small proportion of guilty cases (i.e., approximately 3%, overall). For all sentencing tables, data are for cases with a guilty finding only and for which sentencing information is reported.
The concept of a case has changed to more closely reflect court processing. Statistics from the Integrated Criminal Court Survey used in this report should not be compared to editions of the Corrections and Conditional Release Statistical Overview prior to 2007.
The figure includes data from the most recent year available at the time of publication.
Figure A15 in the 2021 CCRSO corresponds to Figure A11 in the 2020 CCRSO.
| Type of Sentence | Sex | Year | ||||
|---|---|---|---|---|---|---|
| 2015-16 | 2016-17 | 2017-18 | 2018-19 | 2019-20 | ||
| % | % | % | % | % | ||
| Probation | Female | 53.6 | 54.1 | 54.7 | 51.7 | 53.3 |
| Male | 59.3 | 58.8 | 59.9 | 60.5 | 60.5 | |
| Total | 57.2 | 56.3 | 57.3 | 58.5 | 59.0 | |
| Custody | Female | 11.7 | 11.9 | 7.5 | 8.9 | 6.3 |
| Male | 15.9 | 16.5 | 13.7 | 13.5 | 13.3 | |
| Total | 14.9 | 15.5 | 13.0 | 12.8 | 12.0 | |
| Community Service Order | Female | 23.5 | 20.9 | 21.9 | 21.6 | 21.4 |
| Male | 27.1 | 24.4 | 24.9 | 24.2 | 22.7 | |
| Total | 24.4 | 22.4 | 22.9 | 23.0 | 21.7 | |
| Fine | Female | 2.8 | 2.9 | 2.4 | 2.0 | 2.4 |
| Male | 2.9 | 2.9 | 2.5 | 2.3 | 2.1 | |
| Total | 2.8 | 2.9 | 2.5 | 2.2 | 2.2 | |
| Deferred Custody and Supervision | Female | 3.3 | 3.9 | 3.3 | 3.4 | 3.1 |
| Male | 4.4 | 4.7 | 4.8 | 5.3 | 4.9 | |
| Total | 4.1 | 4.4 | 4.5 | 4.7 | 4.4 | |
| Other Sentence | Female | 35.5 | 37.7 | 38.5 | 41.7 | 41.8 |
| Male | 38.4 | 39.8 | 40.6 | 42.4 | 43.3 | |
| Total | 35.2 | 36.7 | 37.3 | 41.1 | 42.3 | |
Table A15 Notes
Source: Table 35-10-0041-01, Integrated Criminal Court Survey, Canadian Centre for Justice and Community Safety Statistics, Statistics Canada.
Other sentence includes absolute discharge, restitution, prohibition, seizure, forfeiture, compensation, pay purchaser, essays, apologies, counselling programs and conditional discharge, conditional sentence, intensive support and supervision, attendance at non-residential program(s) and reprimand. This category also includes intensive support and supervision, attendance at non-residential program(s) and reprimand where sentencing data under the Youth Criminal Justice Act are not available.
Cases can have more than one sentence. Therefore, sanctions are not mutually exclusive and will not add to 100%. For all sentencing tables, data are for cases with a guilty finding only. Sentencing information is not available for a small proportion of guilty cases (i.e., approximately 3%, overall). For all sentencing tables, data are for cases with a guilty finding only and for which sentencing information is reported.
The concept of a case has changed to more closely reflect court processing. Statistics from the Integrated Criminal Court Survey used in this report should not be compared to editions of the Corrections and Conditional Release Statistical Overview prior to 2007.
The table includes data from the most recent year available at the time of publication.
Table A15 in the 2021 CCRSO corresponds to Table A11 in the 2020 CCRSO.
Youth criminal court sentences for most serious sentence: 5-year trend
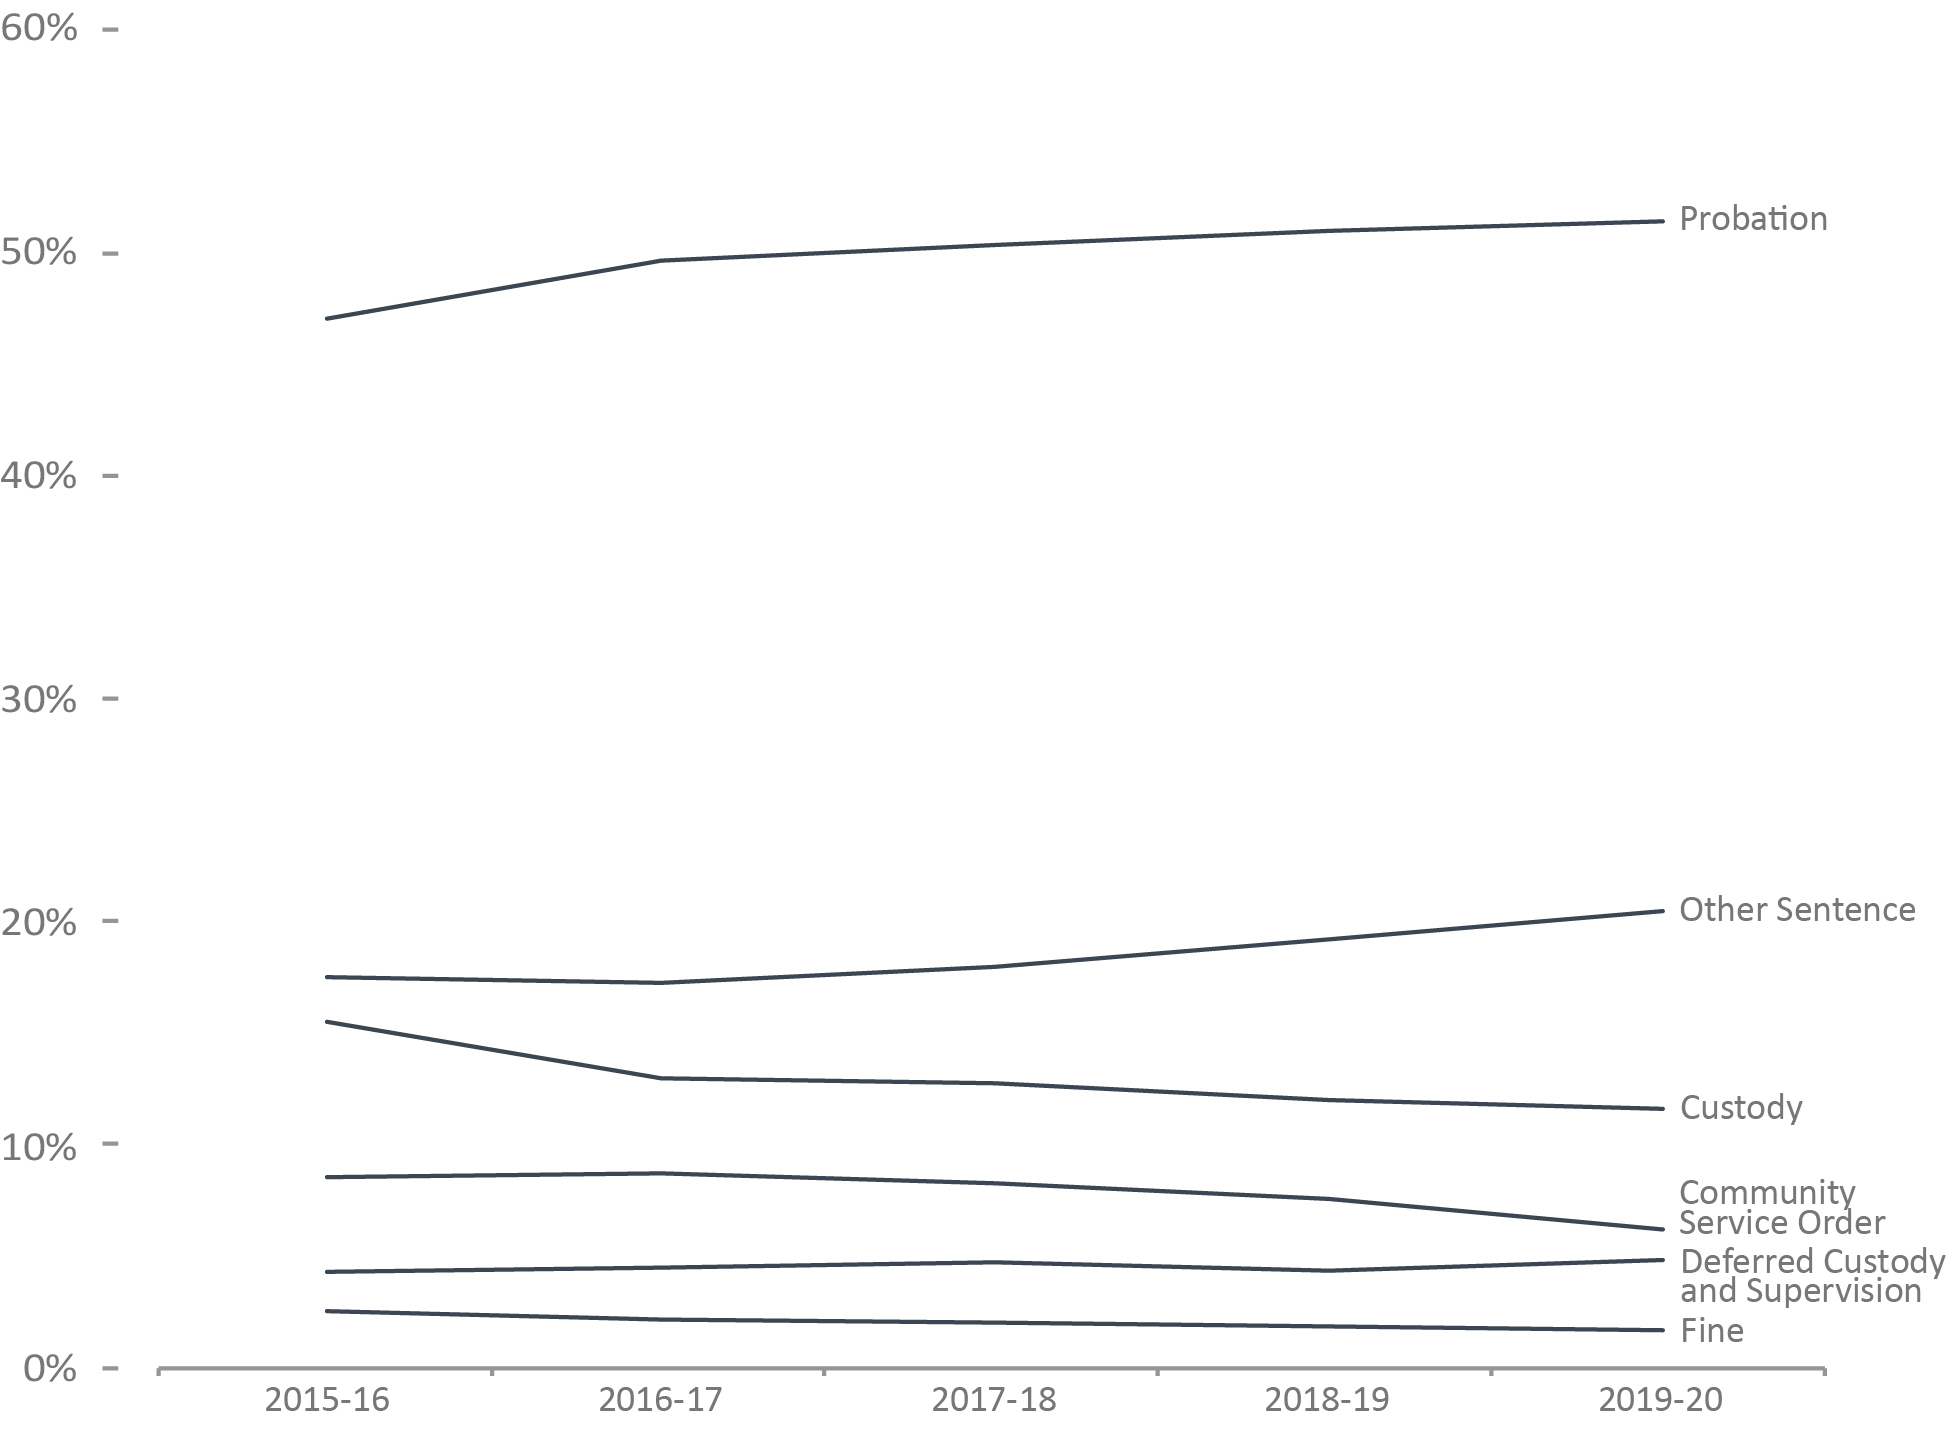
Image description
Line graph showing percentages of youth criminal court sentences, for the most serious sentence each received, from fiscal year 2015 to 16 until fiscal year 2019 to 20. The proportion of youth criminal court sentences that were deferred custody and supervision, as well as fines, were both relatively low and consistent over the 5 year timeframe, with each remaining under 5 percent of youth criminal court sentences each. The community service orders were the most serious sentences handed out to youth in 8.6 percent of youth criminal court cases in fiscal year 2015 to 16, then dropped to 7.5 percent in fiscal year 2019 to 20. The sentence of custody was 14.9 percent of sentences in fiscal year 2015 to 16, which rose to 15.5 percent in fiscal year 2016 to 17, before gradually declining to 12 percent in fiscal year 2019 to 20. The category of “Other sentences” accounted for 16.9 percent of all youth criminal court most serious sentences per case in fiscal year 2015 to 16, then rose to 19.2 percent in fiscal year 2019 to 20. Lastly, probation was the most common sentence, accounting for 48.4 percent of youth court sentences in fiscal year 2015 to 16, dropping to its lowest point of 47 percent in fiscal year 2016 to 17, then rising until its highest point in fiscal year 2019 to 20 at 50.9 percent. Full data are available immediately below.
Figure A16 Notes
Source: Table 35-10-0042-01, Integrated Criminal Court Survey, Canadian Centre for Justice and Community Safety Statistics, Statistics Canada.
- In 2019-20, 50.9% of youth found guilty were given probation as the most serious sentence. This rate has remained relatively stable since the implementation of the Youth Criminal Justice Act in April 2003.
- Of the Youth Criminal Justice Act sentences, deferred custody and supervision orders were the least frequent sentences (4.3%).
Other sentence includes absolute discharge, restitution, prohibition, seizure, forfeiture, compensation, pay purchaser, essays, apologies, counselling programs and conditional discharge, conditional sentence, intensive support and supervision, attendance at non-residential program(s) and reprimand. This category also includes intensive support and supervision, attendance at non-residential program(s) and reprimand where sentencing data under the Youth Criminal Justice Act are not available.
The concept of a case has changed to more closely reflect court processing. Statistics from the Integrated Criminal Court Survey used in this report should not be compared to editions of the Corrections and Conditional Release Statistical Overview prior to 2007.
The figure includes data from the most recent year available at the time of publication.
Figure A16 in the 2021 CCRSO corresponds to Figure A12 in the 2020 CCRSO.
| Type of Sentence | Sex | Year | ||||
|---|---|---|---|---|---|---|
| 2015-16 | 2016-17 | 2017-18 | 2018-19 | 2019-20 | ||
| % | % | % | % | % | ||
| Probation | Female | 47.6 | 47.0 | 50.1 | 47.8 | 49.2 |
| Male | 48.6 | 47.5 | 50.4 | 50.9 | 51.1 | |
| Total | 48.4 | 47.0 | 49.6 | 50.3 | 50.9 | |
| Custody | Female | 11.7 | 11.9 | 7.5 | 8.9 | 6.3 |
| Male | 15.9 | 16.5 | 13.6 | 13.5 | 13.3 | |
| Total | 14.9 | 15.5 | 13.0 | 12.7 | 12.0 | |
| Community Service Order | Female | 9.4 | 8.5 | 9.2 | 9.2 | 8.4 |
| Male | 8.4 | 7.9 | 8.1 | 7.3 | 6.4 | |
| Total | 8.6 | 8.5 | 8.7 | 8.3 | 7.5 | |
| Deferred Custody and Supervision | Female | 3.1 | 3.7 | 3.3 | 3.4 | 3.1 |
| Male | 4.2 | 4.5 | 4.8 | 5.2 | 4.8 | |
| Total | 3.9 | 4.3 | 4.5 | 4.7 | 4.3 | |
| Fine | Female | 2.5 | 2.6 | 2.2 | 2.0 | 2.1 |
| Male | 2.4 | 2.5 | 2.1 | 2.0 | 1.7 | |
| Total | 2.4 | 2.5 | 2.1 | 2.0 | 1.8 | |
| Other Sentence | Female | 18.5 | 19.6 | 20.8 | 22.8 | 24.4 |
| Male | 16.1 | 16.5 | 16.1 | 17.3 | 18.7 | |
| Total | 16.9 | 17.5 | 17.2 | 17.9 | 19.2 | |
Table A16 Notes
Source: Table 35-10-0042-01, Integrated Criminal Court Survey, Canadian Centre for Justice and Community Safety Statistics, Statistics Canada.
Other sentence includes absolute discharge, restitution, prohibition, seizure, forfeiture, compensation, pay purchaser, essays, apologies, counselling programs and conditional discharge, conditional sentence, intensive support and supervision, attendance at non-residential program(s) and reprimand. This category also includes intensive support and supervision, attendance at non-residential program(s) and reprimand where sentencing data under the Youth Criminal Justice Act are not available.
The concept of a case has changed to more closely reflect court processing. Statistics from the Integrated Criminal Court Survey used in this report should not be compared to editions of the Corrections and Conditional Release Statistical Overview prior to 2007.
The table includes data from the most recent year available at the time of publication.
Table A16 in the 2021 CCRSO corresponds to Table A12 in the 2020 CCRSO.
Incarceration rates across Western and European countries
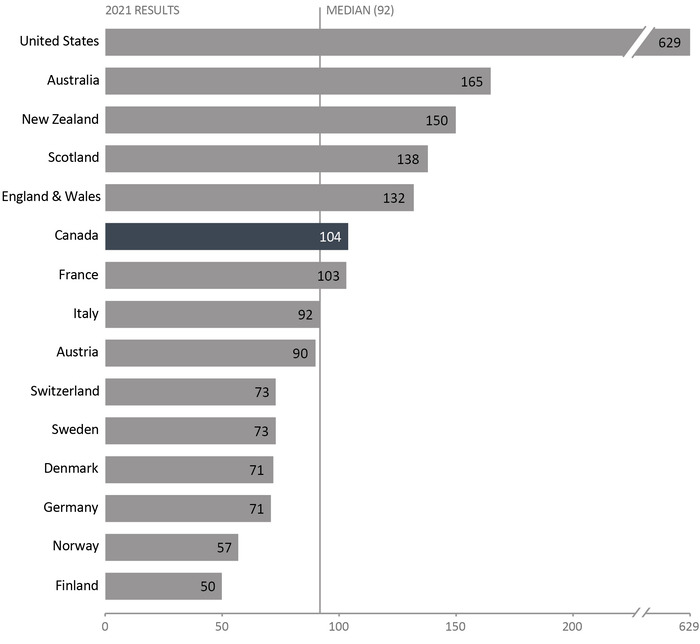
Image description
Bar graph showing the prison populations of 15 Western and European countries, per 100,000 population, for the calendar year 2021. Compared to the median prison population rate of 92 per 100,000, countries with prison population rates above the median include the United States with 629 people being incarcerated per 100,000 citizens; Australia with 165; New Zealand with 150; Scotland with 138; England and Wales with 132; Canada with 104; France with 103; and Italy with 92. Countries below the median prison population rate per 100,000 include Austria with 90; Switzerland and Sweden with 73 each; Denmark and Germany with 71 each; Norway with 57; and Finland with 50. Full data are available below.
Figure A17 Notes
Source: World Prison Brief, Institute for Crime & Justice Policy Research (ICPR) (www.prisonstudies.org/highest-to-lowest/prison-population-total).
- In 2021, Canada's incarceration rate was 104 per 100,000. When ranked from highest to lowest, Canada's prison population rate was ranked 143 of 223 countries. Canada's incarceration rate is higher than the average of western countries, but much lower than the United States where the most recent incarceration rate was 629 per 100,000.
- Finland’s incarceration rate was 50 per 100,000, the lowest incarceration rate among western European countries.
The median is the middle value where half the values fall below the median and the other half above. The median is the preferred way to measure the average when there is an extreme outlier in the data.
The incarceration rate presented here is a measure of the number of people (i.e., adults and youth) in custody per 100,000 people in the general population. Incarceration rates from the World Prison Brief hosted by the Institute for Crime & Justice Policy Research (ICPR) are based on the most recently available data at the time the list was compiled. The data was retrieved online on February 16th, 2022 from http://www.prisonstudies.org which contains the most up-to-date information available. Additionally, different practices and variations in measurement in different countries limit the comparability of these figures.
Figure A17 in the 2021 CCRSO corresponds to Figure A3 in the 2020 CCRSO.
| 2012 | 2013 | 2014 | 2015 | 2016 | 2017 | 2018 | 2019 | 2020 | 2021 | |
|---|---|---|---|---|---|---|---|---|---|---|
United States |
730 | 716 | 707 | 698 | 693 | 666 | 655 | 655 | 639 | 629 |
New Zealand |
194 | 192 | 190 | 190 | 203 | 214 | 214 | 201 | 188 | 150 |
England & Wales |
154 | 148 | 149 | 148 | 147 | 146 | 140 | 140 | 131 | 132 |
Scotland |
151 | 147 | 144 | 144 | 142 | 138 | 143 | 149 | 136 | 138 |
Australia |
129 | 130 | 143 | 151 | 152 | 168 | 172 | 170 | 160 | 165 |
Canada |
114 | 118 | 118 | 106 | 114 | 114 | 114 | 107 | 104 | 104 |
Italy |
109 | 106 | 88 | 86 | 90 | 95 | 98 | 101 | 89 | 92 |
Austria |
104 | 98 | 99 | 95 | 93 | 94 | 98 | 98 | 95 | 90 |
France |
102 | 101 | 102 | 100 | 103 | 103 | 100 | 105 | 90 | 103 |
Germany |
83 | 79 | 81 | 78 | 78 | 77 | 75 | 77 | 69 | 71 |
Switzerland |
76 | 82 | 87 | 84 | 83 | 82 | 81 | 81 | 80 | 73 |
Sweden |
70 | 67 | 57 | 60 | 53 | 57 | 59 | 61 | 68 | 73 |
Denmark |
74 | 73 | 67 | 61 | 58 | 59 | 63 | 63 | 68 | 72 |
Norway |
73 | 72 | 75 | 71 | 74 | 74 | 63 | 60 | 49 | 57 |
Finland |
59 | 58 | 55 | 57 | 55 | 57 | 51 | 53 | 53 | 50 |
Table A17 Notes
Source: World Prison Brief, Institute for Crime & Justice Policy Research (ICPR) (www.prisonstudies.org/highest-to-lowest/prison-population-total).
Table A17 and A18 display the same data.
The incarceration rate presented here is a measure of the number of people (i.e., adults and youth) in custody per 100,000 people in the general population. Incarceration rates from the World Prison Brief hosted by the Institute for Crime & Justice Policy Research (ICPR) are based on the most recently available data at the time the list was compiled. The data was retrieved online on February 16th, 2022 from http://www.prisonstudies.org which contains the most up-to-date information available. Additionally, different practices and variations in measurement in different countries limit the comparability of these figures.
Table A17 in the 2021 CCRSO corresponds to Table A3 in the 2020 CCRSO.
Incarceration rates across Western and European countries: 10-year trend

Image description
Line graph showing the prison population across six Western and European countries, per 100,000 population, from calendar year 2012 to 2021. Denmark had the lowest incarceration rate, which experienced a downward trend towards 2014 and 2016 before rising slightly over time until 2021. Canada had the next lowest incarceration rate history with its highest incarceration rate being seen in 2013 and 2014 at 118 per 100,000, while Canada’s lowest incarcerations rates were in 2020 and 2021 at 104 per 100,000. Australia had the next lowest incarceration rate, with 154 people being imprisoned per 100,000 in 2012, then decreasing slightly until reaching an incarceration rate of 123 per 100,000 in 2021. New Zealand had an incarceration rate of 194 per 100,000 in 2012, which decreased slightly until its lowest point in 2014 and 2015 at 190 per 100,000, prior to rising to its highest point in 2017 and 2018, at 214 per 100,000, before decreasing again to 150 per 100,000 in 2021. Finally, the United States had, by far, the highest incarceration rate of the six countries examined, with 730 Americans being imprisoned per 100,000 citizens in 2012 then gradually decreasing until the United States reached the incarceration rate of 629 people per 100,000 in 2021. Full data are available immediately below.
Figure A18 Notes
Source: World Prison Brief, Institute for Crime & Justice Policy Research (ICPR) (www.prisonstudies.org/highest-to-lowest/prison-population-total).
- From 2012 to 2019 incarceration rates declined in most Western and European countries. A notable exception is England and Wales where there was a 31.8% increase in the incarceration rate.
- From 2019 to 2021 incarceration rates declined in most Western and European countries. Notable exceptions include Sweden and Denmark which showed a 19.7% and 14.3% respective increase in incarceration rates.
- New Zealand showed the greatest decline between 2019 to 2021 (25.4%).
- Canada’s incarceration rate declined 6.1% between 2012 to 2019 and declined a further 2.8% from 2019-2021.
The incarceration rate presented here is a measure of the number of people (i.e., adults and youth) in custody per 100,000 people in the general population. Incarceration rates from the World Prison Brief hosted by the Institute for Crime & Justice Policy Research (ICPR) are based on the most recently available data at the time the list was compiled. The data was retrieved online on February 16th, 2022, from http://www.prisonstudies.org which contains the most up to-date information available. Different practices and variations in measurement in different countries limit the comparability of these figures.
Figure A18 in the 2021 CCRSO corresponds to Figure A4 in the 2020 CCRSO.
| 2012 | 2013 | 2014 | 2015 | 2016 | 2017 | 2018 | 2019 | 2020 | 2021 | |
|---|---|---|---|---|---|---|---|---|---|---|
United States |
730 | 716 | 707 | 698 | 693 | 666 | 655 | 655 | 639 | 629 |
New Zealand |
194 | 192 | 190 | 190 | 203 | 214 | 214 | 201 | 188 | 150 |
Australia |
154 | 148 | 149 | 148 | 147 | 146 | 140 | 140 | 131 | 132 |
Scotland |
151 | 147 | 144 | 144 | 142 | 138 | 143 | 149 | 136 | 138 |
England & Wales |
129 | 130 | 143 | 151 | 152 | 168 | 172 | 170 | 160 | 165 |
Canada |
114 | 118 | 118 | 106 | 114 | 114 | 114 | 107 | 104 | 104 |
Austria |
109 | 106 | 88 | 86 | 90 | 95 | 98 | 101 | 89 | 92 |
France |
104 | 98 | 99 | 95 | 93 | 94 | 98 | 98 | 95 | 90 |
Italy |
102 | 101 | 102 | 100 | 103 | 103 | 100 | 105 | 90 | 103 |
Switzerland |
83 | 79 | 81 | 78 | 78 | 77 | 75 | 77 | 69 | 71 |
Germany |
76 | 82 | 87 | 84 | 83 | 82 | 81 | 81 | 80 | 73 |
Denmark |
70 | 67 | 57 | 60 | 53 | 57 | 59 | 61 | 68 | 73 |
Sweden |
74 | 73 | 67 | 61 | 58 | 59 | 63 | 63 | 68 | 72 |
Finland |
73 | 72 | 75 | 71 | 74 | 74 | 63 | 60 | 49 | 57 |
Norway |
59 | 58 | 55 | 57 | 55 | 57 | 51 | 53 | 53 | 50 |
Table A18 Notes
Source: World Prison Brief, Institute for Crime & Justice Policy Research (ICPR) (www.prisonstudies.org/highest-to-lowest/prison-population-total).
Table A17 and A18 display the same data.
The incarceration rate presented here is a measure of the number of people (i.e., adults and youth) in custody per 100,000 people in the general population. Incarceration rates from the World Prison Brief are based on the most recently available data at the time the list was compiled. For 2020, the data was retrieved online on February 16th, 2022 at www.prisonstudies.org which contains the most up to date information available. Additionally, different practices and variations in measurement in different countries limit the comparability of these figures.
Table A18 in the 2021 CCRSO corresponds to Table A4 in the 2020 CCRSO.
Section B: Corrections Administration
Correction costs federally and provincially/territorially
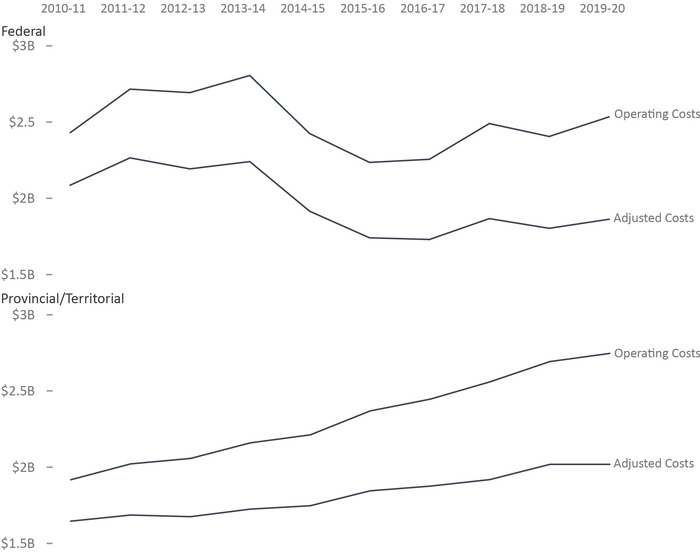
Image description
Line graph showing the costs of federal and provincial and territorial corrections from fiscal year 2010 to 11 to fiscal year 2020 to 21. In the category of federal costs, operating costs are the largest proportion of correctional budgets across time. Federal operating costs rose from less than 2.5 billion dollars a year in fiscal year 2010 to 11, rising to nearly 2.75 billion dollars in fiscal year 2013 to 14, falling to just over 2 billion dollars in fiscal year 2014 to 15. Federal adjusted costs followed a very similar pattern, but at levels that are roughly 500 million dollars less than operating costs. Over time operating costs have increased ever so slightly more than have adjusted costs. In the category of provincial and territorial corrections costs, operating costs are the largest proportion of correctional budgets over time. Provincial and territorial operating costs increased from under 2 billion dollars in fiscal year 2010 to 11 to over 2.6 billion dollars in fiscal year 2019 to 2020. Provincial and territorial adjusted costs also increased in a similar pattern to that of their operating costs, but adjusted costs did not increase as fast as did spending on operating costs. Full data are available immediately below.
Figure B1 Notes
Sources: Federal costs are from Correctional Service Canada; Office of the Correctional Investigator; Parole Board of Canada. Provincial/Territorial costs are from Table 35-10-0013-01, Adult Correctional Services, Canadian Centre for Justice and Community Safety Statistics, Statistics Canada.
- Costs of federal corrections were $2.53 billion in 2019-20. This was a 5.4% increase compared to the prior year and is 4.3% higher than 2011-2012. When considering adjusted costs there was a 10.7% decrease in spending between 2010-11 to 2019-20.
- Costs of provincial/territorial corrections were about $2.7 billion in 2019-20. This represented a 2.0% increase from 2018-19 and a 46.2% increase since 2010-2011. When considering adjusted costs there was a 22.6% increase in spending between 2010-11 to 2019-20.
Adjusted costs adjust for the impact of inflation by reporting in constant dollars. Constant dollars (2002) represent dollar amounts calculated on a one-year base that adjusts for inflation, allowing the yearly amounts to be directly comparable. Changes in the Consumer Price Index were used to calculate constant dollars.
Federal expenditures on corrections include spending by Correctional Service Canada (CSC), the Parole Board of Canada (PBC), and the Office of the Correctional Investigator (OCI). Total expenditures represent gross expenditures and exclude revenues. Operating costs include Employee Benefit Plan expenditures. CSC expenditures exclude CORCAN (a Special Operating Agency that conducts industrial operations within penitentiaries).
The table includes data from the most recent year available at the time of publication.
| Year | Current Dollars | Constant 2002 Dollars | |||||||
|---|---|---|---|---|---|---|---|---|---|
| Operating | Capital | Total | Per capitaFootnote * | Operating | Capital | Total | Per capitaFootnote * | ||
| $’000 | $ | $’000 | $ | ||||||
| 2015-16 | CSC | 2,189,101 | 168,684 | 2,357,785 | 66.04 | 1,704,907 | 131,374 | 1,836,281 | 51.43 |
| PBC | 46,300 | NA | 46,300 | 1.30 | 36,059 | NA | 36,059 | 1.04 | |
| OCI | 4,656 | NA | 4,656 | 0.13 | 3,626 | NA | 3,626 | 0.10 | |
| Total | 2,240,057 | 168,684 | 2,408,741 | 67.47 | 1,744,593 | 131,374 | 1,875,967 | 54.04 | |
| 2016-17 | CSC | 2,209,048 | 153,757 | 2,362,805 | 65.43 | 1,694,055 | 117,912 | 1,811,966 | 50.18 |
| PBC | 46,800 | NA | 46,800 | 1.30 | 35,890 | NA | 35,890 | 1.03 | |
| OCI | 4,693 | NA | 4,693 | 0.13 | 3,599 | NA | 3,599 | 0.10 | |
| Total | 2,260,541 | 153,757 | 2,414,298 | 66.86 | 1,733,544 | 117,912 | 1,851,455 | 53.33 | |
| 2017-18 | CSC | 2,442,488 | 185,624 | 2,628,112 | 71.91 | 1,830,951 | 139,148 | 1,970,099 | 53.91 |
| PBC | 47,700 | NA | 47,700 | 1.31 | 35,757 | NA | 35,757 | 1.03 | |
| OCI | 4,616 | NA | 4,616 | 0.13 | 3,472 | NA | 3,472 | 0.10 | |
| Total | 2,494,804 | 185,624 | 2,680,428 | 73.35 | 1,870,179 | 139,148 | 2,009,328 | 57.88 | |
| 2018-19 | CSC | 2,352,556 | 227,793 | 2,580,349 | 69.62 | 1,763,535 | 170,759 | 1,934,295 | 52.19 |
| PBC | 49,800 | NA | 49,800 | 1.34 | 37,331 | NA | 37,331 | 1.08 | |
| OCI | 4,631 | NA | 4,631 | 0.12 | 3,472 | NA | 3,472 | 0.10 | |
| Total | 2,406,987 | 227,793 | 2,634,780 | 71.09 | 1,804,338 | 170,759 | 1,975,097 | 56.90 | |
| 2019-20 | CSC | 2,477,237 | 164,643 | 2,641,880 | 70.28 | 1,821,498 | 121,061 | 1,942,558 | 51.67 |
| PBC | 51,500 | NA | 51,500 | 1.37 | 37,868 | NA | 38,606 | 1.11 | |
| OCI | 5,441 | NA | 5,441 | 0.14 | 4,001 | NA | 4,079 | 0.12 | |
| Total | 2,534,178 | 164,643 | 2,698,820 | 71.79 | 1,863,366 | 121,061 | 1,984,426 | 57.16 | |
Table B1 Notes
Sources: Federal costs are from Correctional Service Canada; Office of the Correctional Investigator; Parole Board of Canada. Provincial/Territorial costs are from Table 35-10-0013-01, Adult Correctional Services, Canadian Centre for Justice and Community Safety Statistics, Statistics Canada.
Due to rounding, constant dollar amounts may not add up to Total.
Constant dollars represent dollar amounts calculated on a one-year base (2002) that adjusts for inflation allowing the yearly amounts to be directly comparable. Changes in the Consumer Price Index (CPI) were used to calculate constant dollars. The CPI rate for the 2021 CCRSO was based on an average of the monthly CPI for the fiscal year rather than calendar year. This limits comparability of the current data to that reported prior to the 2020 CCRSO.
Federal expenditures on corrections include spending by Correctional Service Canada (CSC), the Parole Board of Canada (PBC), and the Office of the Correctional Investigator (OCI). Total expenditures represent gross expenditures and exclude revenues. Operating costs include Employee Benefit Plan expenditures. CSC expenditures exclude CORCAN (a Special Operating Agency that conducts industrial operations within penitentiaries).
Costs are rounded to the thousands. Therefore, the per capita rate needs to be multiplied by 1000.
NA is the short form for not applicable.
The table includes data from the most recent year available at the time of publication.
Number of CSC employees by location

Image description
Bar illustration representing the number of Correctional Service of Canada employees at the end of the 2020 to 21 fiscal year. The bar is divided into three sections: community supervision, custody centres, and headquarters and central services. Community supervision employees are the smallest job category at the Correctional Service of Canada, representing 8.6 percent of employees, which amounts to 1,509 employees. This is followed by jobs at headquarters and central services which represent 15.1 percent of Correctional Service of Canada employees, which represents 2,640 employees. Jobs at custody centres is the most common job category at the Correctional Services of Canada representing 76.2 percent of employees, which represents at total of 13,306 employees. Full data are available immediately below.
Figure B2 Notes
Source: Correctional Service of Canada.
- The Correctional Service of Canada (CSC) has a total staff of 17,458.
- Approximately 76% of CSC staff work in institutions.
- Staff employed in community supervision account for 8.6% of the total.
Due to changes in policy, Correctional Officers no longer occupy positions in the community.
CSC has changed its definition of employee. Previously the total number of employees included casual employees, employees on leave without pay and suspended employees. These categories have been removed from the total as of 2005-06. These numbers represent indeterminate and term equal to, or more than 3 months substantive employment; and employee status of active and paid leave current up to March 31, 2021.
Due to rounding, percentage may not add to 100.
| Service Area | March 31, 2011 | March 31, 2021 | ||
|---|---|---|---|---|
| # | % | # | % | |
| Headquarters and Central Services | 2,979 | 16.6 | 2,640 | 15.1 |
| Administration | 2,530 | 14.1 | 2,282 | 13.1 |
| Health Care | 130 | 0.7 | 76 | 0.4 |
| Program Staff | 102 | 0.6 | 61 | 0.3 |
| Correctional Officers | 41 | 0.2 | 44 | 0.3 |
| Instructors/Supervisors | 14 | 0.1 | 11 | 0.1 |
| Parole Officers/Parole SupervisorsFootnote * | 1 | 0.0 | 1 | 0.0 |
| OtherFootnote ** | 161 | 0.9 | 165 | 0.9 |
| Custody Centres | 13,469 | 75.2 | 13,309 | 76.2 |
| Correctional Officers | 7,194 | 40.2 | 7,030 | 40.3 |
| Administration | 2,079 | 11.6 | 1,838 | 10.5 |
| Health Care | 973 | 5.4 | 1,036 | 5.9 |
| Program Staff | 942 | 5.3 | 1,001 | 5.7 |
| Parole Officers/Parole SupervisorsFootnote * | 708 | 4.0 | 590 | 3.4 |
| Instructors/Supervisors | 400 | 2.2 | 419 | 2.4 |
| OtherFootnote ** | 1,173 | 6.6 | 1,395 | 8.0 |
| Community Supervision | 1,456 | 8.1 | 1,509 | 8.6 |
| Parole Officers/Parole SupervisorsFootnote * | 771 | 4.3 | 797 | 4.6 |
| Administration | 362 | 2.0 | 374 | 2.1 |
| Program Staff | 222 | 1.2 | 251 | 1.4 |
| Health Care | 76 | 0.4 | 81 | 0.5 |
| Correctional Officers | 14 | 0.1 | 0 | 0 |
| Instructor/Supervisor | 1 | 0.0 | 0 | 0 |
| OtherFootnote ** | 10 | 0.1 | 6 | 0 |
| Total | 17,904 | 100 | 17,458 | 100 |
Table B2 Notes
Source: Correctional Service of Canada.
Due to changes in policy, Correctional Officers no longer occupy positions in the community.
CSC has changed its definition of employee. Previously the total number of employees included casual employees, employees on leave without pay and suspended employees. These categories have been removed from the total as of 2005-06. These numbers represent indeterminate and term equal to, or more than 3 months substantive employment; and employee status of active and paid leave current up to March 31, 2021.
Due to rounding, percentage may not add to 100.
Cost of incarceration in a federal institution: 5-year trend
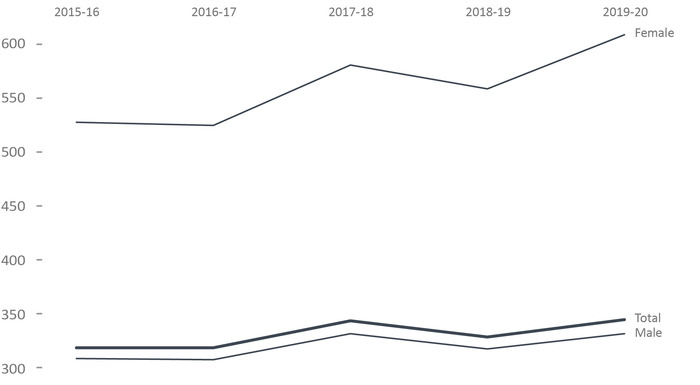
Image description
Line graph showing the federal average daily inmate cost for female, male, and the total number of inmates from 2015 to 2020. Female daily inmate costs are the most prevalent, with trends remaining relatively stable from 2015 to 2016. The trend line increases in 2017, after which it drops slightly in 2018 before reaching its pinnacle in 2020. Far less expensive than the female daily inmate cost, trend lines for the total daily inmate cost and male daily inmate cost share a similar pattern. Costs remain relatively stable from 2015 to 2016, then increasing in 2017, prior to dropping again in 2018. In 2019, trends increase again where they achieve a similar cost to that of 2017. Full data are available immediately below.
Figure B3 Notes
Source: Correctional Service of Canada.
- The federal average daily inmate cost has increased from $319 in 2015-16 to $345 in 2019-20. In 2019-20, the annual average cost of keeping an inmate incarcerated was $126,253 per year, an increase from $116,364 per year in 2015-16. In 2019-20, the annual average cost of keeping a male incarcerated was $121,352 per year, whereas the annual average cost for incarcerating a female was $222,942.
- The cost associated with maintaining an offender in the community is 72.9% less than what it costs to maintain an offender in custody ($34,214 per year versus $126,253 per year).
In 2018-19, the methodology of presentation for certain indirect costs was changed to better reflect the direct costs of maintaining an offender.
The average daily inmate cost includes those costs associated with the operation of the institutions such as salaries and employee benefit plan contributions, but excludes capital expenditures and expenditures related to CORCAN (a Special Operating Agency that conducts industrial operations within federal institutions).
The intent of an Exchange of Service Agreement is to detail the roles and responsibilities of each jurisdiction and include specific protocols regarding per diem rates, offender information sharing, and invoicing pertaining to the reciprocal exchange of offenders between jurisdictions.
Total incarcerated and community includes additional NHQ & RHQ administrative costs which are not part of the Institutional and/or Community calculations. Offenders in the Community includes: Offenders on conditional release, statutory release or with Long-Term Supervision Order, under CSC supervision.
Figures may not add due to rounding.
| Categories | 2015-16 | 2016-17 | 2017-18 | 2018-19 | 2019-20 |
|---|---|---|---|---|---|
| Maximum Security (males only) | 155,848 | 158,113 | 169,367 | 163,642 | 174,939 |
| Medium Security (males only) | 106,868 | 105,349 | 115,263 | 109,660 | 111,243 |
| Minimum Security (males only) | 81,528 | 83,450 | 86,603 | 83,900 | 92,877 |
| Women’s Facilities | 192,742 | 191,843 | 212,005 | 204,474 | 222,942 |
| Exchange of Services AgreementsFootnote * (both) | 114,974 | 122,998 | 114,188 | 122,269 | 131,322 |
| Incarcerated Average | 116,364 | 116,473 | 125,466 | 120,589 | 126,253 |
| Offenders in the Community | 31,052 | 30,639 | 32,327 | 32,037 | 34,214 |
| Total Incarcerated and Community | 94,545 | 95,654 | 100,425 | 99,185 | 104,963 |
Table B3 Notes
Source: Correctional Service of Canada.
In 2018-19, the methodology of presentation for certain indirect costs was changed to better reflect the direct costs of maintaining an offender.
The average daily inmate cost includes those costs associated with the operation of the institutions such as salaries and employee benefit plan contributions, but excludes capital expenditures and expenditures related to CORCAN (a Special Operating Agency that conducts industrial operations within federal institutions).
Total incarcerated and community includes additional NHQ & RHQ administrative costs which are not part of the Institutional and/or Community calculations. Offenders in the Community includes: Offenders on conditional release, statutory release or with Long-Term Supervision Order, under CSC supervision.
Figures may not add due to rounding.
The number of Parole Board of Canada employees
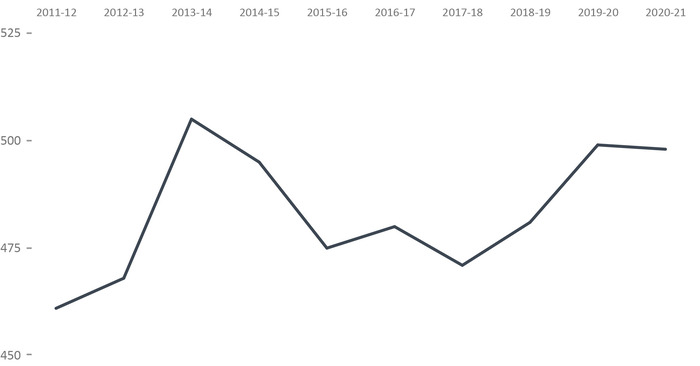
Image description
Line graph showing the number of full-time employees used by the Parole Board of Canada from 2011 and 2021. The trend line rises from its lowest point in 2011 to 2012, then spikes and reaches its peak in 2013, before gradually decreasing until 2015. Trends show a small increase from 2016 to 2017, then drop again in 2018, prior to a gradual increase until 2019 which remains relatively stable until 2021. Full data are available immediately below.
Figure B4 Notes
Source: Parole Board of Canada.
- In 2020-21, the full-time equivalents used by the Parole Board of Canada was 498 (one fewer) compared to 2019-20.
A full-time equivalent is a measure of the extent to which an employee represents a full person-year charge against a departmental budget. Section 103 of the Corrections and Conditional Release Act limits the Parole Board of Canada to 60 full-time members.
| 2016-17 | 2017-18 | 2018-19 | 2019-20 | 2020-21 | |
|---|---|---|---|---|---|
| Program Activity | |||||
Conditional Release Decisions |
321 | 317 | 317 | 320 | 323 |
Conditional Release Openness and Accountability |
44 | 42 | 43 | 45 | 45 |
Record Suspension and Clemency Recommendations |
59 | 48 | 58 | 72 | 62 |
Internal Services |
56 | 64 | 63 | 62 | 68 |
Total |
480 | 471 | 481 | 499 | 498 |
| Types of Employees | |||||
Full-time Board Members |
39 | 38 | 41 | 40 | 36 |
Part-time Board Members |
17 | 20 | 19 | 20 | 20 |
Staff |
424 | 413 | 421 | 439 | 442 |
Total |
480 | 471 | 481 | 499 | 498 |
Table B4 Notes
Source: Parole Board of Canada.
A full-time equivalent is a measure of the extent to which an employee represents a full person-year charge against a departmental budget. Section 103 of the Corrections and Conditional Release Act limits the Parole Board of Canada to 60 full-time members.
The number of employees in the Office of the Correctional Investigator
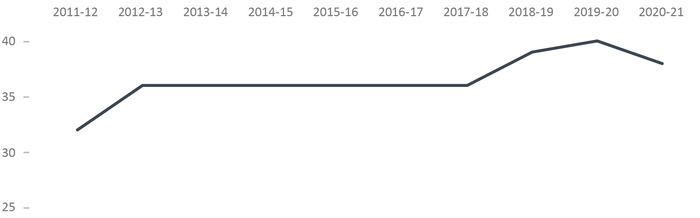
Image description
Line graph showing the number of full-time employees at the Office of the Correctional Investigator from 2011 to 2021. From its lowest point in 2011, the trend line rises slightly in 2012, then remains relatively stable until 2017 where it rises and reaches its pinnacle in 2019, before dropping slightly in 2021. Full data are available immediately below.
Figure B5 Notes
Source: Office of the Correctional Investigator.
- In 2020-21, the total number of full-time equivalents at the Office of the Correctional Investigator decreased from 40 employees total in 2019-2020 to 38 employees total.
The Office of the Correctional Investigator (OCI) may commence an investigation on receipt of a complaint by or on behalf of an offender or on its own initiative. Complaints are made by telephone, letter and during interviews with the OCI's investigative staff at federal correctional facilities. The dispositions in response to complaints involve a combination of internal responses (where the information or assistance sought by the offender can generally be provided by the OCI's investigative staff) and investigations (where, further to a review/analysis of law, policies and documentation, OCI investigative staff make an inquiry or several interventions with Correctional Service Canada and submit recommendations to address the complaint). Investigations vary considerably in terms of scope, complexity, duration and resources required.
| Types of Employees | 2016-17 | 2017-18 | 2018-19 | 2019-20 | 2020-21 |
|---|---|---|---|---|---|
| Correctional Investigator | 1 | 1 | 1 | 1 | 1 |
| Senior Management and Investigative Services | 26 | 26 | 27 | 28 | 26 |
| Internal Services | 4 | 4 | 6 | 5 | 5 |
| Legal Counsel, Policy and Research | 5 | 5 | 5 | 6 | 6 |
| Total | 36 | 36 | 39 | 40 | 38 |
Table B5 Notes
Source: Office of the Correctional Investigator.
The Office of the Correctional Investigator (OCI) may commence an investigation on receipt of a complaint by or on behalf of an offender or on its own initiative. Complaints are made by telephone, letter and during interviews with the OCI's investigative staff at federal correctional facilities. The dispositions in response to complaints involve a combination of internal responses (where the information or assistance sought by the offender can generally be provided by the OCI's investigative staff) and investigations (where, further to a review/analysis of law, policies and documentation, OCI investigative staff make an inquiry or several interventions with Correctional Service Canada and submit recommendations to address the complaint). Investigations vary considerably in terms of scope, complexity, duration and resources required.
Most common offender complaints to the Office of the Correctional Investigator
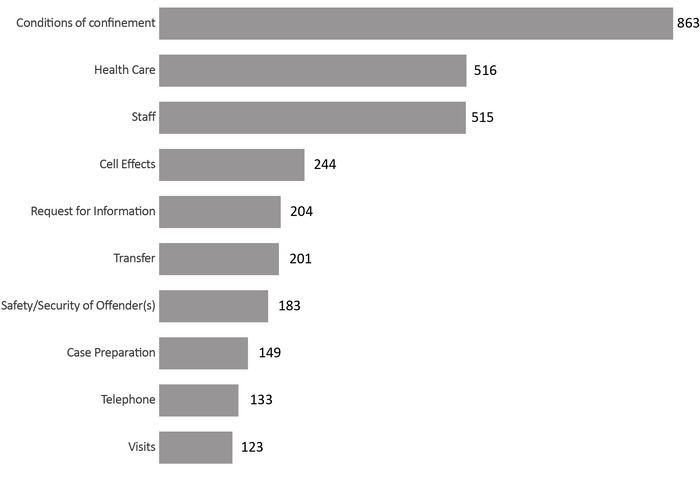
Image description
Bar graph showing the 10 most common offender complaints in 2020 and 2021. In descending order of frequency, conditions of confinement are the most prevalent with 863 complaints; followed by health care with 516 complaints; staff with 515 complaints; cell effects with 244 complaints; request for information with 204 complaints; transfer with 201 complaints; safety/security of offender(s) with 183 complaints; case preparation with 149 complaints; telephone with 133 complaints; and finally, visits with 123 complaints. Full data are available immediately below.
Figure B6 Notes
Source: Office of the Correctional Investigator.
- There were 4,507 complaints/enquiries received at the Office of the Correctional Investigator (OCI) in 2020-21, a decrease of 19.0% since 2019-20.
- Conditions of confinement (19.1%), Health care (11.4%), staff (11.4%), and cell effects (5.4%), accounted for 47.4% of all complaints.
- Conditions of confinement was the most common offender complaint in 2020-21. From 2016-17 to 2019-20 the most common complaint was health care.
The Office of the Correctional Investigator (OCI) may commence an investigation on receipt of a complaint by or on behalf of an offender or on its own initiative. Complaints are made by telephone, letter and during interviews with the OCI's investigative staff at federal correctional facilities. The dispositions in response to complaints involve a combination of internal responses (where the information or assistance sought by the offender can generally be provided by the OCI's investigative staff) and investigations (where, further to a review/analysis of law, policies and documentation, OCI investigative staff make an inquiry or several interventions with Correctional Service Canada and submit recommendations to address the complaint). Investigations vary considerably in terms of scope, complexity, duration and resources required.
| Category of ComplaintFootnote * | 2016-17 | 2017-18 | 2018-19 | 2019-20 | 2020-21 |
|---|---|---|---|---|---|
| Conditions of Confinement | 783 | 783 | 608 | 502 | 863 |
| Health Care | 913 | 858 | 693 | 688 | 516 |
| Staff | 408 | 530 | 501 | 560 | 515 |
| Cell Effects | 497 | 412 | 407 | 388 | 244 |
| Request for Information | 213 | 126 | 159 | 245 | 204 |
| Transfer | 439 | 353 | 334 | 368 | 201 |
| Safety/Security of Offender(s) | 208 | 127 | 177 | 230 | 183 |
| Case Preparation | 115 | 55 | 73 | 96 | 149 |
| Telephone | 187 | 169 | 183 | 185 | 133 |
| Visits | 285 | 214 | 192 | 209 | 123 |
| Financial Matters | 170 | 107 | 111 | 119 | 112 |
| Grievance | 173 | 177 | 127 | 129 | 106 |
| Correspondence | 167 | 149 | 84 | 130 | 103 |
| Programs | 202 | 138 | 112 | 112 | 71 |
| Outside OCI Jurisdiction | 259 | 193 | 128 | 133 | 65 |
| Security Classification | 135 | 129 | 102 | 136 | 61 |
| Release Procedures | 104 | 83 | 55 | 83 | 59 |
| Mental Health | 122 | 76 | 59 | 100 | 49 |
| Employment | 112 | 100 | 54 | 65 | 43 |
| Administrative Segregation | 269 | 223 | 187 | 89 | 4 |
| Total of All CategoriesFootnote ** | 6,844 | 5,865 | 5,113 | 5,566 | 4,507 |
Table B6 Notes
Source: Office of the Correctional Investigator.
The Office of the Correctional Investigator (OCI) may commence an investigation on receipt of a complaint by or on behalf of an offender or on its own initiative. Complaints are made by telephone, letter and during interviews with the OCI's investigative staff at federal correctional facilities. The dispositions in response to complaints involve a combination of internal responses (where the information or assistance sought by the offender can generally be provided by the OCI's investigative staff) and investigations (where, further to a review/analysis of law, policies and documentation, OCI investigative staff make an inquiry or several interventions with Correctional Service Canada and submit recommendations to address the complaint). Investigations vary considerably in terms of scope, complexity, duration and resources required.
Due to ongoing efforts at the OCI (Office of the Correctional Investigator) to streamline our administrative database and ensure accuracy in reporting, the numbers in this table will not always match those of past Corrections and Conditional Release Statistical Overviews, or OCI Annual Reports. Statistics in public reporting will also differ depending on when the data was extracted, as cases can be later categorized or re-categorized.
Section C: Federal Offender and Registered Victims Populations
Offenders under the responsibility of CSC
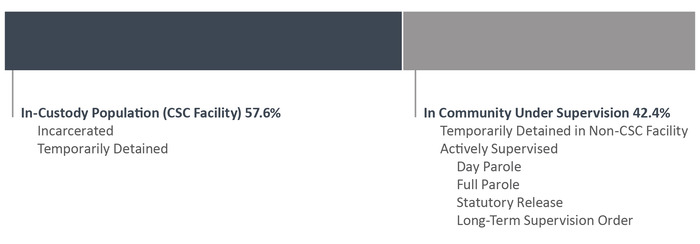
Image description
Bar illustration of the total offender population in the 2020 to 21 fiscal year that is separated into two categories. First, the in-custody population held at Correctional Service of Canada facilities accounts for 57.6 percent of the total offender population and includes those who are incarcerated or temporarily detained. Second, the in-community under supervision population of offenders which accounts for 42.4 percent of the total offender population and includes those who are temporarily detained in a non-Correctional Service of Canada facilities or are being actively supervised on day parole, full parole, statutory release, or long-term supervision order. Full data are available below.
Figure C1 Notes
Source: Correctional Service of Canada.
Definitions C1:
Total Offender Population includes all active offenders, who are incarcerated in a CSC facility, offenders on temporary absence from a CSC facility, offenders who are temporarily detained, offenders who are actively supervised, and offenders who are unlawfully at large for less than 90 days.
CSC Facilities include all federal institutions and federally funded Healing Lodges.
In Custody includes all active offenders incarcerated in a CSC facility, offenders on temporary absence from a CSC facility, offenders who are temporarily detained in a CSC facility and offenders on remand in a CSC facility.
In Community Under Supervision includes all active offenders on day parole, full parole, statutory release, in the community supervised on a long-term supervision order, offenders who are temporarily detained in a non-CSC facility, offenders who are unlawfully at large for less than 90 days, offenders on remand in a non-CSC facility, and offenders supervised and subject to an immigration hold by Canada Border Services Agency.
Actively Supervised includes all active offenders on day parole, full parole or statutory release, as well as those who are in the community on long-term supervision orders.
Temporarily Detained includes offenders who are physically held in a CSC facility or a non-CSC facility after being suspended for a breach of a parole condition or to prevent a breach of parole conditions.
In addition to the total offender population, there are excluded groups such as:
Federal jurisdiction offenders incarcerated in a Community Correctional Centre or in a non-CSC facility.
Federal jurisdiction offenders deported /extradited including offenders for whom a deportation order has been enforced by Canada Border Services Agency.
Federal offenders on bail which includes offenders on a judicial interim release; they have appealed their conviction or sentence and have been released to await the results of a new trial.
Escaped includes offenders who have absconded from either a correctional facility or while on a temporary absence and whose whereabouts are unknown.
Unlawfully at Large for 90 days or more. This includes offenders who have been released to the community on day parole, full parole, statutory release or a long term supervision order for whom a warrant for suspension has been issued at least 90 days ago, but has not yet been executed.
The definition of Offender Population changed from previous editions of the Corrections and Conditional Release Statistical Overview (CCRSO). As such, comparisons to editions of the CCRSO prior to 2016 should be done with caution.
| Status | Offenders under the responsibility of CSC | |
|---|---|---|
| # | % | |
In-Custody Population (CSC Facility) |
12,399 | 57.6 |
Incarcerated in CSC Facility |
11,777 | 54.7 |
Temporarily Detained in CSC Facility |
622 | 2.9 |
In Community under Supervision |
9,113 | 42.4 |
Temporarily Detained in Non-CSC Facility |
278 | 1.3 |
Actively Supervised |
8,835 | 41.1 |
Day Parole |
1,354 | 6.3 |
Full Parole |
4,470 | 20.8 |
Statutory Release |
2,536 | 11.8 |
Long-Term Supervision Order |
475 | 2.2 |
Total |
21,512 | 100.0 |
Table C1 Notes
Source: Correctional Service of Canada.
The definition of Offender Population changed from previous editions of the Corrections and Conditional Release Statistical Overview (CCRSO). As such, comparisons to editions of the CCRSO prior to 2016 should be done with caution.
Number of registered victims and offenders with a registered victim: 4-year trend
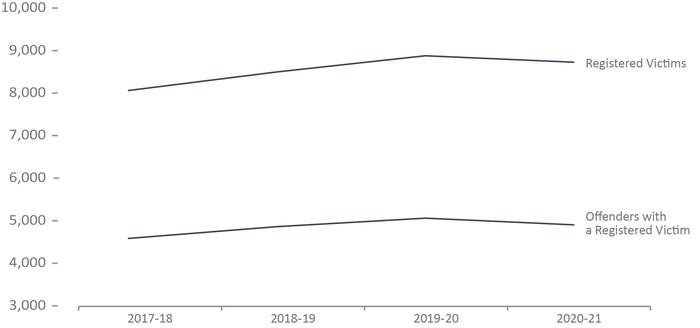
Image description
Line graph showing the number of registered victims and the number of offenders with a registered victim from fiscal year 2017 to 18 to fiscal year 2020 to 21. There were 4,570 offenders with a registered victim in fiscal year 2017 to 18, rising until its peak of 5,045 in fiscal year 2019 to 20, before decreasing again in fiscal year 2020 to 21 at 4,888 offenders. The number of registered victims rose from 8,041 in fiscal year 2017 to 18 until a peak in fiscal year 2019 to 20 with 8,857 victims, prior to dropping in fiscal year 2020 to 21 to 8,705 victims. Full data are available immediately below.
Figure C2 Notes
Source: Data Warehouse, Correctional Service of Canada.
- In order to register to receive information, a victim must meet the definition of a victim under the Corrections and Conditional Release Act (CCRA). Victims of federal offenders must be at least 18 years-old or legally emancipated or demonstrate they can act for themselves. Victims can register with the Correctional Service of Canada or the Parole Board of Canada.
- The number of victims registered with the federal correctional system increased by 8.3%, from 8,041 in 2017-18 to 8,705 in 2020-21.
- The number of offenders with a registered victim increased by 7.0% from 4,570 in 2017-18 to 4,888 in 2020-21.
Under the Corrections and Conditional Release Act (CCRA), a person can be a victim of a crime if: they are a spouse, conjugal partner, relative of, or person legally responsible for a victim who has died.
Victim Contact records are from the new Victims Application Module (VAM). This data cannot be compared to victim data prior to 2017 due to a change in how victims are counted. This was done because CSC changed from management of victim files within OMS, offender file based, to the newly built Victims Application Module (VAM), victim file based and no data was available until year end due to data migration. When Victim Services used OMS as its database, the prior indicator could not account for victims who were registered for more than one offender. Since the move to VAM, CSC can accurately capture the number of registered victims. For example, in the old system (OMS), one victim who was registered for six offenders would have counted as six registered victims; whereas in the new system (VAM), one registered victim who is registered for six offenders is accurately counted as one registered victim.
Figure C2 in the 2021 CCRSO corresponds to Figure F7 in the 2020 CCRSO.
| Year | Number of Registered Victims | Number of Offenders with a Registered Victim |
|---|---|---|
| 2017-18 | 8,041 | 4,570 |
| 2018-19 | 8,477 | 4,847 |
| 2019-20 | 8,857 | 5,045 |
| 2020-21 | 8,705 | 4,888 |
Table C2 Notes
Source: Data Warehouse, Correctional Service of Canada.
In order to register to receive information, a victim must meet the definition of a victim under the Corrections and Conditional Release Act (CCRA). Victims of federal offenders must be at least 18 years-old or legally emancipated or demonstrate they can act for themselves. Victims can register with the Correctional Service of Canada or the Parole Board of Canada.
Under the Corrections and Conditional Release Act (CCRA), a person can be a victim of a crime if: they are a spouse, conjugal partner, relative of, or person legally responsible for a victim who has died.
Victim Contact records are from the new Victims Application Module (VAM). This data cannot be compared to victim data prior to 2017 due to a change in how victims are counted. This was done because CSC changed from management of victim files within OMS, offender file based, to the newly built Victims Application Module (VAM), victim file based and no data was available until year end due to data migration. When Victim Services used OMS as its database, the prior indicator could not account for victims who were registered for more than one offender. Since the move to VAM, CSC can accurately capture the number of registered victims. For example, in the old system (OMS), one victim who was registered for six offenders would have counted as six registered victims; whereas in the new system (VAM), one registered victim who is registered for six offenders is accurately counted as one registered victim.
Table C2 in the 2021 CCRSO corresponds to Table F7 in the 2020 CCRSO.
The number of in-custody offenders: 10-year trend
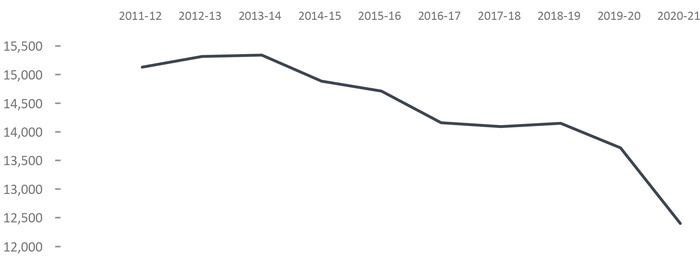
Image description
Line graph showing the number of in-custody offenders in a Correctional Service Canada facility at fiscal year end from fiscal year 2011 to 12 to fiscal year 2020 to 21. The number rises from 15,131 for fiscal year 2011 to 12, until its peak in fiscal year 2013 to 14 at 15,342 offenders, prior to dropping until 14,092 for fiscal 2017 to 18, rising briefly for fiscal year 2018 to 19 at 14,149, until dropping to its lowest point during fiscal 2020 to 21 at 12,399 in-custody offenders. Full data are available below.

Image description
Line graph showing the number of in-custody offenders in a provincial or territorial facility from fiscal year 2011 to 12 to fiscal year 2020 to 21. The number rises from 24,814 in fiscal year 2011 to 12 to 25,185 in-custody offenders in fiscal year 2012 to 13. It then drops to its lowest point of 21,704 the following year, prior to rising until its peak in fiscal year 2016 to 17 at 25,448, before dropping to 23,894 in fiscal year 2020 to 21. Full data are available immediately below.
Figure C3 Notes
Source: Correctional Service of Canada
Source: Table: 35-10-0154-01, Corrections Key Indicator Report for Adults and Youth, Canadian Centre for Justice and Community Safety Statistics, Statistics Canada.
- From 2011-12 to 2013-2014, the in-custody population at a CSC facility increased consistently but started to decline in 2014-15. There was a 9.6% decrease in 2020-21 in comparison with 2019-20.
- From 2016-17 to 2019-20 the in-custody population in a provincial/territorial facility decreased 6.1%. Data is not yet available for 2020-21.
The term in custody in a CSC Facility includes all active offenders incarcerated in a CSC facility, offenders on temporary absence from a CSC facility, offenders who are temporarily detained in a CSC facility and offenders on remand in a CSC facility.
The figure includes data from the most recent year available at the time of publication.
Figure C3 in the 2021 CCRSO corresponds to Figure C2 in the 2020 CCRSO.
| Year | In Custody in a CSCFootnote 1 FacilityFootnote * | Provincial/TerritorialFootnote 2 | Total | |||
|---|---|---|---|---|---|---|
| Sentenced | Remand | Other/ Temporary Detention | Total | |||
| 2011-12 | 15,131 | 11,138 | 13,369 | 308 | 24,814 | 39,945 |
| 2012-13 | 15,318 | 11,138 | 13,739 | 308 | 25,185 | 40,503 |
| 2013-14 | 15,342 | 9,888 | 11,494 | 322 | 21,704 | 37,046 |
| 2014-15 | 14,886 | 10,364 | 13,650 | 441 | 24,455 | 39,341 |
| 2015-16 | 14,712 | 10,091 | 14,899 | 415 | 25,405 | 40,117 |
| 2016-17 | 14,159 | 9,710 | 15,417 | 321 | 25,448 | 39,607 |
| 2017-18 | 14,092 | 9,545 | 14,833 | 303 | 24,681 | 38,773 |
| 2018-19 | 14,149 | 8,708 | 14,778 | 297 | 23,783 | 37,932 |
| 2019-20 | 13,720 | 7,947 | 15,505 | 442 | 23,894 | 37,614 |
| 2020-21 | 12,399 | Not availableFootnote ** | Not availableFootnote ** | Not availableFootnote ** | Not availableFootnote ** | Not availableFootnote ** |
Table C3 Notes
Data from 2020-21 were not yet released during the preparation of this report.
The figures for provincial and territorial offenders reflect annual average counts.
The table includes data from the most recent year available at the time of publication.
Table C3 in the 2021 CCRSO corresponds to Table C2 in the 2020 CCRSO.
Number of admissions to CSC facilities
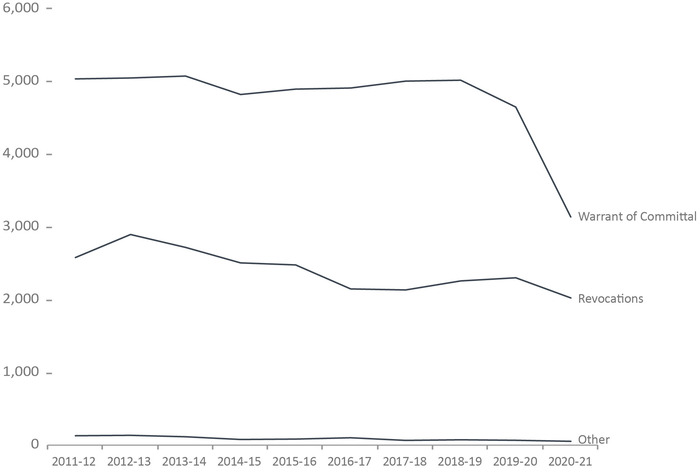
Image description
Line graph showing the number of admissions to Correctional Service Canada facilities from fiscal year 2011 to 12 until fiscal year 2020 to 21. The trend for the category of “other” admissions was the lowest, with 100 in fiscal year 2016 to 17, varying slightly over time until reaching its lowest point in fiscal year 2020 to 21 at 51 admissions. Revocations began at 2,146 in fiscal year 2016 to 17, dropping to 2,131 in fiscal year 2017 to 18, before rising to 2,298 in fiscal year 2019 to 20, before dropping to its lowest point in fiscal year 2020 to 21 at 2,021. The trend for admissions due to a warrant of committal also dropped over time, with numbers starting at 4,907 in fiscal year 2016 to 17, which then rose slightly until a peak in fiscal year 2018 to 19 at 5,014 admissions, prior to dropping to its lowest point in fiscal year 2020 to 21 at 3,133 admissions. Full data are available immediately below.
Figure C4 Notes
Source: Correctional Service Canada.
- After peaking at 8,071 in 2012-13, the number of admissions has decreased by 13.2% in 2019-20. There was a sharp decrease of 25.7% between 2019-20 to 2020-21.
- The number of warrant of committal admissions has fluctuated over the past decade with a 7.7% decline from 2011-12 to 2019-20 followed by a 32.6% decrease between 2019-20 to 2020-21.
Other includes transfers from other jurisdictions (exchange of services), terminations, transfers from foreign countries, and admissions where a release is interrupted as a consequence of a new conviction.
Warrant of committal is a new admission to federal jurisdiction from the courts.
Revocation is when an offender is admitted to federal custody after conditional release and before reaching warrant expiry.
These numbers refer to the total number of admissions to a federal institution or Healing Lodge during each fiscal year and may be greater than the actual number of offenders admitted, since an individual offender may be admitted more than once in a given year. A fiscal year runs from April 1 to March 31 of the following year.
There is a lag in the data entry of admissions into CSC's Offender Management System. The admission figures for the most recent year are under-reported by 200-400 admissions at the time of year end data extraction. More accurate figures will be available in the next year's publication. Please use caution when including the most recent year in any trend analysis.
Figure C4 in the 2021 CCRSO corresponds to Figure C3 in the 2020 CCRSO.
| 2016-17 | 2017-18 | 2018-19 | 2019-20 | 2020-21 | ||||||
|---|---|---|---|---|---|---|---|---|---|---|
| Females | Males | Females | Males | Females | Males | Females | Males | Females | Males | |
| Warrant of Committal | ||||||||||
1st Federal Sentence |
375 | 3,354 | 336 | 3,365 | 348 | 3,455 | 325 | 3,175 | 236 | 2,104 |
Subsequent Federal Sentence |
37 | 1,131 | 45 | 1,241 | 36 | 1,165 | 30 | 1,105 | 22 | 758 |
Provincial Sentence |
1 | 9 | 2 | 12 | 0 | 10 | 1 | 9 | 0 | 13 |
Subtotal |
413 | 4,494 | 383 | 4,618 | 384 | 4,630 | 356 | 4,289 | 258 | 2,875 |
Total |
4,907 | 5,001 | 5,014 | 4,645 | 3,133 | |||||
Revocations |
132 | 2,014 | 149 | 1,982 | 145 | 2,110 | 177 | 2,121 | 145 | 1,876 |
Total |
2,146 | 2,131 | 2,255 | 2,298 | 2,021 | |||||
Other |
5 | 95 | 9 | 55 | 5 | 67 | 4 | 61 | 7 | 44 |
Total |
100 | 64 | 72 | 65 | 51 | |||||
Total Admissions |
550 | 6,603 | 541 | 6,655 | 534 | 6,807 | 537 | 6,471 | 410 | 4,795 |
| Total Admissions | 7,153 | 7,196 | 7,341 | 7,008 | 5,205 | |||||
Table C4 Notes
Source: Correctional Service Canada.
Other includes transfers from other jurisdictions (exchange of services), terminations, transfers from foreign countries, and admissions where a release is interrupted as a consequence of a new conviction.
Warrant of committal is a new admission to federal jurisdiction from the courts.
Revocation is when an offender is admitted to federal custody after conditional release and before reaching warrant expiry.
These numbers refer to the total number of admissions to a federal institution or Healing Lodge during each fiscal year and may be greater than the actual number of offenders admitted, since an individual offender may be admitted more than once in a given year. A fiscal year runs from April 1 to March 31 of the following year.
There is a lag in the data entry of admissions into CSC's Offender Management System. The admission figures for the most recent year are under-reported by 200-400 admissions at the time of year end data extraction. More accurate figures will be available in the next year's publication. Please use caution when including the most recent year in any trend analysis.
Table C4 in the 2021 CCRSO corresponds to Table C3 in the 2020 CCRSO.
Warrant of committal admissions to CSC facilities by sex: 10-year trend
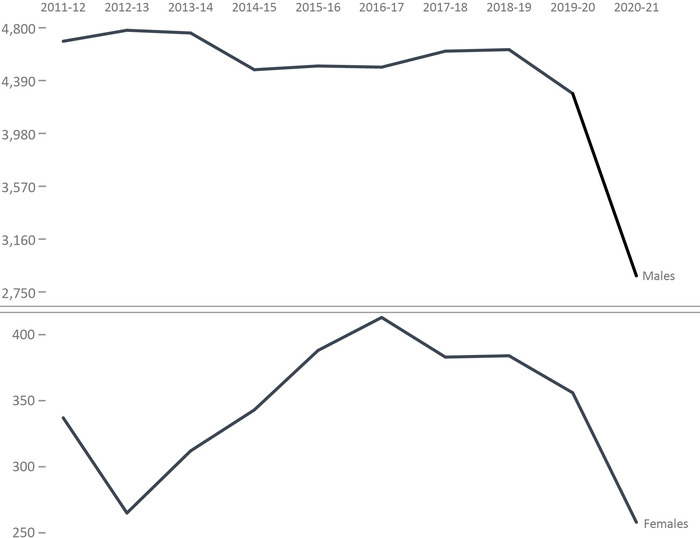
Image description
Line graph showing the admissions for the category of “warrant of committal” admissions to Correctional Service Canada facilities by sex from fiscal year 2011 to 12 until fiscal year 2020 to 21. The female trend began in 2011 to 12 with 337 admissions, dropping to 265 in fiscal year 2012 to 13, before rising until its peak in fiscal year 2016 to 17 at 413, then dropping to 258 in fiscal year 2020 to 21. The male trend is much higher starting at 4,695 in fiscal year 2011 to 12, rising briefly for fiscals years 2012 to 13 and 2013 to 14, at 4,780 and 4,759 admissions respectively. The trend then drops briefly through fiscal years 2014 to 15 through until fiscal year 2016 to 17, before another slight rise in fiscal year 2018 to 19 at 4,630. The trend then drops drastically to 2,875 in fiscal year 2020 to 21. Full data are available immediately below.
Figure C5 Notes
Source: Correctional Service Canada.
- The number of females admitted to CSC facilities under warrants of committal decreased 13.8% from 2016-17 to 2019-20 followed by a 27.5% decline between 2019-20 and 2020-21.
- The number of males admitted to CSC facilities under warrants of committal decreased 4.6% from 2016-17 to 2019-20 followed by a 33.0% decline between 2019-20 and 2020-21.
- Overall, females continue to represent a small proportion of the total number of warrant of committal admissions (i.e., 8.2% in 2020-21).
- At the end of fiscal year 2020-21, there were 618 females in custody within Correctional Service Canada facilities.
A warrant of committal is a new admission to federal jurisdiction from the courts.
These numbers refer to the total number of admissions to a federal institution or Healing Lodge during each fiscal year and may be greater than the actual number of offenders admitted, since an individual offender may be admitted more than once in a given year.
There is a lag in the data entry of admissions into CSC's Offender Management System. The admission figures for the most recent year are under-reported by 200-400 admissions at the time of year end data extraction. More accurate figures will be available in the next year's publication. Please use caution when including the most recent year in any trend analysis.
A fiscal year runs from April 1 to March 31 of the following year.
Figure C5 in the 2021 CCRSO corresponds to Figure C4 in the 2020 CCRSO.
| Year | Females | Males | Total | ||
|---|---|---|---|---|---|
| # | % | # | % | # | |
| 2011-12 | 337 | 6.7% | 4,695 | 93.3% | 5,032 |
| 2012-13 | 265 | 5.3% | 4,780 | 94.7% | 5,045 |
| 2013-14 | 312 | 6.2% | 4,759 | 93.8% | 5,071 |
| 2014-15 | 343 | 7.1% | 4,474 | 92.9% | 4,817 |
| 2015-16 | 388 | 7.9% | 4,503 | 92.1% | 4,891 |
| 2016-17 | 413 | 8.4% | 4,494 | 91.6% | 4,907 |
| 2017-18 | 383 | 7.7% | 4,618 | 92.3% | 5,001 |
| 2018-19 | 384 | 7.7% | 4,630 | 92.3% | 5,014 |
| 2019-20 | 356 | 7.7% | 4,289 | 92.3% | 4,645 |
| 2020-21 | 258 | 8.2% | 2,875 | 91.8% | 3,133 |
Table C5 Notes
Source: Correctional Service of Canada.
A warrant of committal is a new admission to federal jurisdiction from the courts.
These numbers refer to the total number of admissions to a federal institution or Healing Lodge during each fiscal year and may be greater than the actual number of offenders admitted, since an individual offender may be admitted more than once in a given year.
There is a lag in the data entry of admissions into CSC's Offender Management System. The admission figures for the most recent year are under-reported by 200-400 admissions at the time of year end data extraction. More accurate figures will be available in the next year's publication. Please use caution when including the most recent year in any trend analysis.
A fiscal year runs from April 1 to March 31 of the following year.
Table C5 in the 2021 CCRSO corresponds to Table C4 in the 2020 CCRSO.
Number of registered victims by sex: 4-year trend
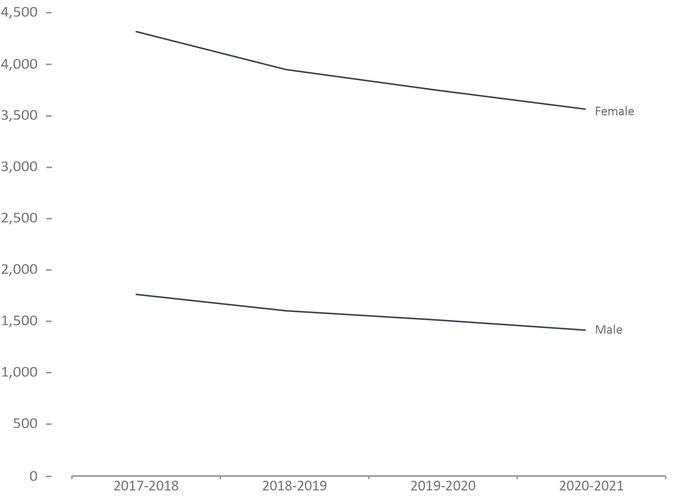
Image description
Line graph of the number of registered victims by sex from fiscal year 2017 to 18 until fiscal year 2020 to 21. The number of male registered victims was lowest, starting at 1,764 in fiscal year 2017 to 18, then decreased steadily until reaching 1,417 in fiscal year 2020 to 21. The female trend was higher, starting at 4,317 in fiscal year 2017 to 2018, also decreasing steadily until reaching 3,565 in fiscal year 2020 to 21. Full data are available immediately below.
Figure C6 Notes
Source: Data Warehouse, Correctional Service of Canada.
- Most registered victims identified as female (71.6%). The split between male and female victims has remained fairly consistent in the last 3 years.
In order to register to receive information, a victim must meet the definition of a victim under the Corrections and Conditional Release Act (CCRA). Victims of federal offenders must be at least 18 years-old or legally emancipated or demonstrate they can act for themselves. Victims can register with the Correctional Service of Canada or the Parole Board of Canada.
Under the Corrections and Conditional Release Act (CCRA), a person can be a victim of a crime if: they are a spouse, conjugal partner, relative of, or person legally responsible for a victim who has died.
Demographic information was voluntarily self-reported, by victims who have registered to receive information about the offender that harmed them. The information does not represent victims that have not been in contact with CSC or those who choose not to register.
Response rates for victim sex fell from 75.6% in 2017-18 to 57.2% in 2020-21. Response rates were calculated as the number who provided a valid response to the question (the total number across the categories reported above) divided by the total number of responses that included the following additional categories: 1) Does Not Want to Provide this information and 2) Not Entered.
Figure C6 in the 2021 CCRSO corresponds to Figure F10 in the 2020 CCRSO.
| 2017-18 | 2018-19 | 2019-20 | 2020-21 | |
|---|---|---|---|---|
Male |
1,764 | 1,606 | 1,517 | 1,417 |
Female |
4,317 | 3,947 | 3,750 | 3,565 |
Table C6 Notes
Source: Data Warehouse, Correctional Service of Canada.
In order to register to receive information, a victim must meet the definition of a victim under the Corrections and Conditional Release Act (CCRA). Victims of federal offenders must be at least 18 years-old or legally emancipated or demonstrate they can act for themselves. Victims can register with the Correctional Service of Canada or the Parole Board of Canada.
Under the Corrections and Conditional Release Act (CCRA), a person can be a victim of a crime if: they are a spouse, conjugal partner, relative of, or person legally responsible for a victim who has died.
Demographic information was voluntarily self-reported, by victims who have registered to receive information about the offender that harmed them. The information does not represent victims that have not been in contact with CSC or those who choose not to register.
Response rates for victim sex fell from 75.6% in 2017-18 to 57.2% in 2020-21. Response rates were calculated as the number who provided a valid response to the question (the total number across the categories reported above) divided by the total number of responses that included the following additional categories: 1) Does Not Want to Provide this information and 2) Not Entered.
Table C6 in the 2021 CCRSO corresponds to Table F10 in the 2020 CCRSO.
CSC total offender population by sentence length

Image description
Bar graph showing the sentence length of the Correctional Services of Canada total offender population in fiscal year 2020 to 21. There were 293 sentences of less than 2 years; 4,321 sentences of 2 to less than 3 years; 3,060 sentences of 3 to less than 4 years; 2,157 sentences of 4 to less than 5 years; 1,598 sentences of 5 to less than 6 years; 1,130 sentences of 6 to less than 7 years; 1,795 sentences of 7 to less than 10 years; 999 sentences of 10 to less than 15 years; 404 sentences of 15 years or more; and 5,755 sentences of a life sentence or an indeterminate sentence. Full data are available below.
Figure C7 Notes
Source: Correctional Service of Canada.
- In 2020-21, almost half (45.7%) of the total offender population was serving a sentence of less than 5 years with 20.1% serving a sentence between two years and less than three years.
- 5,755 offenders were serving a life and/or indeterminate sentenceFootnote * representing 26.8% of the total offender population. The total number of offenders with a life and/or indeterminate sentences has increased 4.8% since 2016-17 from 5,492 to 5,755 in 2020-2021.
Total Offender Population includes all active offenders, who are incarcerated in a CSC facility, offenders on temporary absence from a CSC facility, offenders who are temporarily detained, offenders who are actively supervised, and offenders who are unlawfully at large for less than 90 days.
The group of offenders serving a sentence less than 2 years includes offenders transferred from foreign countries or offenders under a long-term supervision order who received a new sentence of less than 2 years.
Figure C7 in the 2021 CCRSO corresponds to Figure C5 in the 2020 CCRSO.
| Sentence Length | 2016-17 | 2017-18 | 2018-19 | 2019-20 | 2020-21 | |||||
|---|---|---|---|---|---|---|---|---|---|---|
| # | % | # | % | # | % | # | % | # | % | |
| < than 2 years | 307 | 1.3 | 348 | 1.5 | 307 | 1.3 | 307 | 1.3 | 293 | 1.4 |
| 2 years to < 3 years | 5,391 | 23.4 | 5,412 | 23.3 | 5,457 | 23.3 | 5,149 | 22.3 | 4,321 | 20.1 |
| 3 years to < 4 years | 3,377 | 14.7 | 3,378 | 14.5 | 3,436 | 14.6 | 3,389 | 14.7 | 3,060 | 14.2 |
| 4 years to < 5 years | 2,382 | 10.3 | 2,342 | 10.1 | 2,368 | 10.1 | 2,371 | 10.3 | 2,157 | 10.0 |
| 5 years to < 6 years | 1,691 | 7.3 | 1,674 | 7.2 | 1,711 | 7.3 | 1,692 | 7.3 | 1,598 | 7.4 |
| 6 years to < 7 years | 1,143 | 5.0 | 1,186 | 5.1 | 1,172 | 5.0 | 1,153 | 5.0 | 1,130 | 5.3 |
| 7 years to < 10 years | 1,810 | 7.9 | 1,811 | 7.8 | 1,857 | 7.9 | 1,841 | 8.0 | 1,795 | 8.3 |
| 10 years to < 15 years | 951 | 4.1 | 979 | 4.2 | 998 | 4.3 | 1,010 | 4.4 | 999 | 4.6 |
| 15 years or more | 501 | 2.2 | 474 | 2.0 | 445 | 1.9 | 426 | 1.8 | 404 | 1.9 |
| Life and/or Indeterminate Sentence | 5,492 | 23.8 | 5,619 | 24.2 | 5,713 | 24.3 | 5,764 | 25.0 | 5,755 | 26.8 |
| Total | 23,045 | 100.0 | 23,223 | 100.0 | 23,464 | 100.0 | 23,102 | 100.0 | 21,512 | 100.0 |
Table C7 Notes
Source: Correctional Service of Canada.
Total Offender Population includes all active offenders, who are incarcerated in a CSC facility, offenders on temporary absence from a CSC facility, offenders who are temporarily detained, offenders who are actively supervised, and offenders who are unlawfully at large for less than 90 days.
The group of offenders serving a sentence less than 2 years includes offenders transferred from foreign countries or offenders under a long term supervision order who received a new sentence of less than 2 years.
Indeterminate means that the offender’s term of imprisonment does not have an end date. The parole Board of Canada reviews the case after seven years and every two years after that.
Table C7 in the 2021 CCRSO corresponds to Table C5 in the 2020 CCRSO.
Offences of victimization among registered victims
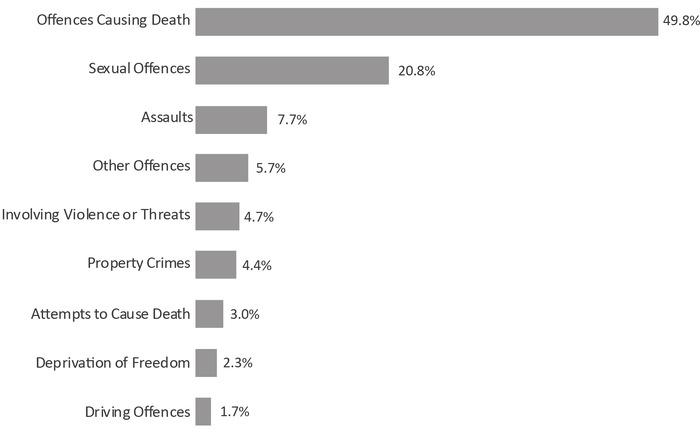
Image description
Bar graph showing the offence types that were the crimes experienced by registered victims in fiscal year 2020 to 21. Offences causing death account for 49.8 percent of the criminal offences for which victims were registered; followed by sexual offences which account for 20.8 percent of offences associated with the registration of victims; assaults which account for 7.7 percent; other offences which account for 5.7 percent; involving violence of threats which account for 4.7 percent; property crimes which account for 4.4 percent; attempts to cause death which account for 3.0 percent; deprivation of freedom which account for 2.3 percent; and finally, driving offences which account for 1.7 percent. Full data are available below.
Figure C8 Notes
Source: Data Warehouse, Correctional Service of Canada.
- Offences causing death accounted for almost half of offences of victimization (49.8%).
- Sexual offences were the second most common offence of victimization (20.8%).
In order to register to receive information, a victim must meet the definition of a victim under the Corrections and Conditional Release Act (CCRA). Victims of federal offenders must be at least 18 years-old or legally emancipated or demonstrate they can act for themselves. Victims can register with the Correctional Service of Canada or the Parole Board of Canada.
Under the Corrections and Conditional Release Act (CCRA), a person can be a victim of a crime if: they are a spouse, conjugal partner, relative of, or person legally responsible for a victim who has died.
Offences of victimization are acts the offender committed that harmed the victim, and have been confirmed using police reports or judge's comments. The offender may not have been convicted of each act or may be serving a federal sentence for different offences. This could be a result of plea deals, because charges were not pursued by the Crown, or the offence may be from a previous sentence or a provincial sentence. Offences of victimization are among victims registered with the federal correctional system.
More than one offence of victimization may be recorded for each victim of crime.
Figure C8 in the 2021 CCRSO corresponds to Figure F8 in the 2020 CCRSO.
| 2017-18 | 2018-19 | 2019-20 | 2020-21 | |||||
|---|---|---|---|---|---|---|---|---|
| # | % | # | % | # | % | # | % | |
| Offence Causing Death | 5,153 | 49.8 | 5,413 | 48.5 | 5,643 | 47.8 | 5,656 | 49.8 |
| Sexual Offences | 2,141 | 20.7 | 2,381 | 21.3 | 2,528 | 21.4 | 2,361 | 20.8 |
| Assaults | 788 | 7.6 | 883 | 7.9 | 938 | 7.9 | 874 | 7.7 |
| Other Offences | 606 | 5.9 | 688 | 6.2 | 767 | 6.5 | 644 | 5.7 |
| Violence/Threat of Violence | 485 | 4.7 | 504 | 4.5 | 541 | 4.6 | 537 | 4.7 |
| Property Crimes | 464 | 4.5 | 509 | 4.6 | 540 | 4.6 | 499 | 4.4 |
| Attempt to Cause Death | 296 | 2.9 | 317 | 2.8 | 338 | 2.9 | 339 | 3.0 |
| Deprivation of Freedom | 250 | 2.4 | 263 | 2.4 | 281 | 2.4 | 261 | 2.3 |
| Driving Offences | 160 | 1.5 | 214 | 1.9 | 233 | 2.0 | 190 | 1.7 |
| Total Number of Offences | 10,343 | 100.0 | 11,172 | 100.0 | 11,809 | 100.0 | 11,361 | 100.0 |
Table C8 Notes
Source: Data Warehouse, Correctional Service of Canada.
In order to register to receive information, a victim must meet the definition of a victim under the Corrections and Conditional Release Act (CCRA). Victims of federal offenders must be at least 18 years-old or legally emancipated or demonstrate they can act for themselves. Victims can register with the Correctional Service of Canada or the Parole Board of Canada.
Under the Corrections and Conditional Release Act (CCRA), a person can be a victim of a crime if: they are a spouse, conjugal partner, relative of, or person legally responsible for a victim who has died.
Offences of victimization are acts the offender committed that harmed the victim, and have been confirmed using police reports or judge's comments. The offender may not have been convicted of each act or may be serving a federal sentence for different offences. This could be a result of plea deals, because charges were not pursued by the Crown, or the offence may be from a previous sentence or a provincial sentence. Offences of victimization are among victims registered with the federal correctional system.
More than one offence of victimization may be recorded for each victim of crime.
Table C8 in the 2021 CCRSO corresponds to Table F8 in the 2020 CCRSO.
Warrant of committal admissions to a CSC facility by age
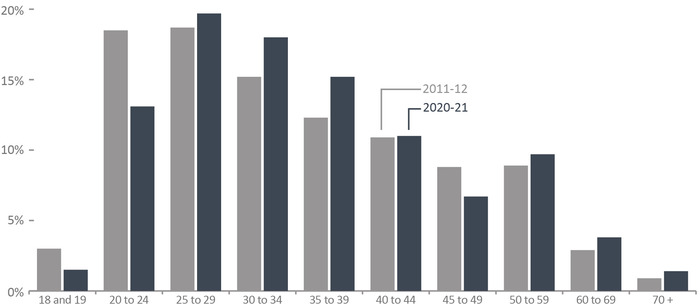
Image description
Bar graph showing the percentage of warrant committal admissions to a Correctional Services of Canada facility by age for fiscal year 2011 to 12 and for fiscal year 2020 to 21. Over time, the percentage of admissions decreased in the 18 and 19 age group; the 20 to 24 age group; and, the 45 to 49 age group. The percentage of admissions increased over time for all other age groups, including the 25 to 29 age group; the 30 to 34 age group; the 35 to 39 age group; the 40 to 44 age group; the 50 to 59 age group; the 60 to 69 age group; and the 70 plus age group. Full data are available below.
Figure C9 Notes
Source: Correctional Service of Canada.
- In 2020-21, 32.7% of offenders admitted on a warrant of committal to CSC facilities were between the ages of 20 and 29, and 33.1% were between 30 and 39 years of age.
- In both 2020-21 and 2011-12 most warrant of committal admissions were among those ages 25 to 29.
- The distribution of age upon admission is similar for both male and female.
- The median age of the population upon admission in 2020-21 was 34, compared to a median age of 33 in 2011-12.
- The number of offenders between the ages of 40 and 49 at admission decreased from 990 in 2011-12 to 556 in 2020-21, representing a 43.8% decrease.
- The number of offenders between the ages of 50 and 59 at admission decreased from 448 in 2011-12 to 305 in 2020-21 representing a 31.9% decrease.
A warrant of committal is a new admission to federal jurisdiction from the courts.
These numbers refer to the total number of admissions to a federal institution or Healing Lodge during each fiscal year and may be greater than the actual number of offenders admitted, since an individual offender may be admitted more than once in a given year.
There is a lag in the data entry of admissions into CSC’s Offender Management System. The admission figures for the most recent year are under-reported by 200-400 admissions at the time of year end data extraction. More accurate figures will be available in the next year’s publication. Please use caution when including the most recent year in any trend analysis.
Due to rounding, percentages may not add to 100 percent.
Figure C9 in the 2021 CCRSO corresponds to Figure C6 in the 2020 CCRSO.
| Age at Admission | 2011-12 | 2020-21 | ||||||||||
|---|---|---|---|---|---|---|---|---|---|---|---|---|
| Females | Males | Total | Females | Males | Total | |||||||
| # | % | # | % | # | % | # | % | # | % | # | % | |
| 18 and 19 | 11 | 3.3 | 140 | 3.0 | 151 | 3.0 | 3 | 1.2 | 43 | 1.5 | 46 | 1.5 |
| 20 to 24 | 56 | 16.6 | 874 | 18.6 | 930 | 18.5 | 38 | 14.7 | 371 | 12.9 | 409 | 13.1 |
| 25 to 29 | 73 | 21.7 | 867 | 18.5 | 940 | 18.7 | 55 | 21.3 | 561 | 19.5 | 616 | 19.7 |
| 30 to 34 | 47 | 13.9 | 718 | 15.3 | 765 | 15.2 | 49 | 19.0 | 514 | 17.9 | 563 | 18.0 |
| 35 to 39 | 47 | 13.9 | 570 | 12.1 | 617 | 12.3 | 33 | 12.8 | 442 | 15.4 | 475 | 15.2 |
| 40 to 44 | 34 | 10.1 | 515 | 11.0 | 549 | 10.9 | 38 | 14.7 | 307 | 10.7 | 345 | 11.0 |
| 45 to 49 | 29 | 8.6 | 412 | 8.8 | 441 | 8.8 | 14 | 5.4 | 197 | 6.9 | 211 | 6.7 |
| 50 to 59 | 32 | 9.5 | 416 | 8.9 | 448 | 8.9 | 21 | 8.1 | 284 | 9.9 | 305 | 9.7 |
| 60 to 69 | 7 | 2.1 | 140 | 3.0 | 147 | 2.9 | 7 | 2.7 | 112 | 3.9 | 119 | 3.8 |
| 70 and over | 1 | 0.3 | 43 | 0.9 | 44 | 0.9 | 0 | 0.0 | 44 | 1.5 | 44 | 1.4 |
| Total | 337 | 4,695 | 5,032 | 258 | 2,875 | 3,133 | ||||||
Table C9 Notes
Source: Correctional Service of Canada.
A warrant of committal is a new admission to federal jurisdiction from the courts.
These numbers refer to the total number of admissions to a federal institution or Healing Lodge during each fiscal year and may be greater than the actual number of offenders admitted, since an individual offender may be admitted more than once in a given year.
There is a lag in the data entry of admissions into CSC’s Offender Management System. The admission figures for the most recent year are under-reported by 200-400 admissions at the time of year end data extraction. More accurate figures will be available in the next year’s publication. Please use caution when including the most recent year in any trend analysis. Due to rounding, percentages may not add to 100 percent.
Table C9 in the 2021 CCRSO corresponds to Table C6 in the 2020 CCRSO.
Number of registered victims by age
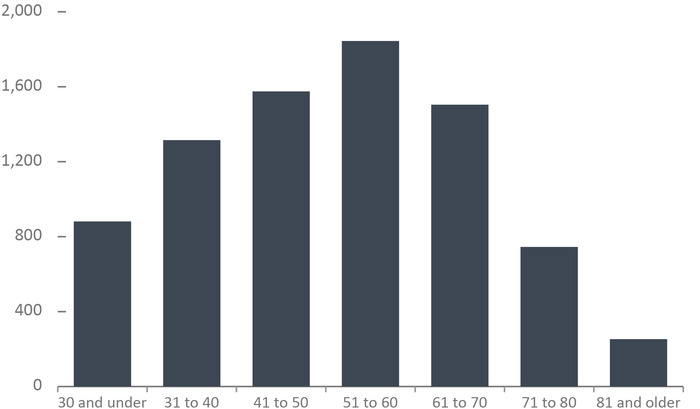
Image description
Bar graph showing the number of registered victims by age in fiscal year 2020 to 21. There were 878 registered victims aged 30 and under, with the numbers rising by ascending decennial age grouping until reaching the highest number of registered victims in the 51 to 60 age group. The number of registered victims then decreased by ascending decade age group until reaching the age group with the fewest registered victims of 253 for those 81 years of age and older. Full data are available immediately below.
Figure C10 Notes
Source: Data Warehouse, Correctional Service of Canada.
- In 2020-21, 60.7% of registered victims were aged 41 to 70. The greatest proportion of victims was in the 51-60 age group (22.7%). This pattern has remained fairly consistent in the last three years.
In order to register to receive information, a victim must meet the definition of a victim under the Corrections and Conditional Release Act (CCRA). Victims of federal offenders must be at least 18 years-old or legally emancipated or demonstrate they can act for themselves. Victims can register with the Correctional Service of Canada or the Parole Board of Canada.
Under the Corrections and Conditional Release Act (CCRA), a person can be a victim of a crime if: they are a spouse, conjugal partner, relative of, or person legally responsible for a victim who has died.
Demographic information was voluntarily self-reported, by victims who have registered to receive information about the offender that harmed them. The information does not represent victims that have not been in contact with Correctional Service of Canada or those who choose not to register.
Response rates ranged from 90.1% in 2017-18 to 93.2% in 2020-21. Response rates were calculated as the number who provided a valid response to the question (the total number across the categories reported above) divided by the total number of responses that included the following additional categories: 1) Does Not Want to Provide this information and 2) Not Entered.
Figure C10 in the 2021 CCRSO corresponds to Figure F9 in the 2020 CCRSO.
| 2017-18 | 2018-19 | 2019-20 | 2020-21 | |||||
|---|---|---|---|---|---|---|---|---|
| # | % | # | % | # | % | # | % | |
| 30 and under | 812 | 11.2 | 883 | 11.4 | 948 | 11.6 | 878 | 10.8 |
| 31 to 40 | 1,158 | 16.0 | 1,225 | 15.8 | 1,274 | 15.6 | 1,315 | 16.2 |
| 41 to 50 | 1,430 | 19.7 | 1,521 | 19.6 | 1,599 | 19.6 | 1,575 | 19.4 |
| 51 to 60 | 1,846 | 25.5 | 1,885 | 24.3 | 1,931 | 23.6 | 1,844 | 22.7 |
| 61 to 70 | 1,216 | 16.8 | 1,375 | 17.7 | 1,457 | 17.8 | 1,504 | 18.5 |
| 71 to 80 | 595 | 8.2 | 651 | 8.4 | 715 | 8.8 | 745 | 9.2 |
| 81 and older | 188 | 2.6 | 214 | 2.8 | 246 | 3.0 | 253 | 3.1 |
Table C10 Notes
Source: Data Warehouse, Correctional Service of Canada.
In order to register to receive information, a victim must meet the definition of a victim under the Corrections and Conditional Release Act (CCRA). Victims of federal offenders must be at least 18 years-old or legally emancipated or demonstrate they can act for themselves. Victims can register with the Correctional Service of Canada or the Parole Board of Canada.
Under the Corrections and Conditional Release Act (CCRA), a person can be a victim of a crime if: they are a spouse, conjugal partner, relative of, or person legally responsible for a victim who has died.
Demographic information was voluntarily self-reported, by victims who have registered to receive information about the offender that harmed them. The information does not represent victims that have not been in contact with Correctional Service of Canada or those who choose not to register.
Response rates ranged from 90.1% in 2017-18 to 93.2% in 2020-21. Response rates were calculated as the number who provided a valid response to the question (the total number across the categories reported above) divided by the total number of responses that included the following additional categories: 1) Does Not Want to Provide this information and 2) Not Entered.
Table C10 in the 2021 CCRSO corresponds to Table F9 in the 2020 CCRSO.
Warrant of committal admissions to a CSC facility for Indigenous and non-Indigenous offenders

Image description
Bar graph showing the percentage of warrant committal admissions to a Correctional Services of Canada facility by age for Indigenous and non-Indigenous offenders in the 2020 to 21 fiscal year. There was a higher percentage of Indigenous offenders in the 18 and 19 age group; the 20 to 24 age group; the 25 to 29 age group; and the 30 to 34 age group. There was a higher percentage of non-Indigenous offenders for the 35 to 39 age group; the 40 to 44 age group; the 45 to 49 age group; the 50 to 59 age group; the 60 to 69 age group; and the 70 plus age group. Full data are available below.
Figure C11 Notes
Source: Correctional Service of Canada.
- Of those offenders admitted on a warrant of committal to CSC facilities in 2020-21, 42.5% of Indigenous offenders were under the age of 30, compared to 30.6% of non-Indigenous offenders.
- The median age of Indigenous offenders at admission was 31, compared to a median age of 35 for non-Indigenous offenders.
- The median age of Indigenous female offenders at admission was 28, compared to a median age of 37 for non-Indigenous female offenders.
A warrant of committal is a new admission to federal jurisdiction from the courts.
These numbers refer to the total number of admissions to a federal institution or Healing Lodge during each fiscal year and may be greater than the actual number of offenders admitted, since an individual offender may be admitted more than once in a given year.
There is a lag in the data entry of admissions into CSC’s Offender Management System. The admission figures for the most recent year are under-reported by 200-400 admissions at the time of year end data extraction. More accurate figures will be available in the next year’s publication. Please use caution when including the most recent year in any trend analysis.
Due to rounding, percentages may not add to 100 percent.
Figure C11 in the 2021 CCRSO corresponds to Figure C7 in the 2020 CCRSO.
| Age at Admission | 2011-12 | 2020-21 | ||||||||||
|---|---|---|---|---|---|---|---|---|---|---|---|---|
| Indigenous | Non- Indigenous | Total | Indigenous | Non- Indigenous | Total | |||||||
| # | % | # | % | # | % | # | % | # | % | # | % | |
| 18 and 19 | 62 | 5.0 | 89 | 2.3 | 151 | 3.0 | 21 | 2.2 | 25 | 1.1 | 46 | 1.5 |
| 20 to 24 | 284 | 22.9 | 646 | 17.0 | 930 | 18.5 | 151 | 16.0 | 258 | 11.8 | 409 | 13.1 |
| 25 to 29 | 258 | 20.8 | 682 | 18.0 | 940 | 18.7 | 229 | 24.3 | 387 | 17.7 | 616 | 19.7 |
| 30 to 34 | 194 | 15.7 | 571 | 15.1 | 765 | 15.2 | 195 | 20.7 | 368 | 16.8 | 563 | 18.0 |
| 35 to 39 | 126 | 10.2 | 491 | 12.9 | 617 | 12.3 | 124 | 13.1 | 351 | 16.0 | 475 | 15.2 |
| 40 to 44 | 135 | 10.9 | 414 | 10.9 | 549 | 10.9 | 97 | 10.3 | 248 | 11.3 | 345 | 11.0 |
| 45 to 49 | 96 | 7.8 | 345 | 9.1 | 441 | 8.8 | 44 | 4.7 | 167 | 7.6 | 211 | 6.7 |
| 50 to 59 | 62 | 5.0 | 386 | 10.2 | 448 | 8.9 | 68 | 7.2 | 237 | 10.8 | 305 | 9.7 |
| 60 to 69 | 15 | 1.2 | 132 | 3.5 | 147 | 2.9 | 11 | 1.2 | 108 | 4.9 | 119 | 3.8 |
| 70 and over | 6 | 0.5 | 38 | 1.0 | 44 | 0.9 | 4 | 0.4 | 40 | 1.8 | 44 | 1.4 |
| Total | 1,238 | 3,794 | 5,032 | 944 | 2,189 | 3,133 | ||||||
Table C11 Notes
Source: Correctional Service of Canada.
A warrant of committal is a new admission to federal jurisdiction from the courts.
These numbers refer to the total number of admissions to a federal institution or Healing Lodge during each fiscal year and may be greater than the actual number of offenders admitted, since an individual offender may be admitted more than once in a given year.
There is a lag in the data entry of admissions into CSC’s Offender Management System. The admission figures for the most recent year are under-reported by 200-400 admissions at the time of year end data extraction. More accurate figures will be available in the next year’s publication. Please use caution when including the most recent year in any trend analysis.
Due to rounding, percentages may not add to 100 percent.
Table C11 in the 2021 CCRSO corresponds to Table C7 in the 2020 CCRSO.
Age of the CSC in-custody offender population compared to the Canadian adult population
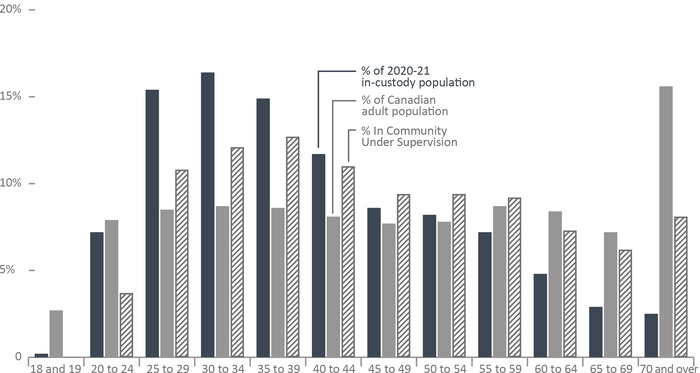
Image description
Bar graph comparing the percentage of the in-custody offender population of fiscal year 2020 to 21 with the Canadian adult population of the year 2020 by age group. The age group representing the most likely people to be in-custody during the 2020 to 21 fiscal year are thirty to 34 year olds, an age group that represents about 8 percent of the Canadian population. This is the age grouping that is most over-represented in the in-custody population. The proportion of the in-custody population falls for each age group until reaching a low of about three percent of in-custody population being 70 years old or older. Because there are more Canadians who are 55 to 64 years of age than between ages 40 to 54, overrepresentation by age declines even more rapidly than the proportion in-custody. The proportion of people under community supervision rises quickly from under 5 percent for 20 to 24 year olds to a high of about 13 percent amongst 35 to 39 year olds, declining unevenly until a plateau of just under 10 percent of those aged 45 to 59 being under supervision orders in the community. Full data are available immediately below.
Figure C12 Notes
Sources: Correctional Service of Canada; Table 17-10-0005-01, Annual Demographic Estimates: Canada, Provinces, and Territories, Canadian Centre for Justice and Community Safety Statistics, Statistics Canada.
- In 2020-21, 54.1% of in-custody offenders were under the age of 40.
- In 2020-21, 25.6% of the in-custody offender population was aged 50 and over.
- The community offender population was older than the in-custody population; 40.3% of offenders in the community were aged 50 and over, compared to 25.6% of the in-custody offenders in this age group.
In-custody population includes all active offenders incarcerated in a CSC facility, offenders on temporary absence from a CSC facility, offenders who are temporarily detained in a CSC facility and offenders on remand in a CSC facility.
In Community Under Supervision includes all active offenders on day parole, full parole, statutory release, or in the community supervised on a long term supervision order, offenders who are temporarily detained in a non-CSC facility, offenders who are unlawfully at large for less than 90 days, offenders on remand in a non-CSC facility, and offenders supervised and subject to an immigration hold by Canada Border Services Agency.
Due to rounding, percentage may not add to 100 percent.
Figure C12 in the 2021 CCRSO corresponds to Figure C8 in the 2020 CCRSO.
| Age | In Custody | In Community Under Supervision | Total | % of Canadian Adult Population | |||
|---|---|---|---|---|---|---|---|
| # | % | # | % | # | % | % | |
18 and 19 |
26 | 0.2 | 0 | 0.0 | 26 | 0.1 | 2.7 |
20 to 24 |
896 | 7.2 | 341 | 3.7 | 1,237 | 5.8 | 7.9 |
25 to 29 |
1,909 | 15.4 | 982 | 10.8 | 2,891 | 13.4 | 8.5 |
30 to 34 |
2,031 | 16.4 | 1,103 | 12.1 | 3,134 | 14.6 | 8.7 |
35 to 39 |
1,848 | 14.9 | 1,157 | 12.7 | 3,005 | 14.0 | 8.6 |
40 to 44 |
1,449 | 11.7 | 1,003 | 11.0 | 2,452 | 11.4 | 8.1 |
45 to 49 |
1,064 | 8.6 | 856 | 9.4 | 1,920 | 8.9 | 7.7 |
50 to 54 |
1,015 | 8.2 | 860 | 9.4 | 1,875 | 8.7 | 7.8 |
55 to 59 |
896 | 7.2 | 840 | 9.2 | 1,736 | 8.1 | 8.7 |
60 to 64 |
593 | 4.8 | 664 | 7.3 | 1,257 | 5.8 | 8.4 |
65 to 69 |
356 | 2.9 | 566 | 6.2 | 922 | 4.3 | 7.2 |
70 and over |
316 | 2.5 | 741 | 8.1 | 1,057 | 4.9 | 15.6 |
Total |
12,399 | 100.0 | 9,113 | 100.0 | 21,512 | 100.0 | 100.0 |
Table C12 Notes
Sources: Correctional Service of Canada; Table 17-10-0005-01, Annual Demographic Estimates: Canada, Provinces, and Territories, Canadian Centre for Justice and Community Safety Statistics, Statistics Canada.
In-custody population includes all active offenders incarcerated in a CSC facility, offenders on temporary absence from a CSC facility, offenders who are temporarily detained in a CSC facility and offenders on remand in a CSC facility.
In Community Under Supervision includes all active offenders on day parole, full parole, statutory release, or in the community supervised on a long term supervision order, offenders who are temporarily detained in a non-CSC facility, offenders who are unlawfully at large for less than 90 days, offenders on remand in a non-CSC facility, and offenders supervised and subject to an immigration hold by Canada Border Services Agency.
Due to rounding, percentage may not add to 100 percent.
Table C12 in the 2021 CCRSO corresponds to Table C8 in the 2020 CCRSO.
CSC offender population by self-reported race
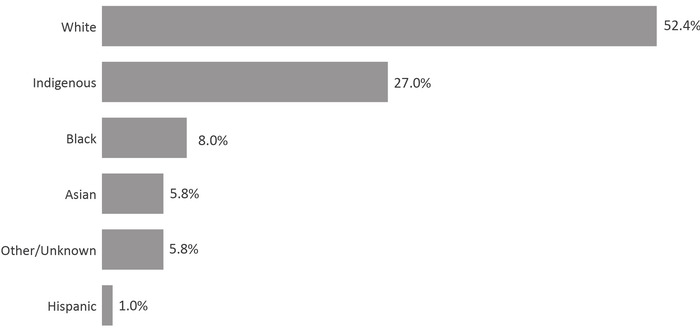
Image description
Bar graph showing the percentage of total Correctional Service of Canada offender population by self-reported race for the fiscal year 2020 to 21. White-identifying offenders accounted for 52.4 percent of the offender population; followed by Indigenous-identifying offenders which accounted for 27.0 percent; Black offenders which account for 8.0 percent; Asian offenders which account for 5.8 percent; other/unknown offenders which account for 5.8 percent; and Hispanic offenders which account for 1.0 percent. Full data are available below.
Figure C13 Notes
Source: Correctional Service of Canada.
- The CSC offender population is becoming more diverse, as evidenced by the decrease in the proportion of White offenders (from 57.9% in 2016-17 to 52.4% in 2020-21). Between 2016-17 and 2020-21, the Indigenous population has increased by 9.2% (from 5,322 to 5,809).
- Indigenous offenders represented 27.0% of the 2020-21 total CSC offender population and 30.1% of 2020-21 warrant of committal admissions to CSC facilities.
White includes offenders who identify as white.
Indigenous includes offenders who identify as Inuit, Innu, Métis and First Nations.
Black includes offenders who identify as black.
Asian includes offenders who identify as Arab, Arab/West Asian, Asian-East and Southeast, Asian-South, Asian West, Asiatic (includes Asian-East and Southeast, Asian South, Asian West, and Asiatic.), Chinese, East Indian, Filipino, Japanese, Korean, South Asian, South East Asian.
Other/Unknown includes offenders who identify as European French, European-Eastern, European-Northern, European-Southern, European-Western, Multiracial/Ethnic, Oceania, British Isles, Caribbean, Sub-Sahara African, offenders unable to identify to one race, other and unknown.
Hispanic includes offenders who identify as Hispanic and Latin American.
The data reflect all active offenders, who are incarcerated in a CSC facility, offenders on temporary absence from a CSC facility, offenders who are temporarily detained, offenders who are actively supervised, and offenders who are unlawfully at large for less than 90 days.
The data reflect the number of offenders active at the end of each fiscal year. A fiscal year runs from April 1 to March 31 of the following year.
Due to rounding, percentages may not add to 100 percent.
Figure C13 in the 2021 CCRSO corresponds to Figure C9 in the 2020 CCRSO.
| 2016-17 | 2020-21 | |||
|---|---|---|---|---|
| # | % | # | % | |
| White | 13,345 | 57.9 | 11,280 | 52.4 |
| Indigenous | 5,322 | 23.1 | 5,809 | 27.0 |
First Nations |
3,577 | 15.5 | 4,000 | 18.6 |
Métis |
1,533 | 6.7 | 1,628 | 7.6 |
Inuit |
212 | 0.9 | 181 | 0.8 |
| Black | 1,729 | 7.5 | 1,717 | 8.0 |
| Asian | 1,257 | 5.5 | 1,243 | 5.8 |
Asiatic |
349 | 1.5 | 391 | 1.8 |
Arab |
183 | 0.8 | 185 | 0.9 |
Arab /West Asian |
174 | 0.8 | 172 | 0.8 |
South East Asian |
214 | 0.9 | 164 | 0.8 |
South Asian |
123 | 0.5 | 134 | 0.6 |
Chinese |
105 | 0.5 | 93 | 0.4 |
Filipino |
75 | 0.3 | 77 | 0.4 |
East Indian |
13 | 0.1 | 13 | 0.1 |
Korean |
14 | 0.1 | 6 | 0.0 |
Japanese |
7 | 0.0 | 8 | 0.0 |
| Hispanic | 246 | 1.1 | 222 | 1.0 |
Latin American |
240 | 1.0 | 217 | 1.0 |
Hispanic |
6 | 0.0 | 5 | 0.0 |
| Other/Unknown | 1,146 | 5.0 | 1,241 | 5.8 |
| Total | 23,045 | 100.0 | 21,512 | 100.0 |
Table C13 Notes
Source: Correctional Service of Canada.
White includes offenders who identify as white.
Indigenous includes offenders who identify as Inuit, Innu, Métis and First Nations.
Black includes offenders who identify as black.
Asian includes offenders who identify as Arab, Arab/West Asian, Asian-East and Southeast, Asian-South, Asian West, Asiatic, Chinese, East Indian, Filipino, Japanese, Korean, South Asian, South East Asian.
Other/Unknown includes offenders who identify as European French, European-Eastern, European-Northern, European-Southern, European-Western, Multiracial/Ethnic, Oceania, British Isles, Caribbean, Sub-Sahara African, offenders unable to identify to one race, other and unknown.
Hispanic includes offenders who identify as are Hispanic and Latin American.
Asiatic includes Asian-East and Southeast, Asian South, Asian West, and Asiatic.
The data reflect all active offenders, who are incarcerated in a CSC facility, offenders on temporary absence from a CSC facility, offenders who are temporarily detained, offenders who are actively supervised, and offenders who are unlawfully at large for less than 90 days.
The data reflect the number of offenders active at the end of each fiscal year. A fiscal year runs from April 1 to March 31 of the following year.
Due to rounding, percentages may not add to 100 percent.
Table C13 in the 2021 CCRSO corresponds to Table C9 in the 2020 CCRSO.
Number of registered victims by race
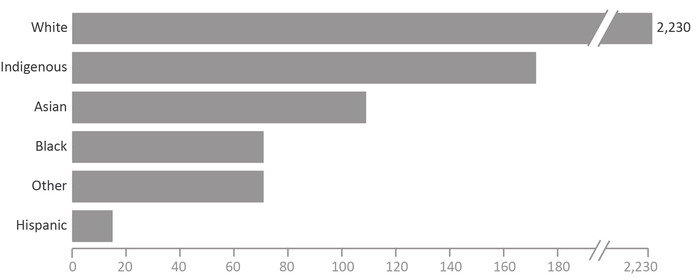
Image description
Bar graph showing the number of registered victims by race in fiscal year 2020 to 21. There were 2,230 White offenders; 172 Indigenous offenders; 71 Black offenders; 71 other offenders; 109 Asian offenders; and 15 Hispanic offenders. Full data are available below.
Figure C14 Notes
Source: Data Warehouse, Correctional Service of Canada.
- Most registered victims (83.6%) identified as White. The next most common ethnicity was Indigenous (6.4%).
In order to register to receive information, a victim must meet the definition of a victim under the Corrections and Conditional Release Act (CCRA). Victims of federal offenders must be at least 18 years-old or legally emancipated or demonstrate they can act for themselves. Victims can register with the Correctional Service of Canada or the Parole Board of Canada.
Under the Corrections and Conditional Release Act (CCRA), a person can be a victim of a crime if: they are a spouse, conjugal partner, relative of, or person legally responsible for a victim who has died.
Demographic information was voluntarily self-reported, by victims who have registered to receive information about the offender that harmed them. The information does not represent victims that have not been in contact with CSC or those who choose not to register.
Response rates for victim ethnicity ranged from 39.8% in 2017-18 to 30.9% in 2020-21.
Figure C14 in the 2021 CCRSO corresponds to Figure F11 in the 2020 CCRSO.
| 2017-18 | 2018-19 | 2019-20 | 2020-21 | |||||
|---|---|---|---|---|---|---|---|---|
| # | % | # | % | # | % | # | % | |
| White | 2,721 | 85.1 | 2,487 | 84.8 | 2,382 | 84.2 | 2,230 | 83.6 |
| Indigenous | 191 | 6.0 | 182 | 6.2 | 181 | 6.4 | 172 | 6.4 |
First Nations |
134 | 4.2 | 128 | 4.4 | 122 | 4.3 | 108 | 4.0 |
Métis |
31 | 1.0 | 30 | 1.0 | 34 | 1.2 | 38 | 1.4 |
Inuit |
26 | 0.8 | 24 | 0.8 | 25 | 0.9 | 26 | 1.0 |
| Black | 77 | 2.4 | 75 | 2.6 | 77 | 2.7 | 71 | 2.7 |
| Asian | 129 | 4.0 | 109 | 3.6 | 107 | 3.8 | 109 | 4.0 |
Arab/West Asian |
16 | 0.5 | 16 | 0.5 | 14 | 0.5 | 13 | 0.5 |
South East Asian |
30 | 0.9 | 26 | 0.9 | 30 | 1.1 | 32 | 1.2 |
South Asian |
39 | 1.2 | 24 | 0.8 | 22 | 0.8 | 22 | 0.8 |
Chinese |
33 | 1.0 | 34 | 1.2 | 34 | 1.2 | 34 | 1.3 |
Filipino |
8 | 0.3 | 7 | 0.2 | 5 | 0.2 | 4 | 0.1 |
Korean |
1 | 0.0 | 1 | 0.0 | 1 | 0.0 | 1 | 0.0 |
Japanese |
2 | 0.1 | 1 | 0.0 | 1 | 0.0 | 3 | 0.1 |
| Hispanic | 15 | 0.5 | 16 | 0.5 | 14 | 0.5 | 15 | 0.6 |
Latin American |
15 | 0.5 | 16 | 0.5 | 14 | 0.5 | 15 | 0.6 |
| Other | 66 | 2.1 | 65 | 2.2 | 68 | 2.4 | 71 | 2.7 |
| Total | 3,259 | 100.0 | 2,986 | 100.0 | 2,889 | 100.0 | 2,732 | 100.0 |
Table C14 Notes
Source: Data Warehouse, Correctional Service of Canada.
In order to register to receive information, a victim must meet the definition of a victim under the Corrections and Conditional Release Act (CCRA). Victims of federal offenders must be at least 18 years-old or legally emancipated or demonstrate they can act for themselves. Victims can register with the Correctional Service of Canada or the Parole Board of Canada.
Under the Corrections and Conditional Release Act (CCRA), a person can be a victim of a crime if: they are a spouse, conjugal partner, relative of, or person legally responsible for a victim who has died.
Demographic information was voluntarily self-reported, by victims who have registered to receive information about the offender that harmed them. The information does not represent victims that have not been in contact with CSC or those who choose not to register.
Response rates for victim ethnicity ranged from 39.8% in 2017-18 to 30.9% in 2020-21.
Table C14 in the 2021 CCRSO corresponds to Table F11 in the 2020 CCRSO.
CSC offender population by religion
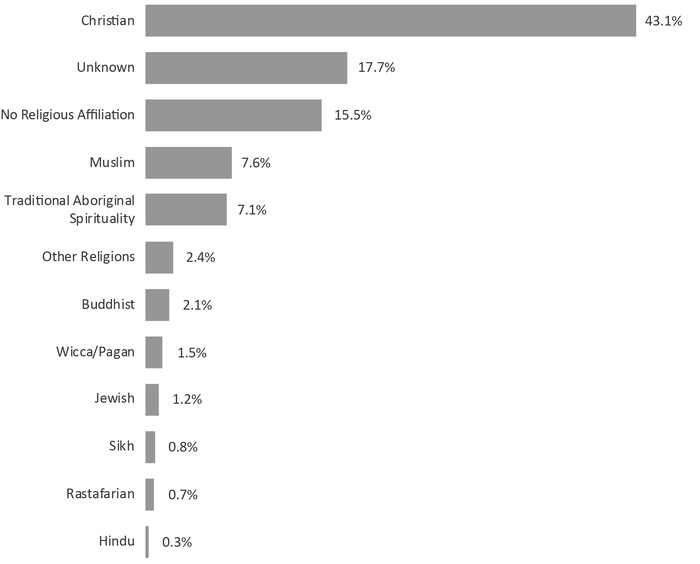
Image description
Bar graph showing the percentage of total Correctional Service of Canada offender population by religious identification in fiscal year 2020 to 21. Christian offenders accounted for 43.1 percent of the offender population; the religious affiliation for 17.7 percent of offenders was not known; offenders with no religious affiliation accounted for 15.5 percent of offenders; Muslim offenders account for 7.6 percent; offenders reporting following the teachings of Traditional Aboriginal Spirituality accounted for 7.1 percent; offenders of the category of “other religions” accounted for 2.4 percent; Buddhist offenders accounted for 2.1 percent; Wiccan and Pagan offenders accounted for 1.5 percent; Jewish offenders accounted for 1.2 percent; Sikh offenders accounted for 0.8 percent; Rastafarian offenders accounted for 0.7 percent; and, Hindu offenders accounted for 0.3 percent. Full data are available below.
Figure C15 Notes
Source: Correctional Service of Canada.
- The religious identification of the CSC offender population is diverse. While the proportion of offenders who identified as Christian still represented the majority, their proportions decreased from 51.2% in 2016-2017 to 43.1% in 2020-2021.
- Religious identification was unknown for 17.7% of offenders, whereas 15.5% stated they had no religion.
- Note that the religion groupings have changed in the 2018 publication to reflect the same groupings as Statistics Canada.
Religious identification is self-reported by offenders while they are incarcerated, and the categories are not comprehensive; therefore, the reader should interpret these data with caution.
Buddhist includes offenders who belong to the following group: Buddhist, Mahayana Buddhist, Theravadan Buddhist and Vajrayana Buddhist.
Christian includes offenders who belong to the following group: Amish, Anglican (Episcopal Church of England), Antiochian Orthodox, Apostolic Christian Church, Armenian Orthodox/Apostolic, Associated Gospel, Assyrian Chaldean Catholic, Baptist, Brethren In Christ, Bulgarian Orthodox, Canadian Reformed Church, Catholic- Greek, Catholic-Roman, Catholic-Ukranian, Catholic Non-Specific, Churches of Christ/Christian Churches, Charismatic, Christadelphian, Christian & Missionary Alliance, Christian Congregational, Christian Non Specific, Christian Or Plymouth Brethren, Christian Orthodox, Christian Reformed, Christian Reformed Church, Christian Science, Church of Christ Scientist, Church of God, Church of Jesus Christ of Latter-Day Saint, Community of Christ, Coptic Orthodox, Doukhobor, Dutch Reformed Church, Ethiopian Orthodox, Evangelical, Evangelical Free Church , Evangelical Missionary Church, Free Methodist, Free Reformed Church, Grace Communion International, Greek Orthodox, Hutterite, Iglesia Ni Cristo, Jehovah's Witnesses, Lutheran, Macedonian Orthodox, Maronite, Melkite, Mennonite, Messianic Jew, Methodist Christian, Metropolitan Community Church, Mission de l'Esprit Saint, Moravian, Mormon (Latter Day Saints), Nazarene Christian, Netherlands Reformed, New Apostolic, Pentecostal (4-Square), Pentecostal Assembly of God, Pentecôtiste, Philadelphia Church of God, Presbyterian, Protestant Non-Specific, Quaker (Society of Friends), Reformed Christian, Romanian Orthodox, Russian Orthodox, Salvation Army, Serbian Orthodox, Seventh Day Adventist, Shaker, Swedenborgian (New Church), Syrian/Syriac Orthodox, Ukrainian Catholic, Ukrainian Orthodox, United Church, United Reformed Church, Vineyard Christian Fellowship, Wesleyan Christian and Worldwide Church of God.
Hindu includes offenders who belong to the following group: Hindu and Siddha Yoga.
Jewish includes offenders who belong to the following group: Jewish Orthodox, Jewish Reformed and Judaism.
Muslim includes offenders who belong to the following group: Muslim and Sufism.
Rastafarian includes offenders who belong to the following group: Rastafarian.
Sikh includes offenders who belong to the following group: Sikh.
Traditional Indigenous Spirituality includes offenders who belong to the following group: Indigenous Spirituality Catholic, Traditional Indigenous Protestant, Native Spirituality, Catholic - Native Spirituality, Native Spirituality Protestant and Indigenous Spirituality.
Wiccan/Pagan includes offenders who belong to the following group: Asatru Paganism, Druidry Paganism, Pagan and Wicca.
Other Religion includes offenders who belong to the following group: Baha'i, Eckankar, Independent Spirituality, Jain, Krishna, New Age, New Thought-Unity-Religious Science, Other, Pantheist, Rosicrucian, Satanist, Scientology, Shintoïste, Spiritualist, Taoism, Transcendental Meditation, Unification Church, Unitarian, Visnabha and Zoroastrian.
No religion Affiliation includes offenders who belong to the following group: Agnostic, Atheist, Gnostic, Humanist and offenders who have no religion affiliation.
Unknown includes offenders who belong to the following group: Unknown, not stated as well as those offenders who have no religion specified.
The data reflect all active offenders, who are incarcerated in a CSC facility, offenders on temporary absence from a CSC facility, offenders who are temporarily detained, offenders who are actively supervised, and offenders who are unlawfully at large for less than 90 days.
The data reflect the number of offenders active at the end of each fiscal year. A fiscal year runs from April 1 to March 31 of the following year.
Due to rounding, percentages may not add to 100 percent.
Figure C15 in the 2021 CCRSO corresponds to Figure C10 in the 2020 CCRSO.
| 2016-17 | 2020-21 | |||
|---|---|---|---|---|
| # | % | # | % | |
| Buddhist | 489 | 2.1 | 447 | 2.1 |
| Christian | 11,800 | 51.2 | 9,271 | 43.1 |
| Hindu | 57 | 0.2 | 60 | 0.3 |
| Jewish | 177 | 0.8 | 251 | 1.2 |
| Muslim | 1,389 | 6.0 | 1,630 | 7.6 |
| Rastafarian | 169 | 0.7 | 157 | 0.7 |
| Sikh | 172 | 0.7 | 181 | 0.8 |
| Traditional Aboriginal Spirituality | 1,303 | 5.7 | 1,535 | 7.1 |
| Wicca/Pagan | 244 | 1.1 | 316 | 1.5 |
| Other Religions | 431 | 1.9 | 523 | 2.4 |
| No Religion Affiliation | 3,456 | 15.0 | 3,327 | 15.5 |
| Unknown | 3,358 | 14.6 | 3,814 | 17.7 |
| Total | 23,045 | 100.0 | 21,512 | 100.0 |
Table C15 Notes
Source: Correctional Service of Canada.
Religious identification is self-reported by offenders while they are incarcerated, and the categories are not comprehensive; therefore, the reader should interpret these data with caution.
Buddhist includes offenders who belong to the following group: Buddhist, Mahayana Buddhist, Theravadan Buddhist and Vajrayana Buddhist.
Christian includes offenders who belong to the following group: Amish, Anglican (Episcopal Church of England), Antiochian Orthodox, Apostolic Christian Church, Armenian Orthodox/Apostolic, Associated Gospel, Assyrian Chaldean Catholic, Baptist, Brethren In Christ, Bulgarian Orthodox, Canadian Reformed Church, Catholic- Greek, Catholic-Roman, Catholic-Ukranian, Catholic Non-Specific, Churches of Christ/Christian Churches, Charismatic, Christadelphian, Christian & Missionary Alliance, Christian Congregational, Christian Non Specific, Christian Or Plymouth Brethren, Christian Orthodox, Christian Reformed, Christian Reformed Church, Christian Science, Church of Christ Scientist, Church of God, Church of Jesus Christ of Latter-Day Saint, Community of Christ, Coptic Orthodox, Doukhobor, Dutch Reformed Church, Ethiopian Orthodox, Evangelical, Evangelical Free Church , Evangelical Missionary Church, Free Methodist, Free Reformed Church, Grace Communion International, Greek Orthodox, Hutterite, Iglesia Ni Cristo, Jehovah's Witnesses, Lutheran, Macedonian Orthodox, Maronite, Melkite, Mennonite, Messianic Jew, Methodist Christian, Metropolitan Community Church, Mission de l'Esprit Saint, Moravian, Mormon (Latter Day Saints), Nazarene Christian, Netherlands Reformed, New Apostolic, Pentecostal (4-Square), Pentecostal Assembly of God, Pentecôtiste, Philadelphia Church of God, Presbyterian, Protestant Non-Specific, Quaker (Society of Friends), Reformed Christian, Romanian Orthodox, Russian Orthodox, Salvation Army, Serbian Orthodox, Seventh Day Adventist, Shaker, Swedenborgian (New Church), Syrian/Syriac Orthodox, Ukrainian Catholic, Ukrainian Orthodox, United Church, United Reformed Church, Vineyard Christian Fellowship, Wesleyan Christian and Worldwide Church of God.
Hindu includes offenders who belong to the following group: Hindu and Siddha Yoga.
Jewish includes offenders who belong to the following group: Jewish Orthodox, Jewish Reformed and Judaism.
Muslim includes offenders who belong to the following group: Muslim and Sufism.
Rastafarian includes offenders who belong to the following group: Rastafarian.
Sikh includes offenders who belong to the following group: Sikh.
Traditional Indigenous Spirituality includes offenders who belong to the following group: Indigenous Spirituality Catholic, Traditional Indigenous Protestant, Native Spirituality, Catholic - Native Spirituality, Native Spirituality Protestant and Indigenous Spirituality.
Wiccan/Pagan includes offenders who belong to the following group: Asatru Paganism, Druidry Paganism, Pagan and Wicca.
Other Religion includes offenders who belong to the following group: Baha'i, Eckankar, Independent Spirituality, Jain, Krishna, New Age, New Thought-Unity-Religious Science, Other, Pantheist, Rosicrucian, Satanist, Scientology, Shintoïste, Spiritualist, Taoism, Transcendental Meditation, Unification Church, Unitarian, Visnabha and Zoroastrian.
No religion Affiliation includes offenders who belong to the following group: Agnostic, Atheist, Gnostic, Humanist and offenders who have no religion affiliation.
Unknown includes offenders who belong to the following group: Unknown, not stated as well as those offenders who have no religion specified.
The data reflect all active offenders, who are incarcerated in a CSC facility, offenders on temporary absence from a CSC facility, offenders who are temporarily detained, offenders who are actively supervised, and offenders who are unlawfully at large for less than 90 days.
The data reflect the number of offenders active at the end of each fiscal year. A fiscal year runs from April 1 to March 31 of the following year.
Due to rounding, percentages may not add to 100 percent.
Table C15 in the 2021 CCRSO corresponds to Table C10 in the 2020 CCRSO.
CSC offenders by Indigenous and non-Indigenous self-identification
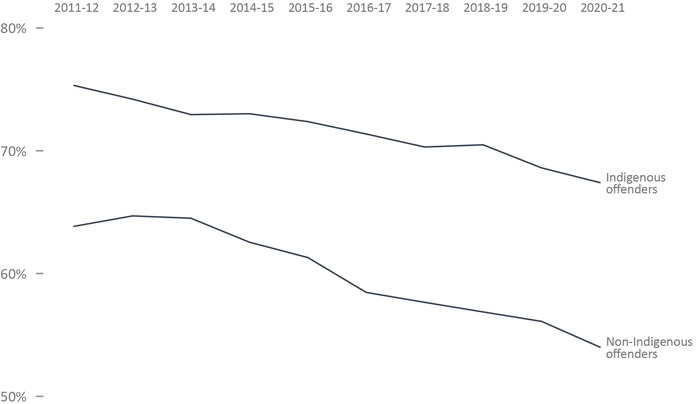
Image description
Line graph showing the proportion of self-identified Indigenous and self-identified non-Indigenous offenders in custody from fiscal year 2011 to 12 until fiscal year 2020 to 21. The percentage of self-identified non-Indigenous offenders rose slightly from fiscal year 2011 to 12 until fiscal year 2013 to 14, then dropped steadily to fiscal year 2020 to 21 at 54 percent. The percentage of self-identified Indigenous offenders decreased from fiscal year 2011 to 12, experiencing a slight rise in fiscal year 2018 to 19, then ending at its lowest point of 67.4 percent in fiscal year 2020 to 21. Full data are immediately below.
Figure C16 Notes
Source: Correctional Service of Canada.
- At the end of fiscal year 2020-21, 67.4% of all Indigenous offenders were in custody, relative to 54.0% of all non-Indigenous offenders. The remainder of both groups were under supervision in the community.
- Indigenous females in custody represent 43.2% of all in-custody females while Indigenous males who were in custody represented 31.0% of all males in custody.
- In 2020-21, Indigenous offenders represented 27.0% of the total offender population.
- Indigenous offenders accounted for 31.6% of the in-custody population and 20.8% of the community population in 2020-21.
In Custody includes all active offenders incarcerated in a CSC facility, offenders on temporary absence from a CSC facility, offenders who are temporarily detained in a CSC facility and offenders on remand in a CSC facility.
Total Offender Population includes all active offenders, who are incarcerated in a CSC facility, offenders on temporary absence from a CSC facility, offenders who are temporarily detained, offenders who are actively supervised, and offenders who are unlawfully at large for less than 90 days.
In Community Population includes all active offenders on day parole, full parole, statutory release, in the community supervised on a long term supervision order, offenders who are temporarily detained in a non-CSC facility, offenders who are unlawfully at large for less than 90 days, offenders on remand in a non-CSC facility, and offenders supervised and subject to an immigration hold by Canada Border Services Agency.
Indigenous identity is self-reported. Non-indigenous offenders includes offenders who do not identify as Indigenous . See Table C9 for the self-reported race of CSC’s offender population.
The data reflect the number of offenders active at the end of each fiscal year. A fiscal year runs from April 1 to March 31 of the following year.
Figure C16 in the 2021 CCRSO corresponds to Figure C11 in the 2020 CCRSO.
| In-Custody Population | In Community Under Supervision | Total | |||||
|---|---|---|---|---|---|---|---|
| # | % | # | % | ||||
| Males | 2016-17 | Indigenous | 3,545 | 72.2 | 1,362 | 27.8 | 4,907 |
| Non-Indigenous | 9,922 | 59.0 | 6,885 | 41.0 | 16,807 | ||
| Total | 13,467 | 62.0 | 8,247 | 38.0 | 21,714 | ||
| 2017-18 | Indigenous | 3,647 | 71.4 | 1,464 | 28.6 | 5,111 | |
| Non-Indigenous | 9,769 | 58.4 | 6,946 | 41.6 | 16,715 | ||
| Total | 13,416 | 61.5 | 8,410 | 38.5 | 21,826 | ||
| 2018-19 | Indigenous | 3,877 | 71.5 | 1,548 | 28.5 | 5,425 | |
| Non-Indigenous | 9,571 | 57.6 | 7,036 | 42.4 | 16,607 | ||
| Total | 13,448 | 61.0 | 8,584 | 39.0 | 22,032 | ||
| 2019-20 | Indigenous | 3,855 | 69.6 | 1,684 | 30.4 | 5,539 | |
| Non-Indigenous | 9,177 | 56.8 | 6,966 | 43.2 | 16,143 | ||
| Total | 13,032 | 60.1 | 8,650 | 39.9 | 21,682 | ||
| 2020-21 | Indigenous | 3,646 | 68.5 | 1,678 | 31.5 | 5,324 | |
| Non-Indigenous | 8,132 | 54.8 | 6,718 | 45.2 | 14,850 | ||
| Total | 11,778 | 58.4 | 8,396 | 41.6 | 20,174 | ||
| Females | 2016-17 | Indigenous | 253 | 61.0 | 162 | 39.0 | 415 |
| Non-Indigenous | 439 | 47.9 | 477 | 52.1 | 916 | ||
| Total | 692 | 52.0 | 639 | 48.0 | 1,331 | ||
| 2017-18 | Indigenous | 270 | 58.6 | 191 | 41.4 | 461 | |
| Non-Indigenous | 406 | 43.4 | 530 | 56.6 | 936 | ||
| Total | 676 | 48.4 | 721 | 51.6 | 1,397 | ||
| 2018-19 | Indigenous | 291 | 59.5 | 198 | 40.5 | 489 | |
| Non-Indigenous | 410 | 43.5 | 533 | 56.5 | 943 | ||
| Total | 701 | 49.0 | 731 | 51.0 | 1,432 | ||
| 2019-20 | Indigenous | 279 | 57.3 | 208 | 42.7 | 487 | |
| Non-Indigenous | 406 | 43.7 | 523 | 56.3 | 929 | ||
| Total | 685 | 48.4 | 731 | 51.6 | 1,416 | ||
| 2020-21 | Indigenous | 267 | 55.2 | 217 | 44.8 | 484 | |
| Non-Indigenous | 351 | 41.2 | 500 | 58.8 | 851 | ||
| Total | 618 | 46.3 | 717 | 53.7 | 1,335 | ||
| Another Sex | 2019-20 | Indigenous | 1 | 100.0 | 0 | 0.0 | 1 |
| Non-Indigenous | 2 | 66.7 | 1 | 33.3 | 3 | ||
| Total | 3 | 75.0 | 1 | 25.0 | 4 | ||
| 2020-21 | Indigenous | 1 | 100.0 | 0 | 0.0 | 1 | |
| Non-Indigenous | 2 | 100.0 | 0 | 0.0 | 2 | ||
| Total | 3 | 100.0 | 0 | 0.0 | 3 | ||
Table C16 Notes
Source: Correctional Service of Canada.
In Custody includes all active offenders incarcerated in a CSC facility, offenders on temporary absence from a CSC facility, offenders who are temporarily detained in a CSC facility and offenders on remand in a CSC facility.
In Community Population includes all active offenders on day parole, full parole, statutory release, in the community supervised on a long term supervision order, offenders who are temporarily detained in a non-CSC facility, offenders who are unlawfully at large for less than 90 days, offenders on remand in a non-CSC facility, and offenders supervised and subject to an immigration hold by Canada Border Services Agency.
Total Offender Population includes all active offenders, who are incarcerated in a CSC facility, offenders on temporary absence from a CSC facility, offenders who are temporarily detained, offenders who are actively supervised, and offenders who are unlawfully at large for less than 90 days.
The data reflect the number of offenders active at the end of each fiscal year. A fiscal year runs from April 1 to March 31 of the following year.
Table C16 in the 2021 CCRSO corresponds to Table C11 in the 2020 CCRSO.
Offenders in-custody at a CSC facility by security risk classification
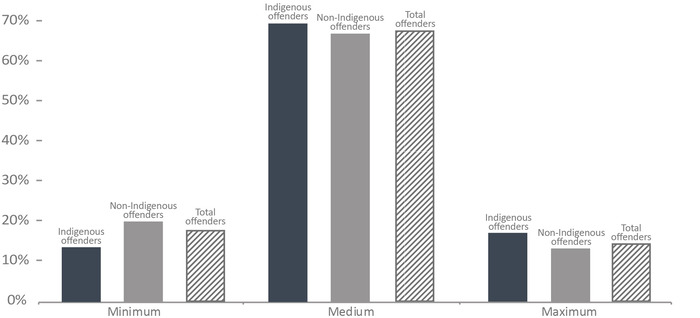
Image description
Bar graph comparing the percentage of in-custody offenders at a Correctional Service Canada facility by security risk classification and Indigenaity for fiscal year 2020 to 21. Minimum security facilities had fewer Indigenous offenders at 13.6 percent than non-Indigenous offenders at 20 percent. Medium security facilities had the most offenders in both identity categories. Medium security facilities had a larger proportion of Indigenous offenders at 69.2 percent, than non-Indigenous offenders at 66.7 percent. Finally maximum security facilities also had more Indigenous offenders at 17.2 percent than non-Indigenous offenders at 13.3 percent. Full data are available immediately below.
Figure C17 Notes
Source: Correctional Service of Canada.
- Approximately two-thirds (67.5%) of offenders were classified as medium security risk. Indigenous offenders were more likely to be classified to a medium or maximum security risk compared to non-Indigenous.
- Compared to non-Indigenous offenders, a lower percentage of Indigenous offenders were classified as minimum security risk (13.6% vs. 20.0%) and a higher percentage were classified as medium (69.2% vs. 66.7%) and maximum (17.2% vs. 13.3%) security risk.
The data represent the offender security level decision as of end of fiscal year 2020-2021.
The Not yet determined category includes offenders who have not yet been classified.
In Custody includes all active offenders incarcerated in a CSC facility, offenders on temporary absence from a CSC facility, offenders who are temporarily detained in a CSC facility and offenders on remand in a CSC facility.
Figure C17 in the 2021 CCRSO corresponds to Figure C12 in the 2020 CCRSO.
| Security Risk Level | Indigenous | Non-Indigenous | Total | |||
|---|---|---|---|---|---|---|
| # | % | # | % | # | % | |
| Minimum | 501 | 13.6 | 1,536 | 20.0 | 2,037 | 17.9 |
| Medium | 2,550 | 69.2 | 5,127 | 66.7 | 7,677 | 67.5 |
| Maximum | 633 | 17.2 | 1,025 | 13.3 | 1,658 | 14.6 |
| Total | 3,684 | 100.0 | 7,688 | 100.0 | 11,372 | 100.0 |
| Not Yet Determined | 230 | 100.0 | 797 | 100.0 | 1,027 | 100.0 |
| Total | 3,914 | 8,485 | 12,399 | |||
Table C17 Notes
Source: Correctional Service of Canada.
In Custody includes all active offenders incarcerated in a CSC facility, offenders on temporary absence from a CSC facility, offenders who are temporarily detained in a CSC facility and offenders on remand in a CSC facility.
The data represent the offender security level decision as of end of fiscal year 2020-2021.
The Not yet determined category includes offenders who have not yet been classified.
Table C17 in the 2021 CCRSO corresponds to Figure C12 in the 2020 CCRSO.
Admissions to federal jurisdiction with a life and/or indeterminate sentenceFootnote *: 10-year trend
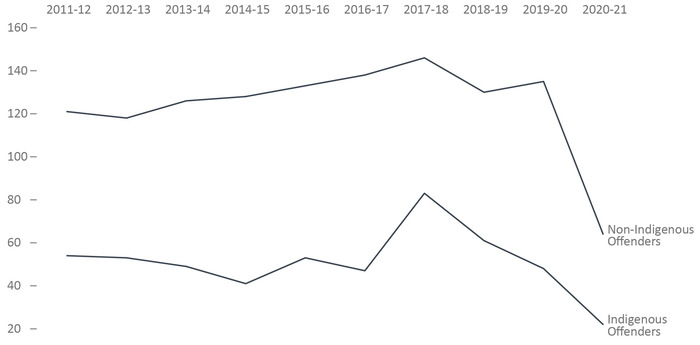
Image description
Line graph showing the number of warrant of committal admissions to federal jurisdiction with life and or indeterminate sentences from fiscal year 2011 to 12 until fiscal year 2020 to 21. Indigenous offenders had 54 admissions in fiscal year 2011 to 12, dropping to 41 in fiscal year 2014 to 15, rising to 53 in fiscal year 2015 to 16, before dropping briefly to 47 in fiscal year 2016 to 17. The numbers then rose to its peak of 83 in fiscal year 2017 to 18, before dropping again gradually until 22 in fiscal year 2020 to 21. Non-Indigenous offenders had 121 admissions in fiscal year 2011 to 12, dropping briefly in fiscal year 2012 to 13 to 118, prior to rising to its peak of 146 in fiscal year 2017 to 18, before dropping again to its lowest point of 64 in fiscal year 2020 to 21. Full data are available immediately below.
Figure C18 Notes
Source: Correctional Service of Canada.
- From 2011-12 to 2020-21, there was a decrease of 50.9% in the number of warrant of committal admissions to CSC facilities with a life and/or indeterminate sentenceFootnote * from 175 to 86. Much of this decrease occurred between 2019-20 and 2020-21.
- At the end of fiscal year 2020-21, there were a total of 3,561 offenders in custody with a life and/or indeterminate sentence.Footnote * Of these, 3,432 (96.4%) were male, 126 (3.5%) were female and 3 (0.1%) were offenders who identified as another sex; 985 (27.7%) were Indigenous and 2,576 (72.3%) were non-Indigenous.
- At the end of fiscal year 2020-21, 26.8% of the total population was serving a life and/or indeterminate sentence.Footnote * Of these offenders, 61.9% were in custody and 38.1% were in the community under supervision.
A warrant of committal is a new admission to federal jurisdiction from the courts.
These numbers refer to the total number of admissions to a federal institution or Healing Lodge during each fiscal year and may be greater than the actual number of offenders admitted, since an individual offender may be admitted more than once in a given year.
There is a lag in the data entry of admissions into CSC’s Offender Management System. The admission figures for the most recent year are under-reported by 200-400 admissions at the time of year end data extraction. More accurate figures will be available in the next year’s publication. Please use caution when including the most recent year in any trend analysis.
Total Offender Population includes all active offenders, who are incarcerated in a CSC facility, offenders on temporary absence from a CSC facility, offenders who are temporarily detained, offenders who are actively supervised, and offenders who are unlawfully at large for less than 90 days.
This table combines offenders serving life sentences and offenders serving indeterminate sentences.
In Custody includes all active offenders incarcerated in a CSC facility, offenders on temporary absence from a CSC facility, offenders who are temporarily detained in a CSC facility and offenders on remand in a CSC facility.
In Community Under Supervision includes all active offenders on day parole, full parole, statutory release, in the community supervised on a long-term supervision order, offenders who are temporarily detained in a non-CSC facility, offenders who are unlawfully at large for less than 90 days, offenders on remand in a non-CSC facility, and offenders supervised and subject to an immigration hold by Canada Border Services Agency.
Figure C18 in the 2021 CCRSO corresponds to Figure C13 in the 2020 CCRSO.
| Year | Indigenous Offenders | Non-Indigenous Offenders | Total | ||||||
|---|---|---|---|---|---|---|---|---|---|
| Females | Males | Total | Females | Males | Total | Females | Males | Total | |
| 2011-12 | 6 | 48 | 54 | 11 | 110 | 121 | 17 | 158 | 175 |
| 2012-13 | 6 | 47 | 53 | 2 | 116 | 118 | 8 | 163 | 171 |
| 2013-14 | 7 | 42 | 49 | 7 | 119 | 126 | 14 | 161 | 175 |
| 2014-15 | 1 | 40 | 41 | 8 | 120 | 128 | 9 | 160 | 169 |
| 2015-16 | 5 | 48 | 53 | 6 | 127 | 133 | 11 | 175 | 186 |
| 2016-17 | 2 | 45 | 47 | 11 | 127 | 138 | 13 | 172 | 185 |
| 2017-18 | 6 | 77 | 83 | 12 | 134 | 146 | 18 | 211 | 229 |
| 2018-19 | 6 | 55 | 61 | 4 | 126 | 130 | 10 | 181 | 191 |
| 2019-20 | 1 | 47 | 48 | 8 | 127 | 135 | 9 | 174 | 183 |
| 2020-21 | 1 | 21 | 22 | 1 | 63 | 64 | 2 | 84 | 86 |
Table C18 Notes
Source: Correctional Service of Canada.
A warrant of committal is a new admission to federal jurisdiction from the courts.
These numbers refer to the total number of admissions to a federal institution or Healing Lodge during each fiscal year and may be greater than the actual number of offenders admitted, since an individual offender may be admitted more than once in a given year.
There is a lag in the data entry of admissions into CSC’s Offender Management System. The admission figures for the most recent year are under-reported by 200-400 admissions at the time of year end data extraction. More accurate figures will be available in the next year’s publication. Please use caution when including the most recent year in any trend analysis.
Total Offender Population includes all active offenders, who are incarcerated in a CSC facility, offenders on temporary absence from a CSC facility, offenders who are temporarily detained, offenders who are actively supervised, and offenders who are unlawfully at large for less than 90 days.
This table combines offenders serving life sentences and offenders serving indeterminate sentences.
In Custody includes all active offenders incarcerated in a CSC facility, offenders on temporary absence from a CSC facility, offenders who are temporarily detained in a CSC facility and offenders on remand in a CSC facility.
In Community Under Supervision includes all active offenders on day parole, full parole, statutory release, in the community supervised on a long-term supervision order, offenders who are temporarily detained in a non-CSC facility, offenders who are unlawfully at large for less than 90 days, offenders on remand in a non-CSC facility, and offenders supervised and subject to an immigration hold by Canada Border Services Agency.
Table C18 in the 2021 CCRSO corresponds to Table C13 in the 2020 CCRSO.
Proportion of offenders with life and/or indeterminate sentences

Image description
Bar illustration of the proportion of offenders with life or indeterminate sentences in fiscal year 2020 to 21. Of sentences imposed for the total offender population in fiscal year 2020 to 21, offenders with life or indeterminate sentences accounted for 26.8 percent of the sentences that were imposed. This includes 23.6 percent that were life sentences, 3.1 percent that were indeterminate sentences, and 0.1 percent that were both life and indeterminate sentences. While, on the other hand, determinate sentences reflect 73.2 percent of sentences that are imposed. Full data are available below.
Figure C19 Notes
Source: Correctional Service of Canada.
- At the end of fiscal year 2020-21, there were 5,755 offenders serving a life sentence and/or an indeterminate sentence.Footnote * This represents 26.8% of the total offender population. The majority (61.9%) of these offenders were in custody. Of the 2,194 offenders who were in the community under supervision, the majority (79.5%) were serving a life sentence for 2nd Degree Murder.
- There were 21 offenders who were serving both a life sentence and an indeterminate sentence.Footnote *
- There were 666 offenders who were serving an indeterminate sentenceFootnote * as a result of a special designation. The remaining 5,068 offenders did not receive a special designation, but were serving a life sentence.
- 92.5% of the 655 Dangerous Offenders with indeterminate sentencesFootnote * were in custody and 7.5% were in the community under supervision.
- In contrast, 50.0% of the 10 Dangerous Sexual Offenders were in custody and the offender with an Habitual Offender designation was in the community under supervision (in this table there is one offender with an Habitual Offender designation included in the Designation and Life grouping, this offender was in the community under supervision as well) .
Total Offender Population includes all active offenders, who are incarcerated in a CSC facility, offenders on temporary absence from a CSC facility, offenders who are temporarily detained, offenders who are actively supervised, and offenders who are unlawfully at large for less than 90 days.
In Custody includes all active offenders incarcerated in a CSC facility, offenders on temporary absence from a CSC facility, offenders who are temporarily detained in a CSC facility and offenders on remand in a CSC facility.
In Community Under Supervision includes all active offenders on day parole, full parole, statutory release, in the community supervised on a long-term supervision order, offenders who are temporarily detained in a non-CSC facility, offenders who are unlawfully at large for less than 90 days, offenders on remand in a non-CSC facility, and offenders supervised and subject to an immigration hold by Canada Border Services Agency.
Figure C19 in the 2021 CCRSO corresponds to Figure C14 in the 2020 CCRSO.
| Total Offender Population | In Custody in a CSC Facility | In Community Under Supervision | ||||
|---|---|---|---|---|---|---|
| # | % | Incarcerated | Day Parole | Full Parole | Other | |
| Offenders with a life sentence for: | ||||||
1st Degree Murder |
1,285 | 6.0 | 982 | 76 | 227 | 0 |
2nd Degree Murder |
3,592 | 16.7 | 1,847 | 263 | 1,482 | 0 |
Other Offences |
191 | 0.9 | 103 | 14 | 74 | 0 |
| Total | 5,068 | 23.6 | 2,932 | 353 | 1,783 | 0 |
| Offenders with indeterminate sentencesFootnote * resulting from the special designation of: | ||||||
Dangerous Offender |
655 | 3.0 | 606 | 24 | 25 | 0 |
Dangerous Sexual Offender |
10 | 0.0 | 5 | 1 | 4 | 0 |
Habitual Offender |
1 | 0.0 | 0 | 0 | 1 | 0 |
| Total | 666 | 3.1 | 611 | 25 | 30 | 0 |
| Offenders serving an indeterminate sentenceFootnote * (due to a special designation) and a life sentence (due to an offence) | 21 | 0.1 | 18 | 1 | 2 | 0 |
| Total offenders with life and/or indeterminate sentenceFootnote * | 5,755 | 26.8 | 3,561 | 379 | 1,815 | 0 |
| Offenders Serving Determinate sentences | 15,757 | 73.2 | 8,838 | 1,027 | 2,688 | 3,204 |
| Total | 21,512 | 100.0 | 12,399 | 1,406 | 4,503 | 3,204 |
Table C19 Notes
Source: Correctional Service of Canada.
Total Offender Population includes all active offenders, who are incarcerated in a CSC facility, offenders on temporary absence from a CSC facility, offenders who are temporarily detained, offenders who are actively supervised, and offenders who are unlawfully at large for less than 90 days.
In Custody includes all active offenders incarcerated in a CSC facility, offenders on temporary absence from a CSC facility, offenders who are temporarily detained in a CSC facility and offenders on remand in a CSC facility.
In Community Under Supervision includes all active offenders on day parole, full parole, statutory release, in the community supervised on a long-term supervision order, offenders who are temporarily detained in a non-CSC facility, offenders who are unlawfully at large for less than 90 days, offenders on remand in a non-CSC facility, and offenders supervised and subject to an immigration hold by Canada Border Services Agency.
Table C19 in the 2021 CCRSO corresponds to Table C14 in the 2020 CCRSO.
Percentage of total offender population serving a sentence for a violent offence
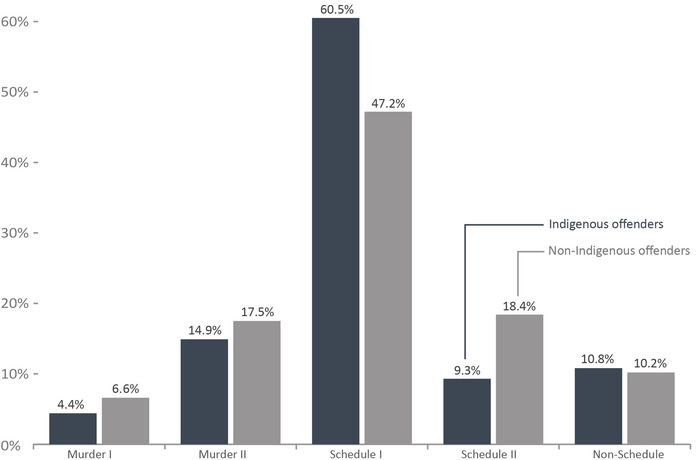
Image description
Bar graph showing the percentage of the total offender population serving a sentence for a violent offence, for Indigenous and non-Indigenous identities, in fiscal year 2020 to 21. For Murder I sentences, Indigenous offenders accounted for 4.4 percent of the total offender population and non-Indigenous offenders accounted for 6.6 percent. For Murder II sentences, Indigenous offenders accounted for 14.9 percent of the total offender population and non-Indigenous offenders accounted for 17.5 percent. Of Schedule I sentences, Indigenous offenders accounted for 60.5 percent of the total offender population, and non-Indigenous offenders accounted for 47.2 percent. Of Schedule II sentences, Indigenous offenders accounted for 9.3 percent of the total offender population and non-Indigenous offenders accounted for 18.4 percent. Of Non-Schedule sentences, Indigenous offenders accounted for 10.8 percent of the total offender population and non-Indigenous offenders accounted for 10.2 percent. Full data are available below.
Figure C20 Notes
Source: Correctional Service of Canada.
- At the end of fiscal year 2020-21, Indigenous offenders were more likely to be serving a sentence for a violent offence (79.9% for Indigenous versus 71.4% for non-Indigenous).
- 67.8% of Indigenous female offenders were serving a sentence for a violent offence compared to 46.8% of non-Indigenous female offenders.
- Of those offenders serving a sentence for Murder, 4.9% were female and 22.8% were Indigenous.
- A greater proportion of Indigenous offenders than non-Indigenous offenders were serving a sentence for a Schedule IFootnote * offence (60.5% versus 47.2%, respectively).
- 9.3% of Indigenous offenders were serving a sentence for a Schedule IIFootnote ** offence compared to 18.4% of non-Indigenous offenders.
- 30.1% of females were serving a sentence for a Schedule IIFootnote ** offence compared to 15.0% for males.
In cases where the offender is serving a sentence for more than one offence, the data reflect the most serious offence.
Total Offender Population includes all active offenders, who are incarcerated in a CSC facility, offenders on temporary absence from a CSC facility, offenders who are temporarily detained, offenders who are actively supervised, and offenders who are unlawfully at large for less than 90 days.
Violent offences include first degree murder, second degree murder, and Schedule I offences.
Figure C20 in the 2021 CCRSO corresponds to Figure C15 in the 2020 CCRSO.
| Offence Category | Indigenous | Non-Indigenous | Total | |||||||||
|---|---|---|---|---|---|---|---|---|---|---|---|---|
| Female | Male | Another Sex | Total | Female | Male | Another Sex | Total | Female | Male | Another Sex | Total | |
| Murder I | 12 | 246 | 0 | 258 | 45 | 999 | 0 | 1,044 | 57 | 1,245 | 0 | 1,302 |
| % | 2.5 | 4.6 | 0.0 | 4.4 | 5.3 | 6.7 | 0.0 | 6.6 | 4.3 | 6.2 | 0.0 | 6.1 |
| Murder II | 67 | 798 | 1 | 866 | 118 | 2,632 | 2 | 2,752 | 185 | 3,430 | 3 | 3,618 |
| % | 13.8 | 15.0 | 100.0 | 14.9 | 13.9 | 17.7 | 100.0 | 17.5 | 13.9 | 17.0 | 100.0 | 16.8 |
| Schedule IFootnote * | 249 | 3,267 | 0 | 3516 | 235 | 7,183 | 0 | 7,418 | 484 | 10,450 | 0 | 10,934 |
| % | 51.4 | 61.4 | 0.0 | 60.5 | 27.6 | 48.4 | 0.0 | 47.2 | 36.3 | 51.8 | 0.0 | 50.8 |
| Schedule IIFootnote ** | 97 | 445 | 0 | 542 | 305 | 2,579 | 0 | 2,884 | 402 | 3,024 | 0 | 3,426 |
| % | 20.0 | 8.4 | 0.0 | 9.3 | 35.8 | 17.4 | 0.0 | 18.4 | 30.1 | 15.0 | 0.0 | 15.9 |
| Non-Schedule | 59 | 568 | 0 | 627 | 148 | 1,457 | 0 | 1,605 | 207 | 2,025 | 0 | 2,232 |
| % | 12.2 | 10.7 | 0.0 | 10.8 | 17.4 | 9.8 | 0.0 | 10.2 | 15.5 | 10.0 | 0.0 | 10.4 |
| Total | 484 | 5,324 | 1 | 5,809 | 851 | 14,850 | 2 | 15,703 | 1,335 | 20,174 | 3 | 21,512 |
Table C20 Notes
Source: Correctional Service of Canada.
In cases where the offender is serving a sentence for more than one offence, the data reflect the most serious offence.
Total Offender Population includes all active offenders, who are incarcerated in a CSC facility, offenders on temporary absence from a CSC facility, offenders who are temporarily detained, offenders who are actively supervised, and offenders who are unlawfully at large for less than 90 days.
Table C20 in the 2021 CCRSO corresponds to Figure C15 in the 2020 CCRSO.
Indigenous offenders under the responsibility of CSC
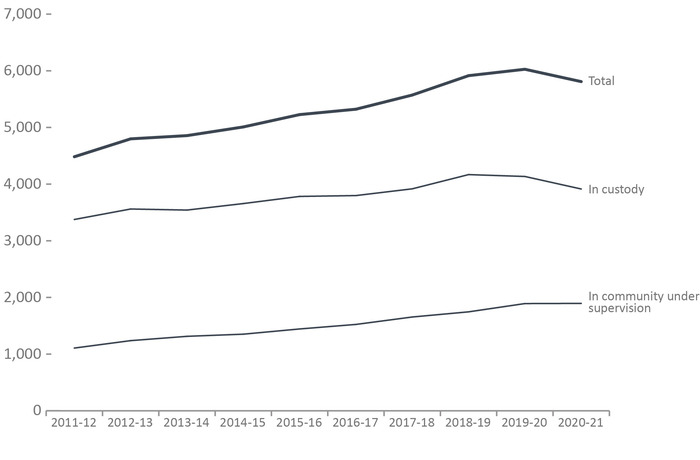
Image description
Line graph showing the Indigenous offender population under the responsibility of Correctional Service Canada. In community under supervision were 1,524 Indigenous offenders in fiscal year 2016 to 17, rising steadily until reaching 1,895 in fiscal year 2020 to 21. Indigenous in-custody offenders started at 3,798 in fiscal year 2016 to 17, rising until its peak of 4,168 in fiscal year 2018 to 19, prior to dropping to 3,914 in fiscal year 2020 to 21. Full data are available below.
Figure C21 Notes
Source: Correctional Service of Canada.
- From 2011-2012 to 2020-21, the in-custody Indigenous offender population increased by 15.9%, while the total Indigenous offender population increased 29.6% over the same period of time.
- The number of in-custody Indigenous female offenders increased steadily from 217 in 2011-12 to 267 in 2020-21, an increase of 23.0%. The increase for in-custody Indigenous male offenders was 15.4% for the same period, increasing from 3,159 to 3,646.
- From 2011-12 to 2020-21 the number of Indigenous offenders on community supervision increased 71.2%, from 1,107 to 1,895. The Indigenous community population accounted for 20.8% of the total community population in 2020-21.
Total includes all active offenders, who are incarcerated in a CSC facility, offenders on temporary absence from a CSC facility, offenders who are temporarily detained, offenders who are actively supervised, and offenders who are unlawfully at large for less than 90 days.
In Custody includes all active offenders incarcerated in a CSC facility, offenders on temporary absence from a CSC facility, offenders who are temporarily detained in a CSC facility and offenders on remand in a CSC facility.
In Community Under Supervision includes all active offenders on day parole, full parole, statutory release, or in the community supervised on a long term supervision order, offenders who are temporarily detained in a non-CSC facility, offenders who are unlawfully at large for less than 90 days, offenders on remand in a non-CSC facility, and offenders supervised and subject to an immigration hold by Canada Border Services Agency.
Regional statistics for the Correctional Service of Canada account for data relating to the northern territories in the following manner: data for Nunavut are reported in the Ontario Region, data for the Northwest Territories are reported in the Prairies Region, and data for the Yukon Territories are reported in the Pacific Region.
Figure C21 in the 2021 CCRSO corresponds to Figure C16 in the 2020 CCRSO.
| Indigenous Offenders | Fiscal Year | |||||
|---|---|---|---|---|---|---|
| 2016-17 | 2017-18 | 2018-19 | 2019-20 | 2020-21 | ||
| In Custody | ||||||
| Atlantic Region | Male | 175 | 184 | 224 | 234 | 211 |
| Female | 8 | 14 | 19 | 18 | 25 | |
| Another Sex | NR | NR | NR | 0 | 0 | |
| Quebec Region | Male | 384 | 392 | 449 | 370 | 352 |
| Female | 14 | 11 | 16 | 13 | 14 | |
| Another Sex | NR | NR | NR | 0 | 0 | |
| Ontario Region | Male | 487 | 534 | 558 | 612 | 528 |
| Female | 37 | 43 | 50 | 49 | 53 | |
| Another Sex | NR | NR | NR | 0 | 0 | |
| Prairie Region | Male | 1,861 | 1,879 | 1,955 | 1,968 | 1,925 |
| Female | 155 | 163 | 158 | 152 | 127 | |
| Another Sex | NR | NR | NR | 0 | 0 | |
| Pacific Region | Male | 638 | 658 | 691 | 671 | 630 |
| Female | 39 | 39 | 48 | 47 | 48 | |
| Another Sex | NR | NR | NR | 1 | 1 | |
| National Total | Male | 3,545 | 3,647 | 3,877 | 3,855 | 3,646 |
| Female | 253 | 270 | 291 | 279 | 267 | |
| Another Sex | NR | NR | NR | 1 | 1 | |
| Total | 3,798 | 3,917 | 4,168 | 4,135 | 3,914 | |
| In Community Under Supervision | ||||||
| Atlantic Region | Male | 71 | 88 | 83 | 106 | 97 |
| Female | 11 | 9 | 10 | 13 | 13 | |
| Another Sex | NR | NR | NR | 0 | 0 | |
| Quebec Region | Male | 185 | 181 | 162 | 182 | 182 |
| Female | 10 | 6 | 9 | 8 | 9 | |
| Another Sex | NR | NR | NR | 0 | 0 | |
| Ontario Region | Male | 201 | 231 | 239 | 277 | 291 |
| Female | 31 | 29 | 31 | 28 | 34 | |
| Another Sex | NR | NR | NR | 0 | 0 | |
| Prairie Region | Male | 604 | 645 | 720 | 750 | 756 |
| Female | 78 | 111 | 113 | 119 | 123 | |
| Another Sex | NR | NR | NR | 0 | 0 | |
| Pacific Region | Male | 301 | 319 | 344 | 369 | 352 |
| Female | 32 | 36 | 35 | 40 | 38 | |
| Another Sex | NR | NR | NR | 0 | 0 | |
| National Total | Male | 1,362 | 1,464 | 1,548 | 1,684 | 1,678 |
| Female | 162 | 191 | 198 | 208 | 217 | |
| Another Sex | NR | NR | NR | 0 | 0 | |
| Total | 1,524 | 1,655 | 1,746 | 1,892 | 1,895 | |
| Total Offender Population | 5,322 | 5,572 | 5,914 | 6,027 | 5,809 | |
Table C21 Notes
Source: Correctional Service of Canada.
In Custody includes all active offenders incarcerated in a CSC facility, offenders on temporary absence from a CSC facility, offenders who are temporarily detained in a CSC facility and offenders on remand in a CSC facility.
In Community Under Supervision includes all active offenders on day parole, full parole, statutory release, or in the community supervised on a long term supervision order, offenders who are temporarily detained in a non-CSC facility, offenders who are unlawfully at large for less than 90 days, offenders on remand in a non-CSC facility, and offenders supervised and subject to an immigration hold by Canada Border Services Agency.
Total Offender Population includes all active offenders, who are incarcerated in a CSC facility, offenders on temporary absence from a CSC facility, offenders who are temporarily detained, offenders who are actively supervised, and offenders who are unlawfully at large for less than 90 days.
Regional statistics for the Correctional Service of Canada account for data relating to the northern territories in the following manner: data for Nunavut are reported in the Ontario Region, data for the Northwest Territories are reported in the Prairies Region, and data for the Yukon Territories are reported in the Pacific Region.
Table C21 in the 2021 CCRSO corresponds to Table C16 in the 2020 CCRSO.
Admissions to administrative segregation in a federal institution: 5-year trend
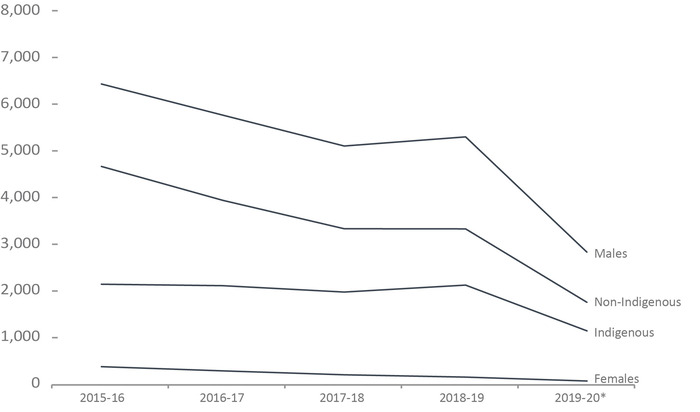
Image description
Line graph showing the number of admissions to administrative segregation in a federal institution from fiscal year 2015 to 16 until fiscal year 2019 to 29, by sex and by Indigenaity. Females represented the lowest admissions at 377 in fiscal year 2015 to 16, decreasing until 73 in fiscal year 2019 to 20. Males accounted for 6,411 admissions in fiscal year 2015 to 16, decreasing until 5,089 in fiscal year 2017 to 18, rising briefly in fiscal year 2018 to 19 to 5,282 admissions to administrative segregations, prior to dropping to its lowest point in fiscal year 2019 to 20 at 2,822. Those identifying as Indigenous had 2,137 admissions in fiscal year 2015 to 16, decreasing to 1,972 in fiscal year 2017 to 18, rising briefly to 2,120 in fiscal year 2018 to 19, then reaching its lowest point at 1,143 in fiscal year 2019 to 20. Non-Indigenous offenders had 4,651 admissions to administrative segregation in fiscal year 2015 to 16, decreasing until 1,752 in fiscal year 2019 to 20. Full data are available below.
Figure C22 Notes
Source: Correctional Service of Canada.
- Between April 1, 2019 and November 30, 2019Footnote *, there were 2,895 admissions to administrative segregation. Of the total admissions to administrative segregation, 2,822 were males and 73 were females. Indigenous offenders accounted for 39.5% of admissions to administrative segregation.
Administrative segregation is the separation, when specific legal requirements are met, of an inmate from the general population, other than pursuant to a disciplinary decision. As per subsection 33(3) of the Corrections and Conditional Release Act:
31(3) The institutional head may order that an inmate be confined in administrative segregation if the institutional head is satisfied that there is no reasonable alternative to administrative segregation and he or she believes on reasonable grounds that:
(a) the inmate has acted, has attempted to act or intends to act in a manner that jeopardizes the security of the penitentiary or the safety of any person and allowing the inmate to associate with other inmates would jeopardize the security of the penitentiary or the safety of any person;
(b) allowing the inmate to associate with other inmates would interfere with an investigation that could lead to a criminal charge or a charge under subsection 41(2) of a serious disciplinary offence; or
(c) allowing the inmate to associate with other inmates would jeopardize the inmate’s safety.
Offenders segregated under paragraph (f), subsection 44(1) of the Corrections and Conditional Release Act (Disciplinary Segregation) are not included.
These reports count admissions, not offenders. Offenders admitted multiple times to segregation are counted once for each admission.
Figure C22 in the 2021 CCRSO corresponds to Figure C17 in the 2020 CCRSO.
| Year and Type of Administrative SegregationFootnote * | By Sex | By Indigenous Identity | |||||
|---|---|---|---|---|---|---|---|
| Females | Males | Another Sex | Total | Indigenous | Non-Indigenous | Total | |
| 2015-16 | |||||||
CCRA 31(3-A) |
342 | 4,200 | 0 | 4,542 | 1,378 | 3,164 | 4,542 |
CCRA 31(3-B) |
2 | 235 | 0 | 237 | 94 | 143 | 237 |
CCRA 31(3-C) |
33 | 1,976 | 0 | 2,009 | 665 | 1,344 | 2,009 |
Total |
377 | 6,411 | 0 | 6,788 | 2,137 | 4,651 | 6,788 |
| 2016-17 | |||||||
CCRA 31(3-A) |
271 | 3,825 | 0 | 4,096 | 1,381 | 2,715 | 4,096 |
CCRA 31(3-B) |
3 | 273 | 0 | 276 | 75 | 201 | 276 |
CCRA 31(3-C) |
16 | 1,648 | 1 | 1,665 | 652 | 1,013 | 1,665 |
Total |
290 | 5,746 | 1 | 6,037 | 2,108 | 3,929 | 6,037 |
| 2017-18 | |||||||
CCRA 31(3-A) |
183 | 3,162 | 0 | 3,345 | 1,195 | 2,150 | 3,345 |
CCRA 31(3-B) |
10 | 229 | 0 | 239 | 79 | 160 | 239 |
CCRA 31(3-C) |
12 | 1,698 | 0 | 1,710 | 698 | 1,012 | 1,710 |
Total |
205 | 5,089 | 0 | 5,294 | 1,972 | 3,322 | 5,294 |
| 2018-19 | |||||||
CCRA 31(3-A) |
134 | 3,010 | 0 | 3,144 | 1,175 | 1,969 | 3,144 |
CCRA 31(3-B) |
5 | 161 | 0 | 166 | 52 | 114 | 166 |
CCRA 31(3-C) |
18 | 2,111 | 0 | 2,129 | 893 | 1,236 | 2,129 |
Total |
157 | 5,282 | 0 | 5,439 | 2,120 | 3,319 | 5,439 |
| 2019-20Footnote * | |||||||
CCRA 31(3-A) |
57 | 1,599 | 0 | 1,656 | 661 | 995 | 1,656 |
CCRA 31(3-B) |
5 | 60 | 0 | 65 | 25 | 40 | 65 |
CCRA 31(3-C) |
11 | 1,163 | 0 | 1,174 | 457 | 717 | 1,174 |
Total |
73 | 2,822 | 0 | 2,895 | 1,143 | 1,752 | 2,895 |
Table C22 Notes
Source: Correctional Service of Canada.
Administrative segregation is the separation, when specific legal requirements are met, of an inmate from the general population, other than pursuant to a disciplinary decision. As per subsection 33(3) of the Corrections and Conditional Release Act:
31(3) The institutional head may order that an inmate be confined in administrative segregation if the institutional head is satisfied that there is no reasonable alternative to administrative segregation and he or she believes on reasonable grounds that:
(a) the inmate has acted, has attempted to act or intends to act in a manner that jeopardizes the security of the penitentiary or the safety of any person and allowing the inmate to associate with other inmates would jeopardize the security of the penitentiary or the safety of any person;
(b) allowing the inmate to associate with other inmates would interfere with an investigation that could lead to a criminal charge or a charge under subsection 41(2) of a serious disciplinary offence; or
(c) allowing the inmate to associate with other inmates would jeopardize the inmate’s safety.
Offenders segregated under paragraph (f), subsection 44(1) of the Corrections and Conditional Release Act (Disciplinary Segregation) are not included.
These reports count admissions, not offenders. Offenders admitted multiple times to segregation are counted once for each admission.
Table C22 in the 2021 CCRSO corresponds to Table C17 in the 2020 CCRSO.
72% of placements in administrative segregation in a CSC facility were for less than 30 days
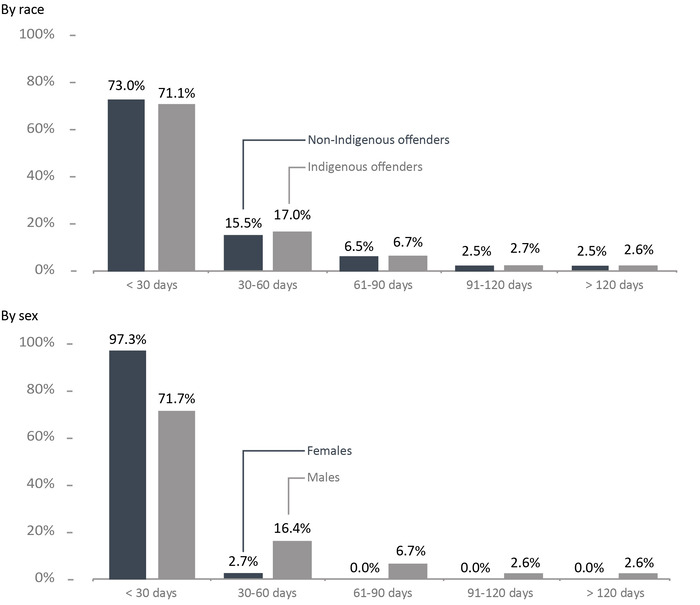
Image description
Two bar graphs showing the percentage of federal offenders admitted to administrative segregation first by race and then by sex for the fiscal year 2019 to 20. 73.0 percent of non-Indigenous offenders and 71.1 percent of Indigenous offenders were in placements of administrative segregation for less than 30 days; 15.5 percent of non-Indigenous offenders and 17.0 percent of Indigenous offenders were in placements of 30 to 60 days; 6.5 percent of non-Indigenous offenders and 6.7 percent of Indigenous offenders were in placements of 61 to 90 days; 2.5 percent of non-Indigenous offenders and 2.7 percent of Indigenous offenders were in placements of 91 to 120 days; and 2.5 percent of non-Indigenous offenders and 2.6 percent of Indigenous offenders were in placements of more than 120 days.
97.3 percent of females and 71.7 percent of males were in placements of administrative segregation for less than 30 days; 2.7 percent of females and 16.4 percent of males were in placements of 30 to 60 days; 0.0 percent of females and 6.7 percent of males were in placements of 61 to 90 days; 0.0 percent of females and 2.6 percent of males were in placements of 91 to 120 days; and 0.0 percent of females and 2.6 percent of males were in placements of more than 120 days. Full data are available below.
Figure C23 Notes
Source: Correctional Service of Canada.
- Between April 1, 2019 and November 30, 2019, there were 3,216 administrative segregation periods that ended in federal institutions. Most (72.2%) placements in administrative segregation ended in less than 30 days, and 16.1% lasted between 30 and 60 days. 2.5% of placements in administrative segregation ended after more than 120 days.
- 97.3% of placements of females in administrative segregation ended in less than 30 days.
- The number of admissions to administrative segregation that resulted in placements lasting more than 120 days in administrative segregation was 2.6% for Indigenous and 2.5% for non-Indigenous offenders.
Administrative segregation is the separation, when specific legal requirements are met, of an inmate from the general population, other than pursuant to a disciplinary decision. As per subsection 33(3) of the Corrections and Conditional Release Act:
31(3) The institutional head may order that an inmate be confined in administrative segregation if the institutional head is satisfied that there is no reasonable alternative to administrative segregation and he or she believes on reasonable grounds that:
(a) the inmate has acted, has attempted to act or intends to act in a manner that jeopardizes the security of the penitentiary or the safety of any person and allowing the inmate to associate with other inmates would jeopardize the security of the penitentiary or the safety of any person;
(b) allowing the inmate to associate with other inmates would interfere with an investigation that could lead to a criminal charge or a charge under subsection 41(2) of a serious disciplinary offence; or
(c) allowing the inmate to associate with other inmates would jeopardize the inmate’s safety.
Offenders segregated under paragraph (f), subsection 44(1) of the Corrections and Conditional Release Act (Disciplinary Segregation) are not included.
These reports count admissions, not offenders. Offenders admitted multiple times to segregation are counted once for each admission.
Figure C23 in the 2021 CCRSO corresponds to Figure C18 in the 2020 CCRSO.
| Length of Stay in Administrative SegregationFootnote * | By Sex | By Indigenous identity | Total | |||||||
|---|---|---|---|---|---|---|---|---|---|---|
| Females | Males | Indigenous | Non-Indigenous | |||||||
| 2019-20 | # | % | # | % | # | % | # | % | # | % |
< 30 days |
71 | 97.3 | 2,252 | 71.7 | 909 | 71.1 | 1,414 | 73.0 | 2,323 | 72.2 |
30-60 days |
2 | 2.7 | 515 | 16.4 | 217 | 17.0 | 300 | 15.5 | 517 | 16.1 |
61-90 days |
0 | 0.0 | 212 | 6.7 | 86 | 6.7 | 126 | 6.5 | 212 | 6.6 |
91-120 days |
0 | 0.0 | 83 | 2.6 | 34 | 2.7 | 49 | 2.5 | 83 | 2.6 |
> 120 days |
0 | 0.0 | 81 | 2.6 | 33 | 2.6 | 48 | 2.5 | 81 | 2.5 |
Total |
73 | 100 | 3,143 | 100 | 1,279 | 100 | 1,937 | 100 | 3,216 | 100 |
Table C23 Notes
Source: Correctional Service of Canada.
Administrative segregation is the separation, when specific legal requirements are met, of an inmate from the general population, other than pursuant to a disciplinary decision. As per subsection 33(3) of the Corrections and Conditional Release Act:
31(3) The institutional head may order that an inmate be confined in administrative segregation if the institutional head is satisfied that there is no reasonable alternative to administrative segregation and he or she believes on reasonable grounds that:
(a) the inmate has acted, has attempted to act or intends to act in a manner that jeopardizes the security of the penitentiary or the safety of any person and allowing the inmate to associate with other inmates would jeopardize the security of the penitentiary or the safety of any person;
(b) allowing the inmate to associate with other inmates would interfere with an investigation that could lead to a criminal charge or a charge under subsection 41(2) of a serious disciplinary offence; or
(c) allowing the inmate to associate with other inmates would jeopardize the inmate’s safety.
Offenders segregated under paragraph (f), subsection 44(1) of the Corrections and Conditional Release Act (Disciplinary Segregation) are not included.
These reports count admissions, not offenders. Offenders admitted multiple times to segregation are counted once for each admission.
Table C23 in the 2021 CCRSO corresponds to Table C18 in the 2020 CCRSO.
Number of offender deaths while in custody: 10-year trend
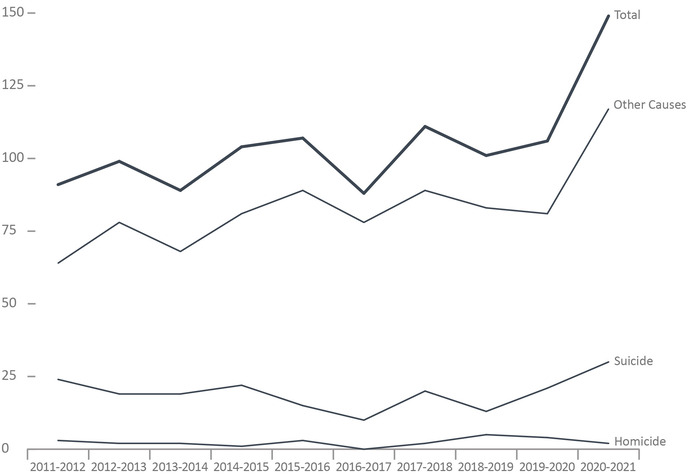
Image description
Line graph showing the number of offender deaths while in the custody of federal, provincial and territorial correctional systems by cause of death from fiscal year 2011 to 12 until fiscal year 2020 to 21. Homicide accounted for the fewest amount of deaths, at less than 5 per year and remained consistent over the 10 year period. Suicide accounted for less than 25 deaths per year until fiscal year 2020 to 21 when it jumped to 30 deaths. Years with the lowest numbers of suicide were fiscal years 2016 to 17 and fiscal year 2018 to 19. Full data are available below. Causes of death classified as “Other” than homicide or suicide closely match the overall trend in offender deaths in custody because they are by far the most common cause of offender deaths starting at about 60 in fiscal year 2011 to 12, erratically moving upward and downward most years, which forms a trend of gradual increase until the year 2020 to 21 when there was a large jump in the number of deaths in this category to over 100 deaths for that year. Full data are available below.
Figure C24 Notes
Source: Adult Correctional Services Survey, Canadian Centre for Justice and Community Safety Statistics, Statistics Canada.
- In the ten-year period from 2011-12 to 2020-21, a total of 671 federal offenders and 547 provincial/territorial offenders died while in custody. During this time period, suicides accounted for 14.2% of federal offender deaths and 22.1% of provincial offender deaths. The suicide rateFootnote * was approximately 44 per 100,000 for incarcerated federal offenders, and approximately 32 per 100,000 for incarcerated provincial offenders.
- Between 2011-12 and 2020-21, 4.0% of federal offender deaths and 0.7% of provincial offender deaths were due to homicide. The homicide rate for incarcerated federal offenders was approximately 11 per 100,000 and 1 per 100,000 for incarcerated provincial offenders.
Other causes of death includes death from natural causes, accidental deaths, death as a result of legal intervention, unknown cause of death and other.
The data on cause of death are subject to change following an official review or investigation, and should be used/interpreted with caution. The data presented were provided by the Canadian Centre for Justice and Community Safety Statistics at Statistics Canada, and may not reflect the outcome of recent reviews or investigations or cause of death.
The figure includes data from the most recent year available at the time of publication.
Figure C24 in the 2021 CCRSO corresponds to Figure C19 in the 2020 CCRSO.
| Year | Homicide | Suicide | Other Causes | Total | |||
|---|---|---|---|---|---|---|---|
| Federal | # | % | # | % | # | % | # |
2011-12 |
3 | 5.7 | 8 | 15.1 | 42 | 79.2 | 53 |
2012-13 |
1 | 1.8 | 11 | 20.0 | 43 | 78.2 | 55 |
2013-14 |
1 | 2.1 | 9 | 18.8 | 38 | 79.2 | 48 |
2014-15 |
1 | 1.5 | 13 | 19.4 | 53 | 79.1 | 67 |
2015-16 |
3 | 4.6 | 9 | 13.8 | 53 | 81.5 | 65 |
2016-17 |
0 | 0.0 | 3 | 6.4 | 44 | 93.6 | 47 |
2017-18 |
2 | 3.6 | 6 | 10.9 | 47 | 85.5 | 55 |
2018-19 |
5 | 9.8 | 6 | 11.8 | 40 | 78.4 | 51 |
2019-20 |
4 | 6.5 | 11 | 17.7 | 47 | 75.8 | 62 |
2020-21 |
1 | 1.4 | 6 | 8.7 | 62 | 89.9 | 69 |
Total |
27 | 4.0 | 95 | 14.2 | 549 | 81.8 | 671 |
| Provincial and Territories | # | % | # | % | # | % | # |
2011-12 |
0 | 0.0 | 16 | 42.1 | 22 | 57.9 | 38 |
2012-13 |
1 | 2.3 | 8 | 18.2 | 35 | 79.5 | 44 |
2013-14 |
1 | 2.4 | 10 | 24.4 | 30 | 73.2 | 41 |
2014-15 |
0 | 0.0 | 9 | 24.3 | 28 | 75.7 | 37 |
2015-16 |
0 | 0.0 | 6 | 14.3 | 36 | 85.7 | 42 |
2016-17 |
0 | 0.0 | 7 | 17.1 | 34 | 82.9 | 41 |
2017-18 |
0 | 0.0 | 14 | 25.0 | 42 | 75.0 | 56 |
2018-19 |
0 | 0.0 | 7 | 14.0 | 43 | 86.0 | 50 |
2019-20 |
0 | 0.0 | 10 | 22.7 | 34 | 77.3 | 44 |
2020-21 |
1 | 1.3 | 24 | 30.0 | 55 | 68.8 | 80 |
Total |
4 | 0.7 | 121 | 22.1 | 422 | 77.1 | 547 |
| Total Federal and Provincial Offender Deaths | 31 | 4.8 | 216 | 36.3 | 971 | 159.0 | 1,218 |
Table C24 Notes
Source: Adult Correctional Services Survey, Canadian Centre for Justice and Community Safety Statistics, Statistics Canada.
For the calculation of rates, the total actual in-count numbers between 2009-10 and 2018-19 was used as the denominator.
Other causes of death includes death from natural causes, accidental deaths, death as a result of legal intervention, unknown cause of death and other.
The data on cause of death are subject to change following an official review or investigation, and should be used/interpreted with caution. The data presented were provided by the Canadian Centre for Justice and Community Safety Statistics at Statistics Canada, and may not reflect the outcome of recent reviews or investigations or cause of death.
The figure includes data from the most recent year available at the time of publication.
Table C24 in the 2021 CCRSO corresponds to Table C19 in the 2020 CCRSO.
The number of escapees from federal institutions
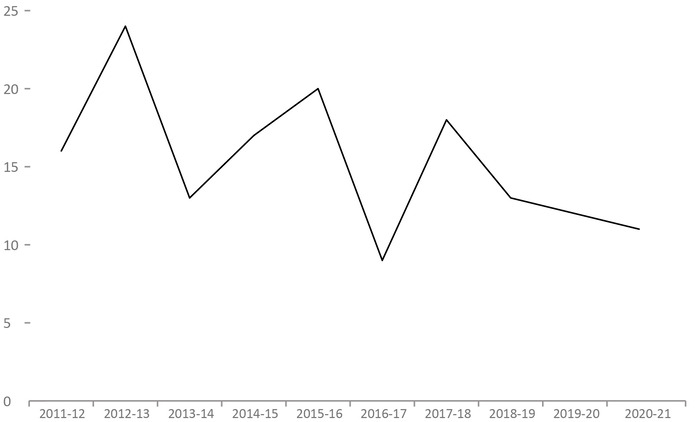
Image description
Line graph showing the number of escapees from federal institutions from fiscal year 2011 to 12 until fiscal year 2020 to 21. This trend rose and fell erratically over the 10-year period with its peaks in 2012 to 13, 2015 to 16, and 2017 to 18, and lowest points in 2011 to 12, 2013 to 14, 2016 to 17, and 2020 to 21. This represents a gradual decline from around 20 escapees early in the time period to just over 10 escapees at the end of the time period. Full data are available below.
Figure C25 Notes
Source: Correctional Service of Canada.
- In 2020-21, there were 11 escape incidents involving a total of 11 offenders. All of the 11 offenders were recaptured.
- Offenders who escaped from federal institutions or Healing Lodges in 2020-21 represented 0.1% of the in-custody population.
The data represent the number of escape incidents from federal facilities or Healing Lodges during each fiscal year. An escape can involve more than one offender.
These numbers are subject to change further to new information becoming available.
A fiscal year runs from April 1 to March 31 of the following year.
Figure C25 in the 2021 CCRSO corresponds to Figure C20 in the 2020 CCRSO.
| Escapes | 2016-17 | 2017-18 | 2018-19 | 2019-20 | 2020-21 |
|---|---|---|---|---|---|
| Total Number of Escape Incidents | 9 | 13 | 12 | 9 | 11 |
| Total Number of Escapees | 9 | 18 | 13 | 12 | 11 |
Table C25 Notes
Source: Correctional Service of Canada.
The data represent the number of escape incidents from federal facilities or Healing Lodges during each fiscal year. An escape can involve more than one offender.
These numbers are subject to change further to new information becoming available.
A fiscal year runs from April 1 to March 31 of the following year.
Table C25 in the 2021 CCRSO corresponds to Table C20 in the 2020 CCRSO.
CSC offenders in community under supervision: 10-year trend
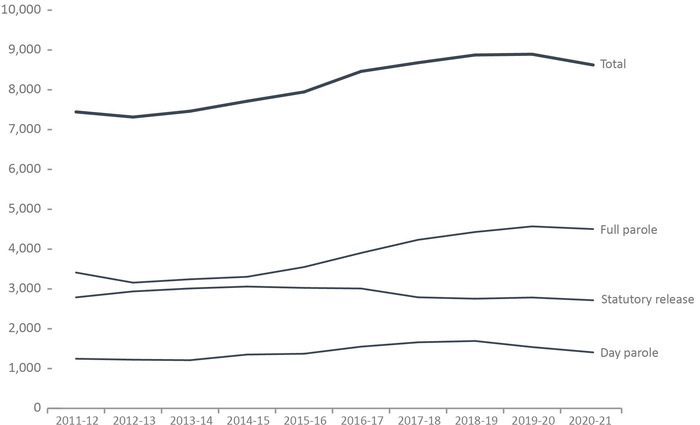
Image description
Line graph showing the population of Correctional Service Canada offenders in the community under supervision at fiscal year-end for the fiscal years 2011 to 12 until 2020 to 21. Day parole accounted for the lowest number of offenders gradually increasing from 1,246 in fiscal year 2011 to 12 until its peak in fiscal year 2018 to 19 at 1,692, then decreases to 1,406 in fiscal year 2020 to 21. Statutory release accounts for the next lowest population rising from 2,788 in fiscal year 2011 to 12 until its peak in 2014 to 15 at 3,304 remaining relatively consistent until a drop after fiscal year 2016 to 17 which continued until fiscal year 2020 to 21 at 2,715. Full parole dropped from 3,411 in fiscal year 2011 to 12 to 3,157 in fiscal year 2012 to 13, before climbing to its peak in fiscal year 2019 to 20 at 4,570, then dropping to 4,503 in fiscal year 2020 to 21. The totals follow a similar trend dropping first from 2011 to 12 until 2012 to 13, then rising until its peak in 2019 to 20, and dropping again slightly in fiscal year 2020 to 21. Full data are available below.
Figure C26 Notes
Source: Correctional Service of Canada.
- Over the past five years, the total offender population supervised in the community increased by 1.9%. For the same period, the total number of offenders on full parole increased by 15.4% while the proportion of offenders on statutory release decreased by 9.8%. At the end of fiscal year 2020-21, there were 7,917 males and 707 females on active community supervision. There were no offenders who identified as another sex on active community supervision.
- Over the last ten years, the total offender population supervised in the community increased by 15.8%. For the same period, the total number of offenders on full parole increased by 32.0% and the proportion of offenders on statutory release decreased by 2.6%.
The data reflect the offender population in the community under supervision which includes all active offenders on day parole, full parole, statutory release, offenders who are temporarily detained in a non-CSC facility, offenders who are unlawfully at large for less than 90 days, offenders on remand in a non-CSC facility, and offenders supervised and subject to an immigration hold by Canada Border Services Agency.
The data presented above do not include offenders who were on long term supervision orders (See Figure/Table E4).
Day parole is a type of conditional release granted by the Parole Board of Canada whereby offenders are permitted to participate in community-based activities in preparation for full parole or statutory release. The conditions require offenders to return nightly to an institution or half-way house unless otherwise authorized by the Parole Board of Canada.
Full parole is a type of conditional release granted by the Parole Board of Canada whereby the remainder of the sentence is served under supervision in the community.
Statutory release refers to a conditional release that is subject to supervision after the offender has served two-thirds of the sentence.
Percent change is measured from the previous year.
These cases reflect the number of offenders on active supervision at fiscal year end. A fiscal year runs from April 1 to March 31 of the following year.
Figure C26 in the 2021 CCRSO corresponds to Figure C21 in the 2020 CCRSO.
| Year | Day Parole | Full Parole | Statutory Release | Totals | % change | |||||||||
|---|---|---|---|---|---|---|---|---|---|---|---|---|---|---|
| Females | Males | Another Sex | Females | Males | Another Sex | Females | Males | Another Sex | Females | Males | Another Sex | Total | Both | |
| 2011-12 | 123 | 1,123 | NR | 257 | 3,154 | NR | 127 | 2,661 | NR | 507 | 6,938 | NR | 7,445 | -1.5 |
| 2012-13 | 116 | 1,106 | NR | 225 | 2,932 | NR | 136 | 2,801 | NR | 477 | 6,839 | NR | 7,316 | -1.7 |
| 2013-14 | 106 | 1,104 | NR | 225 | 3,017 | NR | 153 | 2,858 | NR | 484 | 6,979 | NR | 7,463 | 2.0 |
| 2014-15 | 115 | 1,236 | NR | 239 | 3,065 | NR | 150 | 2,909 | NR | 504 | 7,210 | NR | 7,714 | 3.4 |
| 2015-16 | 124 | 1,248 | NR | 273 | 3,276 | NR | 177 | 2,849 | NR | 574 | 7,373 | NR | 7,947 | 3.0 |
| 2016-17 | 158 | 1,392 | NR | 316 | 3,587 | NR | 154 | 2,856 | NR | 628 | 7,835 | NR | 8,463 | 6.5 |
| 2017-18 | 197 | 1,462 | NR | 369 | 3,864 | NR | 145 | 2,644 | NR | 711 | 7,970 | NR | 8,681 | 2.6 |
| 2018-19 | 192 | 1,500 | NR | 370 | 4,059 | NR | 159 | 2,595 | NR | 721 | 8,154 | NR | 8,875 | 2.2 |
| 2019-20 | 163 | 1,376 | 0 | 406 | 4,164 | 1 | 152 | 2,632 | 0 | 721 | 8,172 | 1 | 8,894 | 0.2 |
| 2020-21 | 148 | 1,258 | 0 | 398 | 4,105 | 0 | 161 | 2,554 | 0 | 707 | 7,917 | 0 | 8,624 | -3.0 |
Table C26 Notes
Source: Correctional Service of Canada.
The data reflect the offender population in the community under supervision which includes all active offenders on day parole, full parole, statutory release, offenders who are temporarily detained in a non-CSC facility, offenders who are unlawfully at large for less than 90 days, offenders on remand in a non-CSC facility, and offenders supervised and subject to an immigration hold by Canada Border Services Agency.
The data presented above do not include offenders who were on long term supervision orders (See Figure/Table E4).
Day parole is a type of conditional release granted by the Parole Board of Canada whereby offenders are permitted to participate in community-based activities in preparation for full parole or statutory release. The conditions require offenders to return nightly to an institution or half-way house unless otherwise authorized by the Parole Board of Canada.
Full parole is a type of conditional release granted by the Parole Board of Canada whereby the remainder of the sentence is served under supervision in the community.
Statutory release refers to a conditional release that is subject to supervision after the offender has served two-thirds of the sentence.
Percent change is measured from the previous year.
These cases reflect the number of offenders on active supervision at fiscal year end. A fiscal year runs from April 1 to March 31 of the following year.
Table C26 in the 2021 CCRSO corresponds to Table C21 in the 2020 CCRSO.
Offenders under provincial/territorial supervision on probation or conditional sentence: 10-year trend
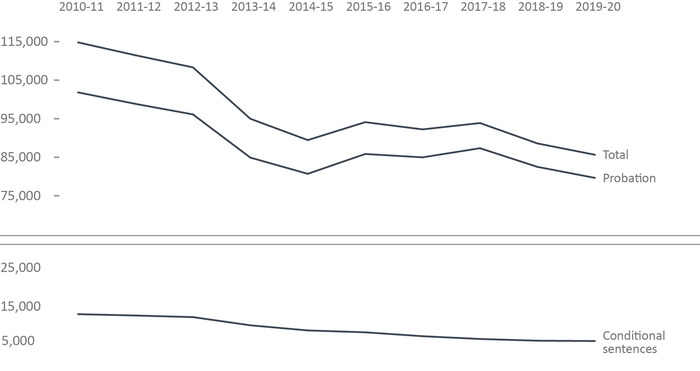
Image description
Line graph showing the average monthly offender accounts under provincial and territorial supervision on probation or conditional sentences from fiscal year 2010 to 11 until fiscal year 2019 to 20. Conditional sentences decreased from 12,968 in fiscal year 2010 to 11 to 5,995 in fiscal year 2019 to 20. Probation counts decreased from 101,825 in fiscal year 2010 to 11 to 80,705 in fiscal year 2014 to 15, prior to increasing for fiscal year 2015 to 16 at 85,845, decreasing for fiscal year 2016 to 17 at 84,978, increasing again for fiscal year 2017 to 18 at 87,342, then decreasing until its lowest point in fiscal year 2020 to 21 at 79,652. The totals follow the same trend as the probation line, with its highest point in fiscal year 2010, and its lowest point in fiscal year 2019. Full data are available below.
Figure C27 Notes
Source: Table 35-10-0154-01, Corrections Key Indicator Report for Adults and Youth, Canadian Centre for Justice and Community Safety Statistics, Statistics
Canada.
- Between 2010-11 to 2019-20 there was a 25.4% decrease in the provincial/territorial community corrections population. The 2019-20 rate was 3.3% lower than in 2018-19 and 9.0% lower than the rate in 2015-16.
- The number of offenders on conditional sentence orders decreased 53.8% from 12,968 in 2010-11 to 5,995 in 2019-20. The 2019-20 rate was 1.4% lower than 2018-19 and 27.4% lower than the rate 5 years prior in 2015-16.
- The number of offenders on probation decreased 21.8% from 2010-11 to 2019-20. The 2019-20 rate was 3.3% lower than in 2018-19 and 9.0% lower than the rate in 2015-16.
A conditional sentence is a disposition of the court where the offender serves a term of imprisonment in the community under specified conditions. This type of sentence can only be imposed in cases where the term of imprisonment would be less than two years. Conditional sentences have been a provincial and territorial sentencing option since September 1996.
The figure includes data from the most recent year available at the time of publication.
Figure C27 in the 2021 CCRSO corresponds to Figure C22 in the 2020 CCRSO.
| Year | Average Monthly Offender Counts on Probation | Average Monthly Offender Counts on Conditional Sentence | Total |
|---|---|---|---|
| 2010-11 | 101,825 | 12,968.60 | 114,794 |
| 2011-12 | 98,843 | 12,615.90 | 111,459 |
| 2012-13 | 96,116 | 12,202.40 | 108,318 |
| 2013-14 | 84,905 | 10,076.80 | 94,981 |
| 2014-15 | 80,705 | 8,745.60 | 89,451 |
| 2015-16 | 85,845 | 8,258.80 | 94,104 |
| 2016-17 | 84,978 | 7,249.30 | 92,228 |
| 2017-18 | 87,342 | 6,528.90 | 93,871 |
| 2018-19 | 82,500 | 6,082.10 | 88,582 |
| 2019-20 | 79,652 | 5,995.00 | 85,647 |
Table C27 Notes
Source: Table 35-10-0154-01, Corrections Key Indicator Report for Adults and Youth, Canadian Centre for Justice and Community Safety Statistics, Statistics Canada.
A conditional sentence is a disposition of the court where the offender serves a term of imprisonment in the community under specified conditions. This type of sentence can only be imposed in cases where the term of imprisonment would be less than two years. Conditional sentences have been a provincial and territorial sentencing option since September 1996.
The figure includes data from the most recent year available at the time of publication.
Table C27 in the 2021 CCRSO corresponds to Table C22 in the 2020 CCRSO.
Population of offenders on provincial parole: 10-year trend
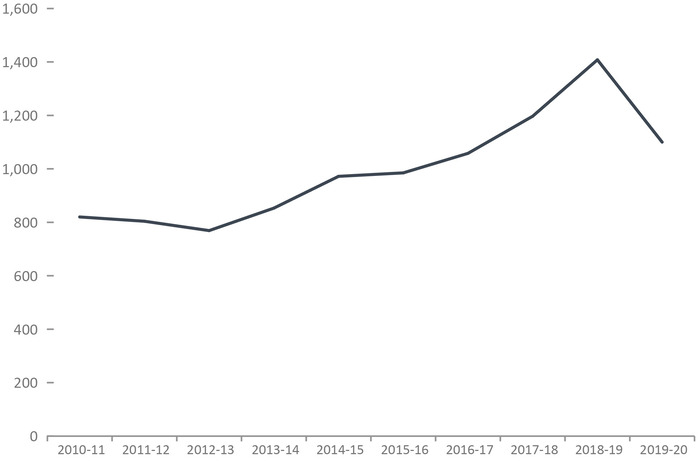
Image description
Line graph showing the average monthly count of offenders on provincial day or full parole from fiscal year 2010 to 11 until fiscal year 2019 to 20. The population of offenders decreases from 820 in fiscal year 2010 to 11 to its lowest point at 769 in fiscal year 2012 to 13, before increasing steadily until its peak at 1408 in fiscal year 2018 to 19, before dropping to 1100 in fiscal year 2019 to 20. Full data are available below.
Figure C28 Notes
Source: Table 35-10-0154-01, Corrections Key Indicator Report for Adults and Youth, Canadian Centre for Justice and Community Safety Statistics, Statistics Canada.
- The number of offenders on provincial parole decreased by 21.9% from 2018-19 to 2019-20 (1,408 offenders to 1,100).
- In the 5 years between 2015-16 to 2019-20, there was an 11.7% increase in the number of offenders on provincial parole, up from 985 in 2015-16 to 1,100 in 2019-20.
In 2020, provincial parole boards operated in Quebec and Ontario. The provincial parole board in Alberta was officially introduced on February 1st, 2021. Thus, data related to the latter will only be available in the next iteration of the CCRSO. On April 1, 2007, the Parole Board of Canada assumed responsibility for parole decisions relating to offenders serving sentences in British Columbia's provincial correctional facilities. The Parole Board of Canada has jurisdiction over granting parole to provincial offenders in the Atlantic and Prairie provinces, British Columbia, and to territorial offenders in Yukon, Nunavut and the Northwest Territories.
The figure includes data from the most recent year available at the time of publication.
Figure C28 in the 2021 CCRSO corresponds to Figure C23 in the 2020 CCRSO.
| Year | Provincial Boards | Parole Board of Canada | Total | % Change | ||
|---|---|---|---|---|---|---|
| Quebec | Ontario | Total | ||||
| 2010-11 | 482 | 171 | 653 | 167 | 820 | 100.0 |
| 2011-12 | 481 | 179 | 660 | 144 | 804 | -2.0 |
| 2012-13 | 462 | 164 | 626 | 143 | 769 | -4.6 |
| 2013-14 | 527 | 172 | 699 | 154 | 853 | 9.8 |
| 2014-15 | 612 | 207 | 821 | 151 | 972 | 12.2 |
| 2015-16 | 639 | 207 | 846 | 139 | 985 | 1.3 |
| 2016-17 | 701 | 205 | 907 | 151 | 1058 | 6.9 |
| 2017-18 | 792 | 242 | 1,034 | 163 | 1197 | 11.6 |
| 2018-19 | 858 | 398 | 1,256 | 152 | 1408 | 15.0 |
| 2019-20 | 682 | 289 | 973 | 127 | 1100 | -28.0 |
Table C28 Notes
Source: Table 35-10-0154-01, Corrections Key Indicator Report for Adults and Youth, Canadian Centre for Justice and Community Safety Statistics, Statistics Canada.
Provincial parole boards operate in Quebec and Ontario. On April 1, 2007, the Parole Board of Canada assumed responsibility for parole decisions relating to offenders serving sentences in British Columbia's provincial correctional facilities. The Parole Board of Canada has jurisdiction over granting parole to provincial offenders in the Atlantic and Prairie provinces, British Columbia, and to territorial offenders in Yukon, Nunavut and the Northwest Territories.
The figure includes data from the most recent year available at the time of publication.
Table C28 in the 2021 CCRSO corresponds to Table C23 in the 2020 CCRSO.
Section D: Conditional Release
Number of CSC offenders granted temporary absences: 10-year trend
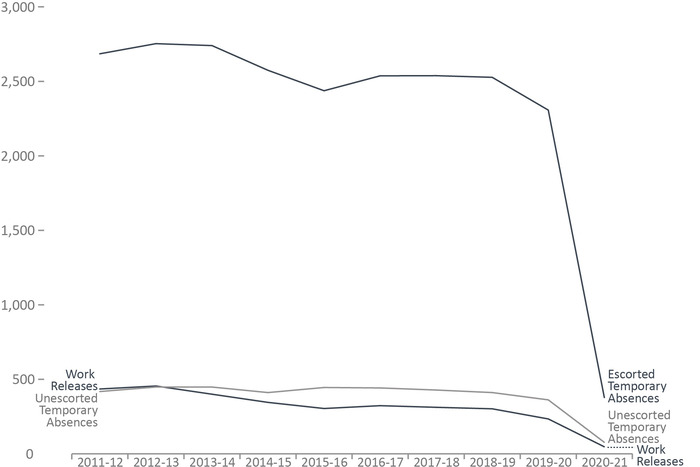
Image description
Line graph showing the number of Correctional Service of Canada offenders who were granted temporary absences, over a 10-year period, by type of temporary absence that was granted. The vast majority of temporary absences which were granted are escorted temporary absences, which went from around 2,700 being granted per year in fiscal year 2011 to 12, to slightly decline to about 2,300 being granted in fiscal year 2019 to 20, quickly declining to less than 500 temporary absences which were granted in fiscal year 2020 to 21. Work releases and unescorted temporary absences were each granted just under 500 temporary absences in fiscal year 2011 to 12, which declined slowly for each of the years until fiscal year 2019 to 20, after which these temporary absence grants plunged to close to zero in fiscal year 2022 to 21. Full data are available below.
Figure D1 Notes
Source: Correctional Service of Canada.
- There was a decrease in the number of offenders receiving escorted temporary absences, from 2,307 in 2019-20 to 378 in 2020-21. There was a decrease in the number of offenders receiving unescorted temporary absences, from 362 in 2019-20 to 18 in 2020-21.
- The number of offenders receiving work releases has decreased by 79.9%, from 234 in 2019-20 to 47 in 2020-21.
- For the past 10 years, the average successful completion rates for escorted temporary absences was 99.6%, 98.9% for unescorted temporary absences and 94.2% for work releases.
A temporary absence is permission given to an eligible offender to be away from the normal place of confinement for medical, administrative, community service, family contact, personal development for rehabilitative purposes, or compassionate reasons, including parental responsibilities.
A work release is a structure program of release of specified duration for work or community service outside the penitentiary, under the supervision of a staff member or other authorized person or organization.
These numbers depict the number of offenders who received at least one temporary absence permit (excluding those for medical purposes) or at least one work release. An offender may be granted more than one temporary absence permit or work.
Figure D1 in the 2021 CCRSO corresponds to Figure D12 in the 2020 CCRSO.
| Year | Temporary Absences | Work Releases | ||||
|---|---|---|---|---|---|---|
| Escorted | Unescorted | |||||
| # of Offenders | # of Permits | # of Offenders | # of Permits | # of Offenders | # of Permits | |
| 2011-12 | 2,685 | 44,396 | 418 | 3,891 | 435 | 875 |
| 2012-13 | 2,753 | 47,814 | 448 | 3,709 | 455 | 815 |
| 2013-14 | 2,740 | 49,502 | 448 | 4,005 | 400 | 643 |
| 2014-15 | 2,574 | 49,630 | 411 | 3,563 | 345 | 489 |
| 2015-16 | 2,437 | 47,072 | 445 | 4,077 | 304 | 418 |
| 2016-17 | 2,537 | 48,574 | 442 | 3,778 | 323 | 481 |
| 2017-18 | 2,538 | 50,477 | 428 | 3,165 | 312 | 443 |
| 2018-19 | 2,527 | 55,927 | 411 | 2,819 | 302 | 434 |
| 2019-20 | 2,307 | 51,008 | 362 | 2,890 | 234 | 315 |
| 2020-21 | 378 | 2,619 | 18 | 59 | 47 | 54 |
Table D1 Notes
Source: Correctional Service of Canada.
A temporary absence is permission given to an eligible offender to be away from the normal place of confinement for medical, administrative, community service, family contact, personal development for rehabilitative purposes, or compassionate reasons, including parental responsibilities.
A work release is a structure program of release of specified duration for work or community service outside the penitentiary, under the supervision of a staff member or other authorized person or organization.
These numbers depict the number of offenders who received at least one temporary absence permit (excluding those for medical purposes) or at least one work release. An offender may be granted more than one temporary absence permit or work.
Table D1 in the 2021 CCRSO corresponds to Table D12 in the 2020 CCRSO.
Offenders released from federal institutions including Healing Lodges on parole: 10-year trend
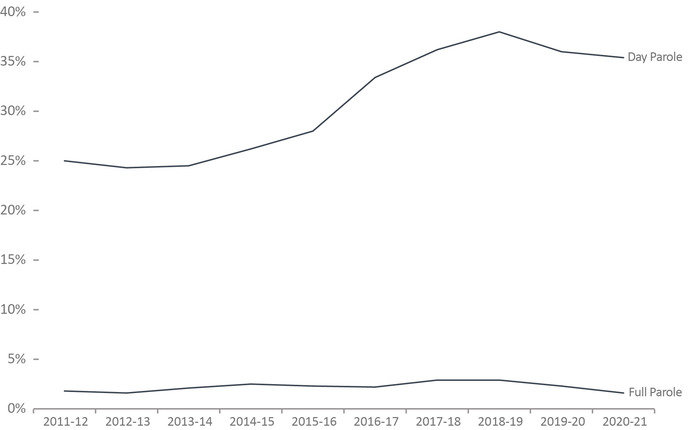
Image description
Line graph showing the percentage of offenders that were released from federal institutions and Healing Lodges to be on parole, over a 10 year period, by type of parole. About 20 percent of offenders at federal institutions were released on day parole between fiscal year 2011 to 12 and fiscal year 2013 to 14 when the rate of day parole release rose to a high of over 35 percent in fiscal year 2019 to 20, after which the rate declined to just under 35 percent in fiscal year 202 to 21. In contrast, very few people are granted full parole, with the rate hovering between two and four percent for the entire 10 year period. Full data are available below.
Figure D2 Notes
Source: Correctional Service of Canada.
- In fiscal year 2020-21, 35.4% of all releases from federal institutions were on day parole and 1.6% were on full parole.
- In fiscal year 2020-21, 23.5% of releases for Indigenous offenders were on day parole and 0.7% were on full parole compared to 40.9% and 1.9% respectively for Non-Indigenous offenders.
- Over the past ten years, the percentage of releases on day parole increased from 25.0% to 35.4% and the percentage of releases on full parole decreased from 1.8% to 1.6%.
The data includes all releases from a federal institution or Healing Lodge in a given fiscal year excluding offenders with quashed sentences, offenders who died in custody, long-term supervision order (LTSO) releases, offenders released at warrant expiry and offenders transferred to foreign countries. An offender may be released more than once during the reporting timeframe in cases where a previous release was subject to revocation, suspension, temporary detention, interruption or in cases where an offender served more than one sentence.
Day parole is a type of conditional release granted by the Parole Board of Canada whereby offenders are permitted to participate in community-based activities in preparation for full parole or statutory release. The conditions require offenders to return nightly to an institution or half-way house unless otherwise authorized by the Parole Board of Canada.
Full parole is a type of conditional release granted by the Parole Board of Canada whereby the remainder of the sentence is served under supervision in the community.
A fiscal year runs from April 1 to March 31 of the following year.
| Year | Indigenous | Non-Indigenous | Total Offender Population | |||||||
|---|---|---|---|---|---|---|---|---|---|---|
| Day Parole | Full Parole | Total Releases | Day Parole | Full Parole | Total Releases | Day Parole | Full Parole | Total Releases | ||
| 2011-12 | # | 291 | 12 | 1,792 | 1,520 | 116 | 5,448 | 1,811 | 128 | 7,240 |
| % | 16.2 | 0.7 | 27.9 | 2.1 | 25.0 | 1.8 | ||||
| 2012-13 | # | 319 | 7 | 1,954 | 1,509 | 110 | 5,579 | 1,828 | 117 | 7,533 |
| % | 16.3 | 0.4 | 27.0 | 2.0 | 24.3 | 1.6 | ||||
| 2013-14 | # | 288 | 18 | 2,037 | 1,594 | 145 | 5,644 | 1,882 | 163 | 7,681 |
| % | 14.1 | 0.9 | 28.2 | 2.6 | 24.5 | 2.1 | ||||
| 2014-15 | # | 311 | 10 | 2,066 | 1,664 | 175 | 5,466 | 1,975 | 185 | 7,532 |
| % | 15.1 | 0.5 | 30.4 | 3.2 | 26.2 | 2.5 | ||||
| 2015-16 | # | 342 | 14 | 2,038 | 1,788 | 164 | 5,578 | 2,130 | 178 | 7,616 |
| % | 16.8 | 0.7 | 32.1 | 2.9 | 28.0 | 2.3 | ||||
| 2016-17 | # | 433 | 14 | 2,039 | 2,094 | 153 | 5,538 | 2,527 | 167 | 7,577 |
| % | 21.2 | 0.7 | 37.8 | 2.8 | 33.4 | 2.2 | ||||
| 2017-18 | # | 500 | 25 | 2,065 | 2,122 | 184 | 5,186 | 2,622 | 209 | 7,251 |
| % | 24.2 | 1.2 | 40.9 | 3.5 | 36.2 | 2.9 | ||||
| 2018-19 | # | 552 | 33 | 2,014 | 2,131 | 174 | 5,049 | 2,683 | 207 | 7,063 |
| % | 27.4 | 1.6 | 42.2 | 3.4 | 38.0 | 2.9 | ||||
| 2019-20 | # | 517 | 24 | 2,167 | 2,026 | 140 | 4,897 | 2,543 | 164 | 7,064 |
| % | 23.9 | 1.1 | 41.4 | 2.9 | 36.0 | 2.3 | ||||
| 2020-21 | # | 487 | 15 | 2,076 | 1,827 | 87 | 4,465 | 2,314 | 102 | 6,541 |
| % | 23.5 | 0.7 | 40.9 | 1.9 | 35.4 | 1.6 | ||||
Table D2 Notes
Source: Correctional Service of Canada.
Percentage is calculated based on the number of day and full paroles compared to the total releases for each offender group.
The data includes all releases from a federal institution or Healing Lodge in a given fiscal year excluding offenders with quashed sentences, offenders who died in custody, long-term supervision order (LTSO) releases, offenders released at warrant expiry and offenders transferred to foreign countries. An offender may be released more than once during the reporting timeframe in cases where a previous release was subject to revocation, suspension, temporary detention, interruption or in cases where an offender served more than one sentence.
Day parole is a type of conditional release granted by the Parole Board of Canada whereby offenders are permitted to participate in community-based activities in preparation for full parole or statutory release. The conditions require offenders to return nightly to an institution or half-way house unless otherwise authorized by the Parole Board of Canada.
Full parole is a type of conditional release granted by the Parole Board of Canada whereby the remainder of the sentence is served under supervision in the community.
A fiscal year runs from April 1 to March 31 of the following year.
Federal day and full parole grant rates: 10-year trend
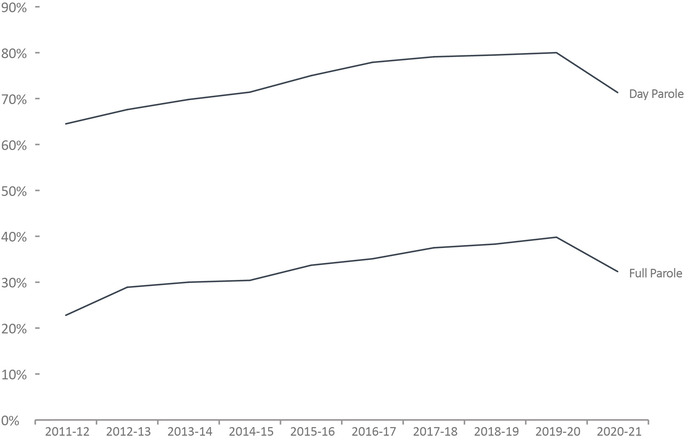
Image description
Line graph showing federal day and full parole grant rates, over a 10 year period. Between fiscal year 2011 to 12 and fiscal year 2019 to 20 the federal rate for granting day parole went from about 65 percent to over 75 percent, declining to nearly 65 percent again in fiscal year 2020 to 21. The rate for granting full parole follows a similar trend, but starts at just over 20 percent being granted full parole in fiscal year 2011 to 12 to a high of around 35 percent in fiscal year 2019 to 20, falling to just under 30 percent in the next fiscal year. Full data are available below.
Figure D3 Notes
Source: Parole Board of Canada.
- In 2020-21, the federal day parole grant rateFootnote * declined to 71.3%, which is a 8.7% decrease compared to the previous year.
- In 2020-21, the federal full parolegrant rateFootnote * decreased to 32.3%, which is a 7.6% decrease compared to the previous year.
- Over the last 10 years, female offenders had a much higher grant rateFootnote * for federal day parole and full parole (87.0% and 45.4%) than male offenders (72.4% and 32.0%).
Day parole is a type of conditional release granted by the Parole Board of Canada in which offenders are permitted to participate in community-based activities in preparation for full parole or statutory release. The conditions require offenders to return nightly to an institution, half-way house, or other location deemed appropriate for managing their risk, unless otherwise authorized by the Parole Board of Canada. Not all offenders apply for day parole, and some apply more than once before being granted day parole.
Full parole is a type of conditional release granted by the Parole Board of Canada in which the remainder of the sentence is served under supervision in the community. The Parole Board of Canada must review the cases of all offenders for full parole at the time prescribed by legislation, unless the offender advises the Parole Board of Canada in writing that he/she does not wish to be considered for full parole.
Not included were offenders in the category Other Gender.
Between 2011-12 and 2020-21, there were two decisions made in respect of an offender who identified as other gender, one granted/denied day parole decision and one granted/denied full parole decision. On March 28, 2011, Bill C-59 (Abolition of Early Parole Act) eliminated the accelerated parole review (APR) process, affecting first-time non-violent offenders serving sentences for Schedule II and non-Schedule offences, who in 2011-12 were no longer eligible for an APR review. These offenders are now assessed on general reoffending as compared to the APR risk assessment, which considered the risk of committing a violent offence only. To better illustrate historical trends, APR decisions were excluded.
Even though comparisons were made between federal regular day parole and full parole grant rates only, they nevertheless contain an APR residual effect between 2011-12 and 2015-16 as a sufficiently large proportion of the APR-affected population was granted regular federal day parole and full parole, perhaps inflating the grant rates.
| Type of Release | Year | Granted | Denied | Grant RateFootnote * (%) | APR | |||||
|---|---|---|---|---|---|---|---|---|---|---|
| Females | Males | Females | Males | Females | Males | Total | Directed | Total | ||
| Day Parole | 2011-12 | 249 | 2,491 | 66 | 1,441 | 79.0 | 63.4 | 64.5 | - | - |
| 2012-13 | 289 | 2,821 | 73 | 1,415 | 79.8 | 66.6 | 67.6 | 14 | 21 | |
| 2013-14 | 248 | 2,824 | 52 | 1,274 | 82.7 | 68.9 | 69.8 | 39 | 47 | |
| 2014-15 | 299 | 3,022 | 51 | 1,282 | 85.4 | 70.2 | 71.4 | 38 | 45 | |
| 2015-16 | 293 | 3,091 | 52 | 1,078 | 84.9 | 74.1 | 75.0 | 86 | 90 | |
| 2016-17 | 401 | 3,443 | 47 | 1,041 | 89.5 | 76.8 | 77.9 | 80 | 83 | |
| 2017-18 | 438 | 3,611 | 30 | 1,039 | 93.6 | 77.7 | 79.1 | 100 | 106 | |
| 2018-19 | 471 | 3,735 | 27 | 1,056 | 94.6 | 78.0 | 79.5 | 56 | 58 | |
| 2019-20 | 437 | 3,588 | 35 | 972 | 92.6 | 78.7 | 80.0 | 48 | 48 | |
| 2020-21 | 353 | 3,409 | 49 | 1,463 | 87.8 | 70.0 | 71.3 | 25 | 25 | |
| Full Parole | 2011-12 | 77 | 644 | 127 | 2,316 | 37.7 | 21.8 | 22.8 | - | - |
| 2012-13 | 90 | 914 | 142 | 2,328 | 38.8 | 28.2 | 28.9 | 26 | 26 | |
| 2013-14 | 84 | 904 | 103 | 2,202 | 44.9 | 29.1 | 30.0 | 126 | 142 | |
| 2014-15 | 87 | 969 | 105 | 2,308 | 45.3 | 29.6 | 30.4 | 119 | 137 | |
| 2015-16 | 96 | 1,063 | 127 | 2,154 | 43.0 | 33.0 | 33.7 | 166 | 185 | |
| 2016-17 | 138 | 1,237 | 158 | 2,382 | 46.6 | 34.2 | 35.1 | 122 | 126 | |
| 2017-18 | 154 | 1,362 | 175 | 2,357 | 46.8 | 36.6 | 37.5 | 161 | 165 | |
| 2018-19 | 157 | 1,451 | 175 | 2,420 | 47.3 | 37.5 | 38.3 | 66 | 67 | |
| 2019-20 | 182 | 1,385 | 159 | 2,208 | 53.4 | 38.5 | 39.8 | 60 | 60 | |
| 2020-21 | 139 | 1,282 | 140 | 2,844 | 49.8 | 31.1 | 32.3 | 37 | 38 | |
Table D3 Notes
Source: Parole Board of Canada.
Day parole is a type of conditional release granted by the Parole Board of Canada in which offenders are permitted to participate in community-based activities in preparation for full parole or statutory release. The conditions require offenders to return nightly to an institution, half-way house, or other location deemed appropriate for managing their risk, unless otherwise authorized by the Parole Board of Canada. Not all offenders apply for day parole, and some apply more than once before being granted day parole.
Full parole is a type of conditional release granted by the Parole Board of Canada in which the remainder of the sentence is served under supervision in the community. The Parole Board of Canada must review the cases of all offenders for full parole at the time prescribed by legislation, unless the offender advises the Parole Board of Canada in writing that he/she does not wish to be considered for full parole.
Not included were offenders in the category Other Gender. Between 2011-12 and 2020-21, there were two decisions made in respect of an offender who identified as other gender, one granted/denied day parole decision and one granted/denied full parole decision.
On March 28, 2011, Bill C-59 (Abolition of Early Parole Act) eliminated the accelerated parole review (APR) process, affecting first-time non-violent offenders serving sentences for Schedule II and non-Schedule offences, who in 2011-12 were no longer eligible for an APR review. These offenders are now assessed on general reoffending as compared to the APR risk assessment, which considered the risk of committing a violent offence only. To better illustrate historical trends, APR decisions were excluded.
Even though comparisons were made between federal regular day parole and full parole grant rates only, they nevertheless contain an APR residual effect between 2011-12 and 2015-16 as a sufficiently large proportion of the APR-affected population was granted regular federal day parole and full parole, perhaps inflating the grant rates.
Federal day and full parole grant rates by Indigenous and non-Indigenous: 10-year trend
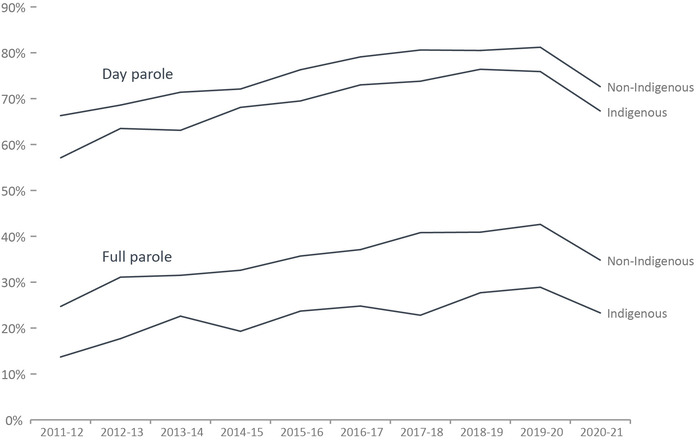
Image description
Line graph showing federal day parole and full parole grant rates, over a 10 year period, by Indigenous versus non-Indigenous identity. In all cases, non-Indigenous people are granted parole at higher rates than Indigenous people. The difference is more pronounced for the granting of full parole, with a difference of about 10 percent, than for the granting of day parole, where the difference is about 5 percent. In all cases, rates increased slowly between fiscal year 2011 to 12 until fiscal year 2019 to 20, only to see a fall of around 5 percent in the rate of parole granting in fiscal year 2020 to 21. Full data are available below.
Figure D4 Notes
Source: Parole Board of Canada.
- In 2020-21, the federal day parole grant rate decreased for both Indigenous offenders (67.3%; -8.6%) and non-Indigenous offenders (72.6%; -8.6%) compared to 2019-20.
- In 2020-21, the federal full parole grant rate decreased for both Indigenous offenders (23.3%; -5.6%) and for non-Indigenous offenders (34.8; -7.9) compared to 2019-20.
- Over the last 10 years, lower federal day and full parole grant rates were reported for Indigenous offenders (69.4%; 23.0%) than for non-Indigenous offenders (75.1%; 35.5%).
Day parole is a type of conditional release granted by the Parole Board of Canada in which offenders are permitted to participate in community-based activities in preparation for full parole or statutory release. The conditions require offenders to return nightly to an institution, half-way house, or other location deemed appropriate for managing their risk, unless otherwise authorized by the Parole Board of Canada. Not all offenders apply for day parole, and some apply more than once before being granted day parole.
Full parole is a type of conditional release granted by the Parole Board of Canada in which the remainder of the sentence is served under supervision in the community. The Parole Board of Canada must review the cases of all offenders for full parole at the time prescribed by legislation, unless the offender advises the Parole Board of Canada in writing that he/she does not wish to be considered for full parole.
Even though comparisons were made between federal regular day parole and full parole grant rates only, they nevertheless contain an accelerated parole review (APR) residual effect between 2011-12 and 2015-16 as a sufficiently large proportion of the APR-affected population was granted regular federal day parole and full parole, perhaps inflating the grant rates.
On March 28, 2011, Bill C-59 (Abolition of Early Parole Act) eliminated the accelerated parole review (APR) process, affecting first-time non-violent offenders serving sentences for Schedule II and non-Schedule offences, who in 2011-12 were no longer eligible for an APR review. These offenders are now assessed on general reoffending as compared to the APR risk assessment, which considered the risk of committing a violent offence only. To better illustrate historical trends, APR decisions were excluded.
| Type of Release | Year | Granted | Denied | Grant Rate (%) | APR | |||||
|---|---|---|---|---|---|---|---|---|---|---|
| Indigenous | Non-Ind. | Indigenous | Non-Ind. | Indigenous | Non-Ind. | Total | Directed | Total | ||
| Day Parole | 2011-12 | 476 | 2,264 | 357 | 1,150 | 57.1 | 66.3 | 64.5 | - | - |
| 2012-13 | 566 | 2,544 | 326 | 1,162 | 63.5 | 68.6 | 67.6 | 14 | 21 | |
| 2013-14 | 531 | 2,541 | 310 | 1,016 | 63.1 | 71.4 | 69.8 | 39 | 47 | |
| 2014-15 | 573 | 2,748 | 269 | 1,064 | 68.1 | 72.1 | 71.4 | 38 | 45 | |
| 2015-16 | 615 | 2,769 | 270 | 860 | 69.5 | 76.3 | 75.0 | 86 | 90 | |
| 2016-17 | 712 | 3,132 | 263 | 826 | 73.0 | 79.1 | 77.9 | 80 | 83 | |
| 2017-18 | 822 | 3,227 | 292 | 777 | 73.8 | 80.6 | 79.1 | 100 | 106 | |
| 2018-19 | 938 | 3,268 | 290 | 793 | 76.4 | 80.5 | 79.5 | 56 | 58 | |
| 2019-20 | 903 | 3,122 | 286 | 721 | 75.9 | 81.2 | 80.0 | 48 | 48 | |
| 2020-21 | 863 | 2,899 | 419 | 1,093 | 67.3 | 72.6 | 71.3 | 25 | 25 | |
| Full Parole | 2011-12 | 76 | 645 | 479 | 1,964 | 13.7 | 24.7 | 22.8 | - | - |
| 2012-13 | 102 | 902 | 475 | 1,995 | 17.7 | 31.1 | 28.9 | 26 | 26 | |
| 2013-14 | 125 | 863 | 429 | 1,876 | 22.6 | 31.5 | 30.0 | 126 | 142 | |
| 2014-15 | 109 | 947 | 455 | 1,958 | 19.3 | 32.6 | 30.4 | 119 | 137 | |
| 2015-16 | 137 | 1,022 | 442 | 1,839 | 23.7 | 35.7 | 33.7 | 166 | 185 | |
| 2016-17 | 155 | 1,220 | 470 | 2,071 | 24.8 | 37.1 | 35.1 | 122 | 126 | |
| 2017-18 | 170 | 1,346 | 577 | 1,955 | 22.8 | 40.8 | 37.5 | 161 | 165 | |
| 2018-19 | 234 | 1,374 | 611 | 1,984 | 27.7 | 40.9 | 38.3 | 66 | 67 | |
| 2019-20 | 231 | 1,336 | 569 | 1,798 | 28.9 | 42.6 | 39.8 | 60 | 60 | |
| 2020-21 | 225 | 1,196 | 740 | 2,244 | 23.3 | 34.8 | 32.3 | 37 | 38 | |
Table D4 Notes
Source: Parole Board of Canada.
Day parole is a type of conditional release granted by the Parole Board of Canada in which offenders are permitted to participate in community-based activities in preparation for full parole or statutory release. The conditions require offenders to return nightly to an institution, half-way house, or other location deemed appropriate for managing their risk, unless otherwise authorized by the Parole Board of Canada. Not all offenders apply for day parole, and some apply more than once before being granted day parole.
Full parole is a type of conditional release granted by the Parole Board of Canada in which the remainder of the sentence is served under supervision in the community. The Parole Board of Canada must review the cases of all offenders for full parole at the time prescribed by legislation, unless the offender advises the Parole Board of Canada in writing that he/she does not wish to be considered for full parole.
Even though comparisons were made between federal regular day parole and full parole grant rates only, they nevertheless contain an accelerated parole review (APR) residual effect between 2011-12 and 2015-16 as a sufficiently large proportion of the APR-affected population was granted regular federal day parole and full parole, perhaps inflating the grant rates.
Number of federal Elder-assisted parole hearings: 10-year trend
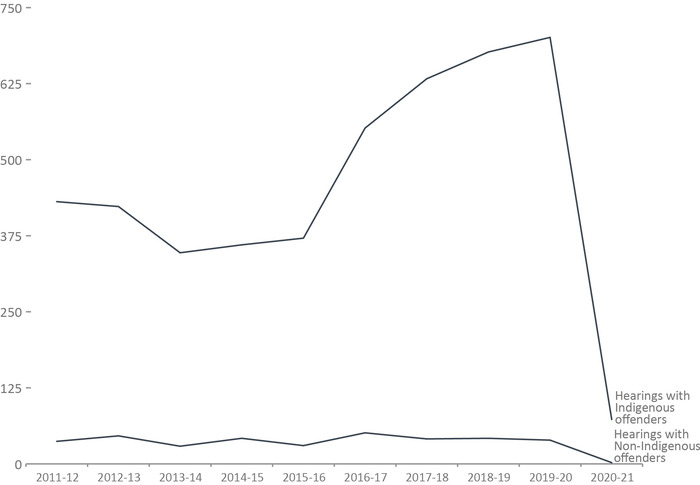
Image description
Line graph showing the number of federal Elder-assisted parole hearings, over a 10 year period, for the hearings with Indigenous offenders versus the hearings with non-Indigenous offenders. There are Elder assisted parole hearings for non-Indigenous offenders in about 40 hearings a year, until fiscal year 2020 to 21 when there were no hearings where an Elder assisted on a parole hearing for a non-Indigenous person. As one might expect, Elders assisted in the parole hearings of Indigenous offenders at a much higher frequency. In fiscal year 2011 to 12 Elders assisted Indigenous offenders in approximately 400 hearings, which declined to under 375 hearings until fiscal year 2016 to 17 when the number of hearings at which Elders assisted increased to over 65 hearings a year in fiscal year 2019 to 20, only to fall to close to only 100 hearings in fiscal year 2020 to 21. Full data are available below.
Figure D5 Notes
Source: Parole Board of Canada.
- The number of federal Elder-Assisted parole hearings decreased by 89.9% in 2020-21 compared to 2019-2020. This is a direct result of health and safety measures put in place to address the COVID-19 pandemic.
- In 2020-21, 4.2% (73) of all federal parole hearings involving Indigenous offenders, and less than 0.1% (2) of all federal parole hearings for offenders who did not self-identify as Indigenous were Elder-Assisted Hearings.
The term Elder also refers to a Cultural Advisor as defined in section 11.1.1.5 of the Decision-Making Policy Manual.
The presence of an Elder is an alternative approach to the traditional parole hearing, and was introduced by the Parole Board of Canada to ensure that conditional release hearings are sensitive to Indigenous cultural values and traditions. This type of hearing is available to both Indigenous and non-Indigenous offenders.
| Year | Indigenous Offenders | Non-Indigenous Offenders | All Offenders | ||||||
|---|---|---|---|---|---|---|---|---|---|
| Total Hearings | With an Elder | Total Hearings | With an Elder | Total Hearings | With an Elder | ||||
| # | # | % | # | # | % | # | # | % | |
| 2011-12 | 1,285 | 431 | 33.5 | 4,594 | 37 | 0.8 | 5,879 | 468 | 8.0 |
| 2012-13 | 1,322 | 423 | 32.0 | 4,622 | 46 | 1.0 | 5,944 | 469 | 7.9 |
| 2013-14 | 940 | 347 | 36.9 | 3,647 | 29 | 0.8 | 4,587 | 376 | 8.2 |
| 2014-15 | 893 | 360 | 40.3 | 3,807 | 42 | 1.1 | 4,700 | 402 | 8.6 |
| 2015-16 | 968 | 371 | 38.3 | 3,942 | 30 | 0.8 | 4,910 | 401 | 8.2 |
| 2016-17 | 1,298 | 552 | 42.5 | 4,482 | 51 | 1.1 | 5,780 | 603 | 10.4 |
| 2017-18 | 1,552 | 633 | 40.8 | 4,833 | 41 | 0.8 | 6,385 | 674 | 10.6 |
| 2018-19 | 1,627 | 677 | 41.6 | 4,933 | 42 | 0.9 | 6,560 | 719 | 11.0 |
| 2019-20 | 1,594 | 701 | 44.0 | 4,538 | 39 | 0.9 | 6,132 | 740 | 12.1 |
| 2020-21 | 1,723 | 73 | 4.2 | 4,405 | 2 | <0.1 | 6,128 | 75 | 1.2 |
Table D5 Notes
Source: Parole Board of Canada.
The term Elder also refers to a Cultural Advisor as defined in section 11.1.1.5 of the Decision-Making Policy Manual.
The presence of an Elder is an alternative approach to the traditional parole hearing, and was introduced by the Parole Board of Canada to ensure that conditional release hearings are sensitive to Indigenous cultural values and traditions. This type of hearing is available to both Indigenous and non-Indigenous offenders.
Proportion of sentence served prior to being released on parole: 10-year trend
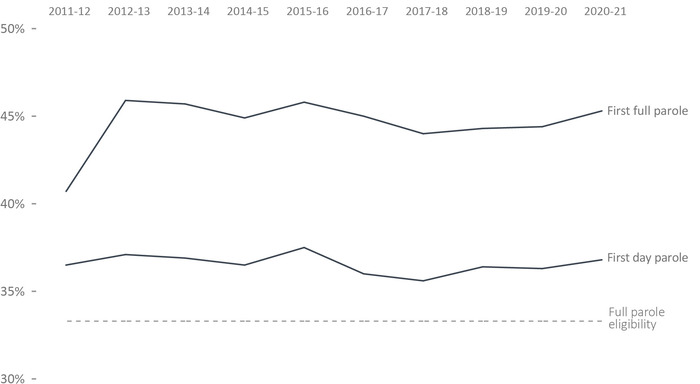
Image description
Line graph showing the proportion of an offender's sentence that has been served in custody before their first federal parole, over a 10 year period, for first full parole and for first day parole. The image includes a dotted line between 30 and 35 percent to indicate when full parole eligibility begins. Full parole was granted after just over 40 percent of a sentence was served in fiscal year 2011 to 12, increasing quickly to over 45 percent in 2012 to 13, declining very slightly over time until in fiscal year 2020 to 21 to reach about 45 percent of a sentence being completed before a first full parole. In contrast, a smaller percentage of a sentence is served before being granted a first day parole, where about 36 percent of a sentence is served before being granted first day parole, over the same ten year period. Full data are available below.
Figure D6 Notes
Source: Parole Board of Canada.
- In 2020-21, the average proportion of sentence served before the first federal day parole release for offenders serving determinate sentences remained stable (36.8%; +0.5%) from the previous year.
- The proportion of sentences served prior to the first federal full parole release for offenders serving determinate sentences remained stable (45.3%; +0.9%) in 2020-21 when compared to the previous year.
- In 2020-21, male offenders served a higher proportion of their sentences before being released on their first federal day parole and full parole (37.2%; 45.7%) than female offenders (33.4%; 42.2%).
- In 2020-21, the proportion of sentence served prior the first federal day parole release has been relatively stable for female and male offenders (-0.8 and +0.4 of a percentage point respectively) compared to 2011-12.
- In 2020-21, both female offenders and male offenders served an average of 2.3 and 4.9 percentage points more of their sentences before their first federal full parole release compared to 2011-12.
Full parole is a type of conditional release granted by the Parole Board of Canada in which the remainder of the sentence is served under supervision in the community. The Parole Board of Canada must review the cases of all offenders for full parole at the time prescribed by legislation, unless the offender advises the Parole Board of Canada in writing that he/she does not wish to be considered for full parole.
Day parole is a type of conditional release granted by the Parole Board of Canada in which offenders are permitted to participate in community-based activities in preparation for full parole or statutory release. The conditions require offenders to return nightly to an institution, half-way house, or other location deemed appropriate for managing their risk, unless otherwise authorized by the Parole Board of Canada. Not all offenders apply for day parole, and some apply more than once before being granted day parole.
Timing of parole in the sentence refers to the percentage of the sentence served at the time the first day parole or full parole starts during the sentence. In most cases a full parole is preceded by a day parole. These calculations are based on sentences under federal jurisdiction, excluding life sentences and indeterminate sentences. Offenders (other than those serving life or indeterminate sentences or subject to judicial determination) normally become eligible for full parole after serving 1/3 of their sentence or seven years, whichever is less. Eligibility for day parole is normally at six months before full parole eligibility. The increases in the average proportion of time served after 2010-11 are in part due to the effect of Bill C-59 and were driven primarily by offenders serving sentences for Schedule II and non-Schedule offences (some of whom were former APR-eligible offenders).
| Year | First Federal Day Parole | First Federal Full Parole | ||||
|---|---|---|---|---|---|---|
| Females | Males | Total | Females | Males | Total | |
| 2011-12 | 34.2 | 36.8 | 36.5 | 39.9 | 40.8 | 40.7 |
| 2012-13 | 37.8 | 37.0 | 37.1 | 44.9 | 46.0 | 45.9 |
| 2013-14 | 33.9 | 37.2 | 36.9 | 43.3 | 45.9 | 45.7 |
| 2014-15 | 34.3 | 36.8 | 36.5 | 43.8 | 45.0 | 44.9 |
| 2015-16 | 36.1 | 37.7 | 37.5 | 44.6 | 46.0 | 45.8 |
| 2016-17 | 32.5 | 36.5 | 36.0 | 42.9 | 45.3 | 45.0 |
| 2017-18 | 32.1 | 36.1 | 35.6 | 41.4 | 44.4 | 44.0 |
| 2018-19 | 31.7 | 37.0 | 36.4 | 41.1 | 44.7 | 44.3 |
| 2019-20 | 30.2 | 37.1 | 36.3 | 41.2 | 44.9 | 44.4 |
| 2020-21 | 33.4 | 37.2 | 36.8 | 42.2 | 45.7 | 45.3 |
Table D6 Notes
Source: Parole Board of Canada.
Full parole is a type of conditional release granted by the Parole Board of Canada in which the remainder of the sentence is served under supervision in the community. The Parole Board of Canada must review the cases of all offenders for full parole at the time prescribed by legislation, unless the offender advises the Parole Board of Canada in writing that he/she does not wish to be considered for full parole.
Day parole is a type of conditional release granted by the Parole Board of Canada in which offenders are permitted to participate in community-based activities in preparation for full parole or statutory release. The conditions require offenders to return nightly to an institution, half-way house, or other location deemed appropriate for managing their risk, unless otherwise authorized by the Parole Board of Canada. Not all offenders apply for day parole, and some apply more than once before being granted day parole.
Timing of parole in the sentence refers to the percentage of the sentence served at the time the first day parole or full parole starts during the sentence. In most cases a full parole is preceded by a day parole. These calculations are based on sentences under federal jurisdiction, excluding life sentences and indeterminate sentences. Offenders (other than those serving life or indeterminate sentences or subject to judicial determination) normally become eligible for full parole after serving 1/3 of their sentence or seven years, whichever is less. Eligibility for day parole is normally at six months before full parole eligibility. The increases in the average proportion of time served after 2010-11 are in part due to the effect of Bill C-59 and were driven primarily by offenders serving sentences for Schedule II and non-Schedule offences (some of whom were former APR-eligible offenders).
Proportion of sentence served prior to being released on parole by Indigenous and non-Indigenous: 10-year trend
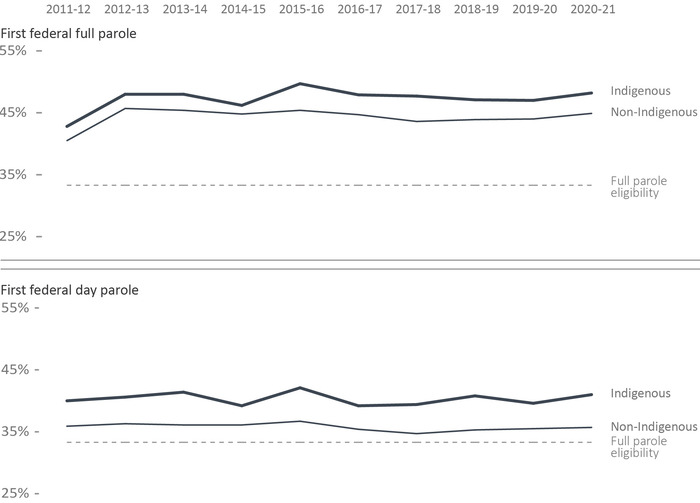
Image description
Two line graphs showing the proportion of offenders' sentences that are served in custody before their first federal parole, over a 10 year period, by Indigenous and non-Indigenous identity groups, and by day or full parole. In each chart, a line around 34 percent depicts the proportion of a sentence that must be served prior to being eligible for full parole. In both instances, Indigenous offenders serve more of their sentence than non-Indigenous offenders before being paroled. The difference is between one and three percent. Rates have been relatively steady for the entire 10 year period, with Indigenous offenders being granted their first federal full parole after serving just over 45 percent of their sentences and non-Indigenous offenders serving just under 45 percent of their sentences before being granted their first federal full parole. The situation is similar for the amount of a sentence that is served prior to being granted a first federal day parole, between fiscal year 2011 to 12 until fiscal year 2020 to 21, but here Indigenous offenders serve about 43 percent of their sentences before being granted their first federal day parole whereas non-Indigenous offenders are granted their first federal day parole after they have served just over 35 percent of their sentences. Full data are available below.
Figure D7 Notes
Source: Parole Board of Canada.
- In 2020-21, Indigenous offenders served higher proportions of their sentences before being released on their first federal day parole and full parole (41.0%; 48.2%), than non-Indigenous offenders (35.7%; 44.9%).
- In 2020-21, Indigenous offenders served an average of 1.0 percentage point more of their sentence before their first federal day parole release while the proportion has been relatively stable for non-Indigenous offenders (-0.2 of a percentage point) compared to 2011-12.
- In 2020-21, both Indigenous and non-Indigenous offenders served an average of 5.3 and 4.4 percentage points more of their sentences before their first federal full parole release compared to 2011-12.
Full parole is a type of conditional release granted by the Parole Board of Canada in which the remainder of the sentence is served under supervision in the community. The Parole Board of Canada must review the cases of all offenders for full parole at the time prescribed by legislation, unless the offender advises the Parole Board of Canada in writing that he/she does not wish to be considered for full parole.
Day parole is a type of conditional release granted by the Parole Board of Canada in which offenders are permitted to participate in community-based activities in preparation for full parole or statutory release. The conditions require offenders to return nightly to an institution, half-way house, or other location deemed appropriate for managing their risk, unless otherwise authorized by the Parole Board of Canada. Not all offenders apply for day parole, and some apply more than once before being granted day parole.
Timing of parole in the sentence refers to the percentage of the sentence served at the time the first day parole or full parole starts during the sentence. In most cases a full parole is preceded by a day parole. These calculations are based on sentences under federal jurisdiction, excluding life sentences and indeterminate sentences. Offenders (other than those serving life or indeterminate sentences or subject to judicial determination) normally become eligible for full parole after serving 1/3 of their sentence or seven years, whichever is less. Eligibility for day parole is normally at six months before full parole eligibility. The increases in the average proportion of time served after 2010-11 are in part due to the effect of Bill C-59 and were driven primarily by offenders serving sentences for Schedule II and non-Schedule offences (some of whom were former APR-eligible offenders).
| Year | First Federal Day Parole | First Federal Full Parole | ||||
|---|---|---|---|---|---|---|
| Indigenous | Non-Indigenous | Total | Indigenous | Non-Indigenous | Total | |
| 2011-12 | 40.0 | 35.9 | 36.5 | 42.8 | 40.5 | 40.7 |
| 2012-13 | 40.6 | 36.3 | 37.1 | 48.0 | 45.7 | 45.9 |
| 2013-14 | 41.4 | 36.1 | 36.9 | 48.0 | 45.4 | 45.7 |
| 2014-15 | 39.2 | 36.1 | 36.5 | 46.2 | 44.8 | 44.9 |
| 2015-16 | 42.1 | 36.7 | 37.5 | 49.7 | 45.4 | 45.8 |
| 2016-17 | 39.2 | 35.4 | 36.0 | 47.9 | 44.7 | 45.0 |
| 2017-18 | 39.4 | 34.7 | 35.6 | 47.7 | 43.6 | 44.0 |
| 2018-19 | 40.8 | 35.3 | 36.4 | 47.1 | 43.9 | 44.3 |
| 2019-20 | 39.6 | 35.5 | 36.3 | 47.0 | 44.0 | 44.4 |
| 2020-21 | 41.0 | 35.7 | 36.8 | 48.2 | 44.9 | 45.3 |
Table D7 Notes
Source: Parole Board of Canada.
Full parole is a type of conditional release granted by the Parole Board of Canada in which the remainder of the sentence is served under supervision in the community. The Parole Board of Canada must review the cases of all offenders for full parole at the time prescribed by legislation, unless the offender advises the Parole Board of Canada in writing that he/she does not wish to be considered for full parole.
Day parole is a type of conditional release granted by the Parole Board of Canada in which offenders are permitted to participate in community-based activities in preparation for full parole or statutory release. The conditions require offenders to return nightly to an institution, half-way house, or other location deemed appropriate for managing their risk, unless otherwise authorized by the Parole Board of Canada. Not all offenders apply for day parole, and some apply more than once before being granted day parole.
Timing of parole in the sentence refers to the percentage of the sentence served at the time the first day parole or full parole starts during the sentence. In most cases a full parole is preceded by a day parole. These calculations are based on sentences under federal jurisdiction, excluding life sentences and indeterminate sentences. Offenders (other than those serving life or indeterminate sentences or subject to judicial determination) normally become eligible for full parole after serving 1/3 of their sentence or seven years, whichever is less. Eligibility for day parole is normally at six months before full parole eligibility. The increases in the average proportion of time served after 2010-11 are in part due to the effect of Bill C-59 and were driven primarily by offenders serving sentences for Schedule II and non-Schedule offences (some of whom were former APR-eligible offenders).
Outcome of federal day parole supervision periods
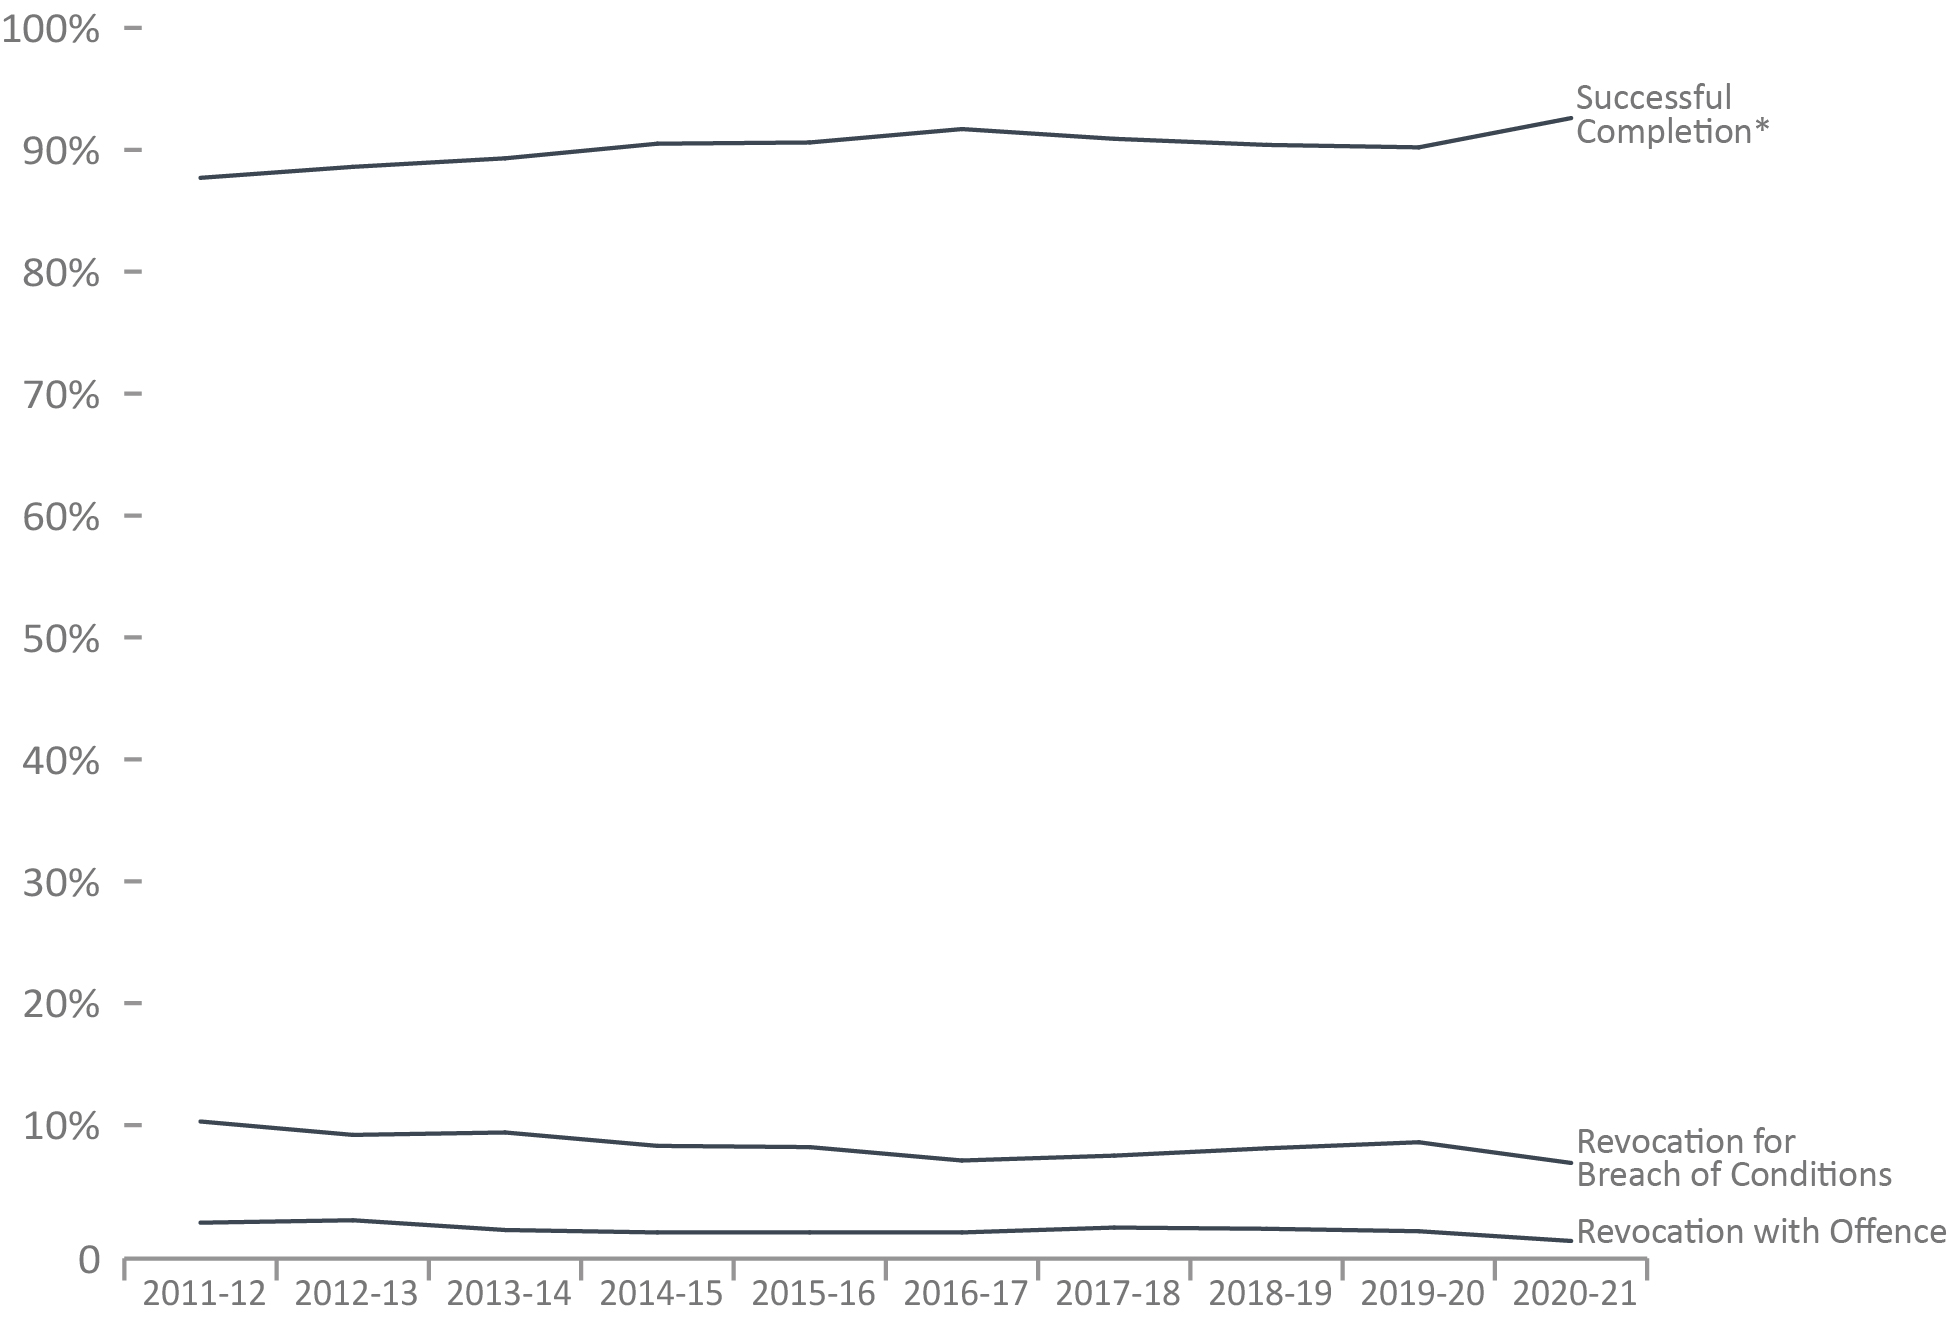
Image description
Line graph showing the outcome of federal day parole supervision periods from fiscal year 2011 to 12 until fiscal year 2020 to 21. Revocation with offence was the least common outcome, but with the most consistency, with less than 1.5 percent each year. The percentage of revocation for breach of conditions decreased from fiscal year 2011 to 12 until fiscal year 2016 to 17 where it was 7.1 percent. It then rose until its peak in fiscal year 2019 to 20, before dropping in fiscal year 2020 to 21 to 6.9 percent. Successful completion of federal parole rose steadily until fiscal year 2016 to 17 at 91.7 percent, then began to decrease until fiscal year 2019 to 20 at 90.2 percent, before rising to 92.6 percent for fiscal year 2020 to 21. Data are available below.
Figure D8 Notes
Source: Parole Board of Canada.
- In the last 10 years, the successful completionFootnote * rate of federal day parole supervision periods has been on average 90.4%.
- In 2020-21, the successful completionFootnote * rate of federal day parole supervision periods increased 2.4 percentage points to 92.6% compared to 2019-20.
- During the five-year period between 2016-17 and 2020-21, the successful completionFootnote * rate of federal regular day parole supervision periods was on average 5.1 percentage points lower than the rate of federal accelerated parole review (APR) day parole supervision periods (91.0% and 96.1%, respectively).
- The rate of violent reoffending of federal day parole supervision periods has been very low in the last five years, averaging 0.2%.
Revocation for breach of conditions includes revocation with outstanding charges.
Violent offences include murder and Schedule I offences (listed in the Corrections and Conditional Release Act) such as assaults, sexual offences, arson, abduction, robbery and some weapon offences.
| Federal Day Parole Outcomes | 2016-17 | 2017-18 | 2018-19 | 2019-20 | 2020-21 | |||||
|---|---|---|---|---|---|---|---|---|---|---|
| # | % | # | % | # | % | # | % | # | % | |
| Successful CompletionFootnote * | ||||||||||
Regular |
3,176 | 91.6 | 3,467 | 90.9 | 3,627 | 90.2 | 3,714 | 90.1 | 3,505 | 92.5 |
Accelerated |
86 | 97.7 | 84 | 93.3 | 75 | 98.7 | 57 | 91.9 | 44 | 100 |
Total |
3,262 | 91.7 | 3,551 | 90.9 | 3,702 | 90.4 | 3,771 | 90.2 | 3,549 | 92.6 |
| Revocation for Breach of Conditions | ||||||||||
Regular |
249 | 7.2 | 287 | 7.5 | 329 | 8.2 | 354 | 8.6 | 266 | 7.0 |
Accelerated |
2 | 2.3 | 6 | 6.7 | 1 | 1.3 | 4 | 6.5 | 0 | 0.0 |
Total |
251 | 7.1 | 293 | 7.5 | 330 | 8.1 | 358 | 8.6 | 266 | 6.9 |
| Revocation with Non-Violent Offence | ||||||||||
Regular |
37 | 1.1 | 55 | 1.4 | 55 | 1.4 | 45 | 1.1 | 14 | 0.4 |
Accelerated |
0 | 0.0 | 0 | 0.0 | 0 | 0.0 | 1 | 1.6 | 0 | 0.0 |
Total |
37 | 1.0 | 55 | 1.4 | 55 | 1.3 | 46 | 1.1 | 14 | 0.4 |
| Revocation with Violent Offence | ||||||||||
Regular |
7 | 0.2 | 7 | 0.2 | 8 | 0.2 | 8 | 0.2 | 4 | 0.1 |
Accelerated |
0 | 0.0 | 0 | 0.0 | 0 | 0.0 | 0 | 0.0 | 0 | 0.0 |
Total |
7 | 0.2 | 7 | 0.2 | 8 | 0.2 | 8 | 0.2 | 4 | 0.1 |
| Total Regular | 3,469 | 97.5 | 3,816 | 97.7 | 4,019 | 98.1 | 4,121 | 98.5 | 3,789 | 98.9 |
| Total Accelerated | 88 | 2.5 | 90 | 2.3 | 76 | 1.9 | 62 | 1.5 | 44 | 1.1 |
| Total (Regular and Accelerated) | 3,557 | 100 | 3,906 | 100 | 4,095 | 100 | 4,183 | 100 | 3,833 | 100 |
Table D8 Notes
Source: Parole Board of Canada.
Revocation for breach of conditions includes revocation with outstanding charges.
Violent offences include murder and Schedule I offences (listed in the Corrections and Conditional Release Act) such as assaults, sexual offences, arson, abduction, robbery and some weapon offences.
Outcome of federal full parole supervision periods
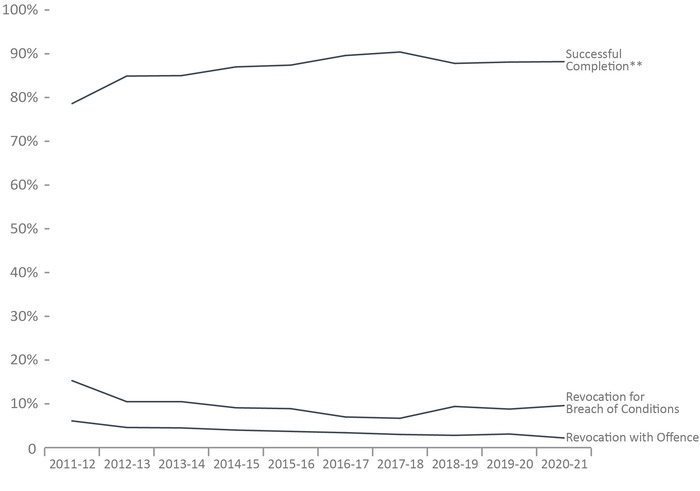
Image description
Line graph showing the outcome of federal full parole supervision periods from fiscal year 2011 to 12 until fiscal year 2020 to 21. Percentages of revocation with offence was the lowest percentage and most consistent trend generally decreasing from fiscal year 2011 to 12 until a slight increase in fiscal year 2019 to 20, prior to dropping further in fiscal year 2020 to 21, with each year at less than 5 percent. The percentage of revocation for breach of conditions decreased until fiscal year 2017 to 18 where it hit a low of 6.7 percent, prior to increasing in fiscal year 2018 to 19 to 9.4 percent, decreasing again to 8.8 in fiscal year 2019 to 20, then increasing once again in fiscal year 2020 to 21 to 9.6 percent. Finally, the successful completion of parole increased to its peak in fiscal year 2017 to 18 at 90.4 percent, prior to dropping briefly in fiscal year 2018 to 19 to 87.7 percent before rising to 88.2 percent in fiscal year 2020 to 21. Data are available below.
Figure D9 Notes
Source: Parole Board of Canada.
- In 2020-21, the successful completionFootnote ** rate of federal full parole supervision periods for offenders serving determinate sentences remained stable (88.2%; +0.2%) compared to 2019-20.
- During the five-year period (between 2016-17 and 2020-21), the successful completionFootnote ** rate of federal regular full parole supervision periods was on average 3.2 percentage points lower than the rate of federal accelerated parole review (APR) full parole supervision periods (88.4% and 91.6%, respectively).
- The rate of violent reoffending of federal full parole supervision periods has been relatively low in the last five years, averaging 0.5% (and ranged from 0.2% to 0.7%).
Revocation for breach of conditions includes revocation with outstanding charges.
Violent offences include murder and Schedule I offences (listed in the Corrections and Conditional Release Act) such as assaults, sexual offences, arson, abduction, robbery and some weapon offences.
| Federal Full Parole Outcomes | 2016-17 | 2017-18 | 2018-19 | 2019-20 | 2020-21 | |||||
|---|---|---|---|---|---|---|---|---|---|---|
| # | % | # | % | # | % | # | % | # | % | |
| Successful CompletionFootnote ** | ||||||||||
Regular |
848 | 89.7 | 968 | 90.6 | 1,064 | 87.0 | 1,173 | 87.8 | 1,172 | 87.8 |
Accelerated |
87 | 87.9 | 102 | 88.7 | 114 | 95.8 | 104 | 91.2 | 97 | 94.2 |
Total |
935 | 89.6 | 1,070 | 90.4 | 1,178 | 87.8 | 1,277 | 88.1 | 1,269 | 88.2 |
| Revocation for Breach of Conditions | ||||||||||
Regular |
64 | 6.8 | 71 | 6.6 | 122 | 10.0 | 121 | 9.1 | 133 | 10.0 |
Accelerated |
9 | 9.1 | 8 | 7.0 | 4 | 3.4 | 7 | 6.1 | 5 | 4.9 |
Total |
73 | 7.0 | 79 | 6.7 | 126 | 9.4 | 128 | 8.8 | 138 | 9.6 |
| Revocation with Non-Violent Offence | ||||||||||
Regular |
28 | 3.0 | 24 | 2.2 | 27 | 2.2 | 35 | 2.6 | 28 | 2.1 |
Accelerated |
2 | 2.0 | 5 | 4.3 | 1 | 0.8 | 1 | 0.9 | 0 | 0.0 |
Total |
30 | 2.9 | 29 | 2.4 | 28 | 2.1 | 36 | 2.5 | 28 | 1.9 |
| Revocation with Violent Offence | ||||||||||
Regular |
5 | 0.5 | 6 | 0.6 | 10 | 0.8 | 7 | 0.5 | 2 | 0.1 |
Accelerated |
1 | 1.0 | 0 | 0.0 | 0 | 0.0 | 2 | 1.8 | 1 | 1.0 |
Total |
6 | 0.6 | 6 | 0.5 | 10 | 0.7 | 9 | 0.6 | 3 | 0.2 |
| Total Regular | 945 | 90.5 | 1,069 | 90.3 | 1,223 | 91.1 | 1,336 | 92.1 | 1,335 | 92.8 |
| Total Accelerated | 99 | 9.5 | 115 | 9.7 | 119 | 8.9 | 114 | 7.9 | 103 | 7.2 |
| Total (Regular and Accelerated) | 1,044 | 100 | 1,184 | 100 | 1,342 | 100 | 1,450 | 100 | 1,438 | 100 |
Table D9 Notes
Source: Parole Board of Canada.
Revocation for breach of conditions includes revocation with outstanding charges.
Violent offences include murder and Schedule I offences (listed in the Corrections and Conditional Release Act) such as assaults, sexual offences, arson, abduction, robbery and some weapon offences.
Offenders released from federal institutions including Healing Lodges on statutory release: 10-year trend
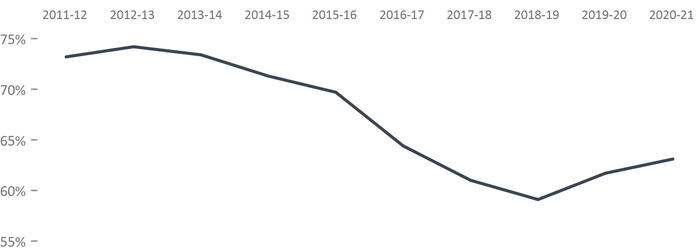
Image description
Line graph showing the percentage of offenders released from federal institutions including Healing Lodges on statutory release from fiscal year 2011 to 12 to fiscal year 2020 to 21. Rates rise from 73.2 percent in fiscal year 2011 to 12 until 74.2 percent in fiscal year 2012 to 13, then decreases steadily to 59.1 percent in fiscal year 2018 to 19, prior to increasing to 63.1 percent in fiscal year 2020 to 21. Full data are available below.
Figure D10 Notes
Source: Correctional Service of Canada.
- In fiscal year 2020-21, 63.1% of all releases from federal institutions were at statutory release.
- In fiscal year 2020-21, 75.8% of releases for Indigenous offenders were at statutory release compared to 57.1% of releases for Non-Indigenous offenders.
- Over the past ten years, the percentage of releases at statutory release decreased from 73.2% to 63.1%.
Statutory release refers to a conditional release that is subject to supervision after the offender has served two-thirds of the sentence.
The data includes all releases from a federal institution or Healing Lodge in a given fiscal year excluding offenders with quashed sentences, offenders who died in custody, long-term supervision order (LTSO) releases, offenders released at warrant expiry and offenders transferred to foreign countries. An offender may be released more than once during the reporting timeframe in cases where a previous release was subject to revocation, suspension, temporary detention, interruption or in cases where an offender served more than one sentence.
A fiscal year runs from April 1 to March 31 of the following year.
Figure D10 in the 2021 CCRSO corresponds to Figure D1 in the 2020 CCRSO.
| Year | Indigenous | Non-Indigenous | Total Offender Population | ||||||
|---|---|---|---|---|---|---|---|---|---|
| Statutory Release | Total Releases | %Footnote * | Statutory Release | Total Releases | %Footnote * | Statutory Release | Total Releases | %Footnote * | |
| 2011-12 | 1,489 | 1,792 | 83.1 | 3,812 | 5,448 | 70.0 | 5,301 | 7,240 | 73.2 |
| 2012-13 | 1,628 | 1,954 | 83.3 | 3,960 | 5,579 | 71.0 | 5,588 | 7,533 | 74.2 |
| 2013-14 | 1,731 | 2,037 | 85.0 | 3,905 | 5,644 | 69.2 | 5,636 | 7,681 | 73.4 |
| 2014-15 | 1,745 | 2,066 | 84.5 | 3,627 | 5,466 | 66.4 | 5,372 | 7,532 | 71.3 |
| 2015-16 | 1,682 | 2,038 | 82.5 | 3,626 | 5,578 | 65.0 | 5,308 | 7,616 | 69.7 |
| 2016-17 | 1,592 | 2,039 | 78.1 | 3,291 | 5,538 | 59.4 | 4,883 | 7,577 | 64.4 |
| 2017-18 | 1,540 | 2,065 | 74.6 | 2,880 | 5,186 | 55.5 | 4,420 | 7,251 | 61.0 |
| 2018-19 | 1,429 | 2,014 | 71.0 | 2,744 | 5,049 | 54.3 | 4,173 | 7,063 | 59.1 |
| 2019-20 | 1,626 | 2,167 | 75.0 | 2,731 | 4,897 | 55.8 | 4,357 | 7,064 | 61.7 |
| 2020-21 | 1,574 | 2,076 | 75.8 | 2,551 | 4,465 | 57.1 | 4,125 | 6,541 | 63.1 |
Table D10 Notes
Source: Correctional Service of Canada.
Statutory release refers to a conditional release that is subject to supervision after the offender has served two-thirds of the sentence.
The data includes all releases from a federal institution or Healing Lodge in a given fiscal year excluding offenders with quashed sentences, offenders who died in custody, long-term supervision order (LTSO) releases, offenders released at warrant expiry and offenders transferred to foreign countries. An offender may be released more than once during the reporting timeframe in cases where a previous release was subject to revocation, suspension, temporary detention, interruption or in cases where an offender served more than one sentence.
A fiscal year runs from April 1 to March 31 of the following year.
Table D10 in the 2021 CCRSO corresponds to Table D1 in the 2020 CCRSO.
Outcome of federal statutory release supervision periods
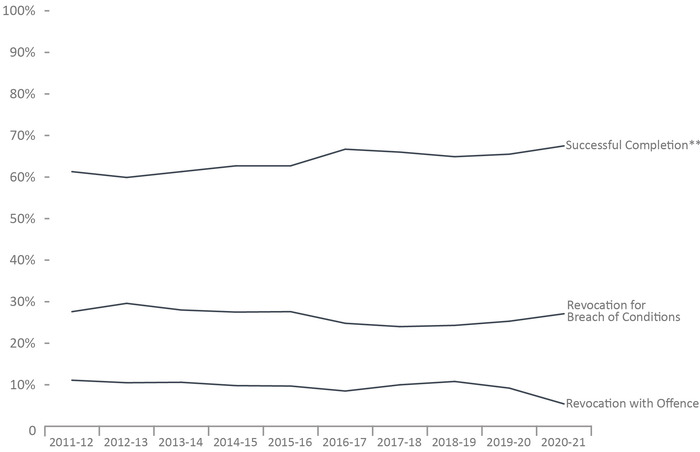
Image description
Line graph showing the outcomes of federal statutory release supervision periods from fiscal year 2011 to 12 until fiscal year 2020 to 21. Percentages of revocation with offense were the lowest, decreasing until fiscal year 2016 to 17 at 8.4 percent, prior to rising to its peak in fiscal year 2018 to 19 at 10.8 percent, then decreasing until reaching its lowest point in fiscal year 2020 to 21 at 5 percent. Percentages of revocation for breach of conditions rise slightly in fiscal year 2012 to 13 until fiscal year 2015 to 16 prior to dropping to its lowest point in fiscal year 2017 to 18 at 24 percent before rising to its peak in fiscal year 2020 to 21 at 27.1 percent. Lastly, the successful completion of parole rose overall until fiscal year 2016 to 17 at 66.7 percent, then decreased until fiscal year 2018 to 19 at 64.9 percent, until rising to 67.5 percent in fiscal year 2020 to 21. Data are available below.
Figure D11 Notes
Source: Parole Board of Canada.
- In 2020-21, the successful completionFootnote ** rate of statutory releaseFootnote * supervision periods increased 2.0 percentage points to 67.5% compared to 2019-20.
- Over the last five years, the revocation with violent offence rates were, on average, eight times higher for offenders on statutory releaseFootnote * than for offenders on federal day parole and three times higher than for offenders on federal full parole.
- The rate of revocation with a violent offence of statutory releaseFootnote * supervision periods was on average 1.4% in the last five years.
Revocation for breach of conditions includes revocation with outstanding charges.
Violent offences include murder and Schedule I offences (listed in the Corrections and Conditional Release Act) such as assaults, sexual offences, arson, abduction, robbery and some weapon offences.
An offender serving a determinate sentence, if he/she is not detained, will be subject to statutory release after serving 2/3 of his/her sentence if he/she is not on full parole at that time. On statutory release, an offender is subject to supervision until the end of his/her sentence.
Figure D11 in the 2021 CCRSO corresponds to Figure D10 in the 2020 CCRSO.
| Statutory Release Outcomes | 2016-17 | 2017-18 | 2018-19 | 2019-20 | 2020-21 | |||||
|---|---|---|---|---|---|---|---|---|---|---|
| # | % | # | % | # | % | # | % | # | % | |
| Successful CompletionFootnote ** | 3,773 | 66.7 | 3,558 | 66.0 | 3,293 | 64.9 | 3,400 | 65.5 | 3,328 | 67.5 |
| Revocation for Breach of Conditions | 1,405 | 24.8 | 1,291 | 24.0 | 1,232 | 24.3 | 1,316 | 25.3 | 1,335 | 27.1 |
| Revocation with Non-Violent Offence | 397 | 7.0 | 462 | 8.6 | 458 | 9.0 | 395 | 7.6 | 229 | 4.6 |
| Revocation with Violent Offence | 82 | 1.4 | 76 | 1.4 | 90 | 1.8 | 81 | 1.6 | 39 | 0.4 |
| Total | 5,657 | 100 | 5,387 | 100 | 5,073 | 100 | 5,192 | 100 | 4,931 | 100 |
Table D11 Notes
Source: Parole Board of Canada.
Revocation for breach of conditions includes revocation with outstanding charges.
Violent offences include murder and Schedule I offences (listed in the Corrections and Conditional Release Act) such as assaults, sexual offences, arson, abduction, robbery and some weapon offences.
An offender serving a determinate sentence, if he/she is not detained, will be subject to statutory release after serving 2/3 of his/her sentence if he/she is not on full parole at that time. On statutory release, an offender is subject to supervision until the end of his/her sentence.
Table D11 in the 2021 CCRSO corresponds to Table D10 in the 2020 CCRSO.
Rates of violent offence convictions for offenders on federal conditional release: 10-year trend
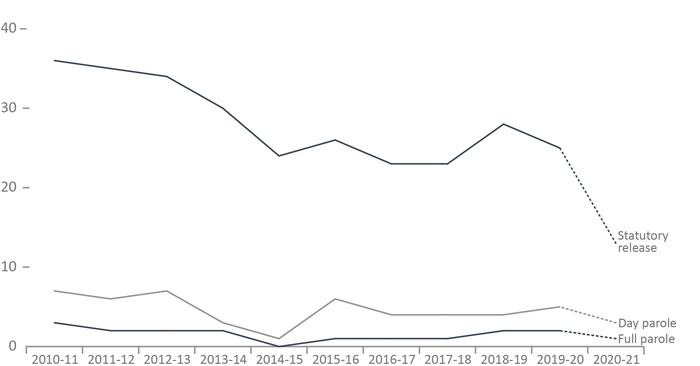
Image description
Line graph showing the rates of violent offence convictions for offenders on federal conditional release per 1,000 supervised offenders from fiscal year 2010 to 11 until fiscal year 2020 to 21. Full parole decreased from 4 in fiscal year 2010 to 11 to 1 in fiscal year 2014 to 15, before increasing to 3 in fiscal year 2018 to 19, then decreasing back to 1 in fiscal year 2020 to 21. Day parole followed a similar trend, decreasing from 7 in fiscal year 2010 to 11 to 6 in fiscal year 2011 to 12, then rising to its peak of 7 again in fiscal year 2012 to 13 before dropping to 1 in fiscal year 2014 to 15. The rates then increased to 6 in fiscal year 2015 to 16, dropped to 4 in fiscal year 2016 to 17, remaining there until fiscal year 2019 to 20 where it rose to 5, then dropped to 3 in fiscal year 2020 to 21. Statutory release decreased from 36 in fiscal year 2010 to 11 to 24 in fiscal year 2014 to 15, before briefly rising to 26 in fiscal year 2015 to 16. Rates then dropped to 23 for fiscal year 2016 to 17 until fiscal year 2017 to 18 before rising to 28 in fiscal year 2018 to 19 then dropping to 13 in fiscal year 2020 to 21. Full data are available below.
Figure D12 Notes
Source: Parole Board of Canada.
- During the ten-year period between 2010-11 and 2019-20, the number of convictions for a violent offence for offenders on federal conditional release decreased 29% (from 139 in 2010-11 to 98 in 2019-20). Day parolees averaged 7 convictions for violent offences annually, full parolees averaged 10 convictions for violent offences annually compared to 97 by offenders on statutory release.
- During the ten-year period between 2010-11 and 2019-20, convictions for violent offences on statutory release accounted for 85% of all convictions by offenders on federal conditional release.
- When comparing the rates of conviction for violent offences per 1,000 supervised offenders (between 2010-11 and 2019-20), offenders on statutory release were 11.9 times more likely to commit a violent offence during their supervision periods than offenders on full parole, and 5.9 times more likely to commit a violent offence than offenders on day parole.
Violent offences include murder and Schedule I offences (listed in the Corrections and Conditional Release Act) such as assaults, sexual offences, arson, abduction, robbery and some weapon offences.
Supervised offenders include offenders who are on parole and statutory release, those temporarily detained in federal institutions, and those who are deported or extradited.
Statutory release refers to a conditional release that is subject to supervision after the offender has served two-thirds of the sentence.
Day and full parole include those offenders serving determinate and indeterminate sentences.
The dotted line between 2019-20 and 2020-21 is intended to signify that due to delays in the court process, these numbers under-represent the actual number of convictions, as verdicts may not have been reached by year-end.
Figure D12 in the 2021 CCRSO corresponds to Figure D11 in the 2020 CCRSO.
| Year | # of Convictions for Violent Offences | Rates per 1,000 Supervised Offenders | |||||
|---|---|---|---|---|---|---|---|
| Day Parole | Full Parole | Statutory Release | Total | Day Parole | Full Parole | Statutory Release | |
| 2010-11 | 8 | 17 | 114 | 139 | 7 | 4 | 36 |
| 2011-12 | 7 | 10 | 120 | 137 | 6 | 3 | 35 |
| 2012-13 | 9 | 10 | 119 | 138 | 7 | 3 | 34 |
| 2013-14 | 4 | 8 | 106 | 118 | 3 | 2 | 30 |
| 2014-15 | 1 | 4 | 86 | 91 | 1 | 1 | 24 |
| 2015-16 | 9 | 7 | 93 | 109 | 6 | 2 | 26 |
| 2016-17 | 7 | 8 | 82 | 97 | 4 | 2 | 23 |
| 2017-18 | 7 | 8 | 76 | 91 | 4 | 2 | 23 |
| 2018-19 | 8 | 15 | 90 | 113 | 4 | 3 | 28 |
| 2019-20 | 8 | 9 | 81 | 98 | 5 | 2 | 25 |
| 2020-21 | 4 | 4 | 39 | 47 | 3 | 1 | 13 |
Table D12 Notes
Source: Parole Board of Canada.
Violent offences include murder and Schedule I offences (listed in the Corrections and Conditional Release Act) such as assaults, sexual offences, arson, abduction, robbery and some weapon offences.
Supervised offenders include offenders who are on parole and statutory release, those temporarily detained in federal institutions, and those who are deported or extradited.
Statutory release refers to a conditional release that is subject to supervision after the offender has served two-thirds of the sentence.
Day and full parole include those offenders serving determinate and indeterminate sentences.
Table D12 in the 2021 CCRSO corresponds to Table D11 in the 2020 CCRSO.
Section E: Special Applications of Criminal Justice
Number of initial detention reviews: 10-year trend
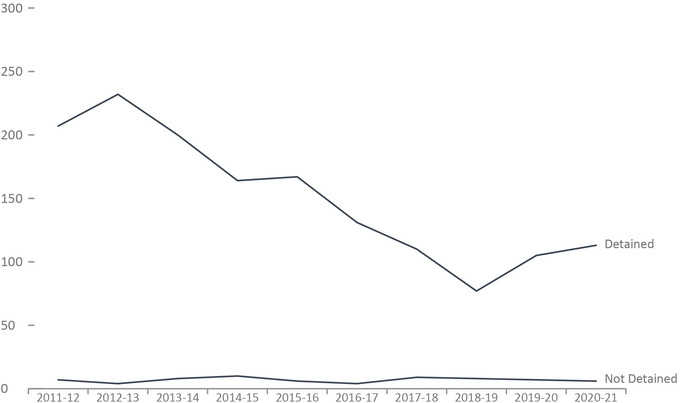
Image description
Line graph describing the number of initial detention reviews over a ten year period. Starting in fiscal year 2011-2012 initial detention reviews resulted in just over 200 referred people being detained, declining year-over-year until fiscal year 2019-2020 when less than 100 people were detained, rising again until 2020-2021 when over 100 people were detained. In comparison, the number of people who are not detained after an initial detention review is relatively stable over the same time period, ranging between roughly 10 and 1. Full data are available below.
Figure E1 Notes
Source: Parole Board of Canada.
- In 2020-21, the number of referrals for detention increased to 119 (from 112) when compared to 2019-20.
- The proportion of Indigenous offenders detained as a result of an initial detention review increased 4.2 percentage points to 96.6% while the proportion of non-Indigenous offenders detained as a result of an initial detention review decreased 1.6 percentage point to 93.3% compared to the previous year.
- In 2020-21, Indigenous offenders accounted for 31.5% of federal incarcerated offenders serving determinate sentences while they accounted for 49.6% of offenders referred for detention.
According to the Corrections and Conditional Release Act, an offender entitled to statutory release after serving two-thirds of the sentence may be held in custody until warrant expiry if it is established that the offender is likely to commit, before the expiry of his/her sentence, an offence causing death or serious harm, a serious drug offence or a sex offence involving a child.
| Year | Detained | Statutory Release | Total | Total | |||||||
|---|---|---|---|---|---|---|---|---|---|---|---|
| Ind. | Non-Ind. | Total | % | Ind. | Non-Ind. | Total | % | Ind. | Non-Ind. | ||
| 2011-12 | 89 | 118 | 207 | 96.7 | 3 | 4 | 7 | 3.3 | 92 | 122 | 214 |
| 2012-13 | 93 | 139 | 232 | 98.3 | 4 | 0 | 4 | 1.7 | 97 | 139 | 236 |
| 2013-14 | 88 | 112 | 200 | 96.2 | 4 | 4 | 8 | 3.8 | 92 | 116 | 208 |
| 2014-15 | 69 | 95 | 164 | 94.3 | 5 | 5 | 10 | 5.7 | 74 | 100 | 174 |
| 2015-16 | 75 | 92 | 167 | 96.5 | 2 | 4 | 6 | 3.5 | 77 | 96 | 173 |
| 2016-17 | 55 | 76 | 131 | 97.0 | 2 | 2 | 4 | 3.0 | 57 | 78 | 135 |
| 2017-18 | 51 | 59 | 110 | 92.4 | 5 | 4 | 9 | 7.6 | 56 | 63 | 119 |
| 2018-19 | 38 | 39 | 77 | 90.6 | 5 | 3 | 8 | 9.4 | 43 | 42 | 85 |
| 2019-20 | 49 | 56 | 105 | 93.8 | 4 | 3 | 7 | 6.3 | 53 | 59 | 112 |
| 2020-21 | 57 | 56 | 113 | 95.0 | 2 | 4 | 6 | 5.0 | 59 | 60 | 119 |
| Total | 664 | 842 | 1,506 | 95.6 | 36 | 33 | 69 | 4.4 | 700 | 875 | 1,575 |
Table E1 Notes
Source: Parole Board of Canada.
According to the Corrections and Conditional Release Act, an offender entitled to statutory release after serving two-thirds of the sentence may be held in custody until warrant expiry if it is established that the offender is likely to commit, before the expiry of his/her sentence, an offence causing death or serious harm, a serious drug offence or a sex offence involving a child.
Annual judicial review hearings
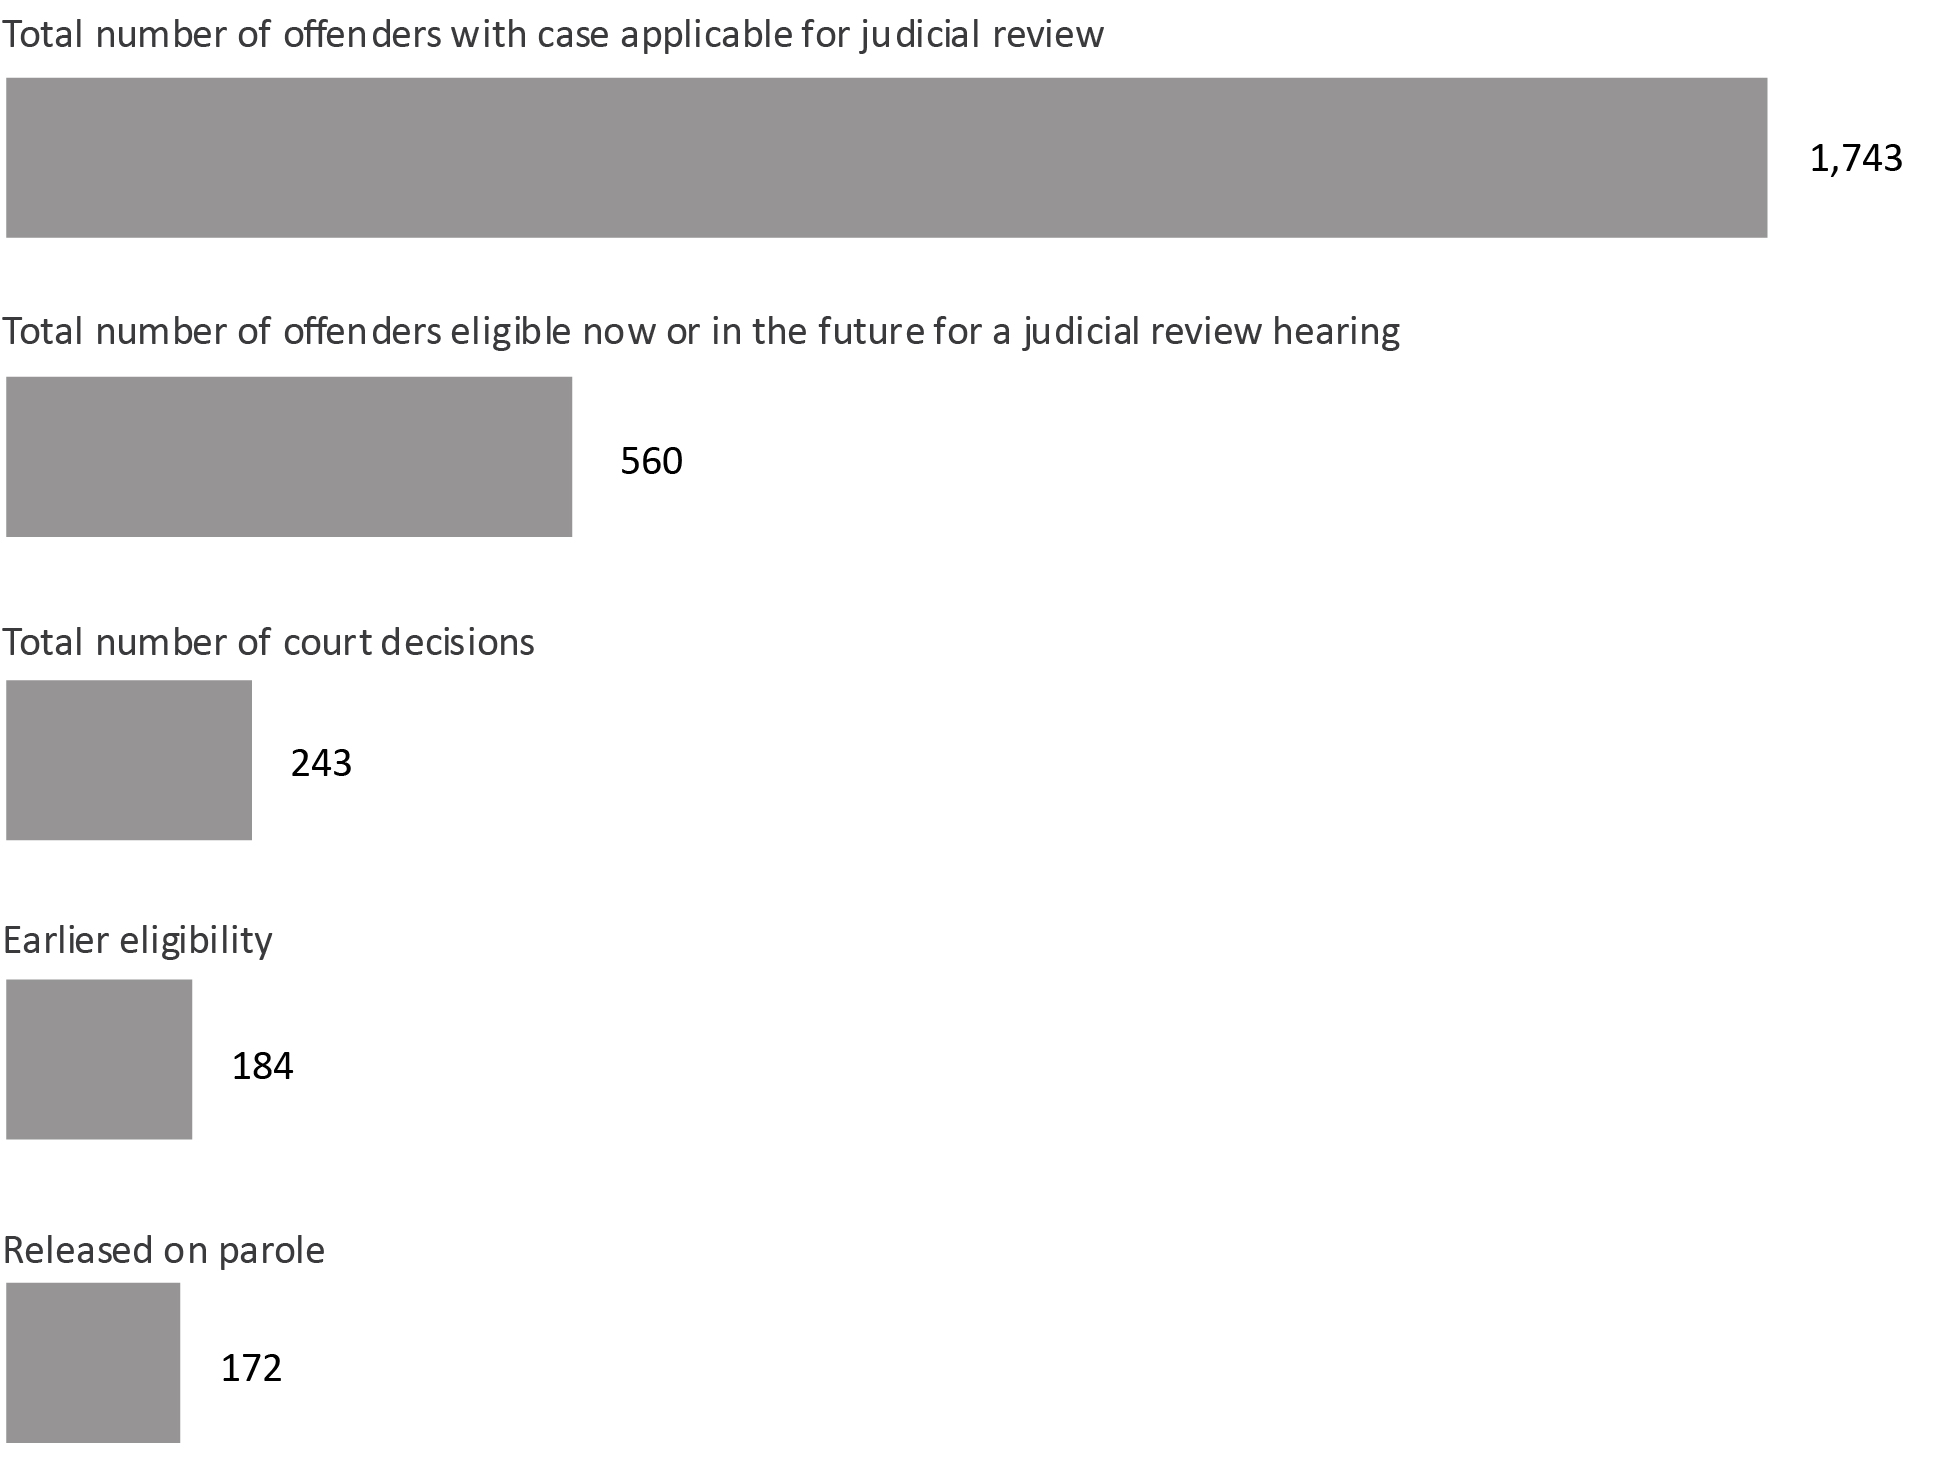
Image description
Bar chart itemizing the outcomes of annual judicial review hearings for the fiscal year 2020-2021. The total number of offenders with cases applicable for judicial review was 1,743. The total number of offenders eligible at this time or in the future for a judicial review hearing was 560. the total number of court decisions was 243. There were 184 decisions of earlier eligibility and 172 people were released on parole. Full data are available below.
Figure E2 Notes
Source: Correctional Service of Canada.
- Since the first judicial review hearing in 1987, there have been a total of 243 court decisions.
- Of these cases, 75.7% of the court decisions resulted in a reduction of the period that must be served before parole eligibility.
- Of the 560 offenders eligible to apply for a judicial review, 272 have already served 15 years of their sentence, whereas 288 have not.
- Of the 184 offenders who had their parole eligibility date moved closer, 179 had reached their revised Day Parole eligibility date. Of these offenders, 172 were released on parole, and 117 were being actively supervised in the community.Footnote *
- A higher percentage of second degree (84.6%) than first degree (74.7%) murder cases have resulted in a reduction of the period required to be served before parole eligibility.
Judicial review is an application to the court for a reduction in the time required to be served before being eligible for parole. Judicial review procedures apply to offenders who have been sentenced to imprisonment for life without eligibility for parole until more than fifteen years of their sentence has been served. Offenders can apply when they have served at least 15 years of their sentence. Judicial reviews are conducted in the province where the conviction took place.
| Province/Territory of Judicial Review | Parole Ineligibility Reduced by Court | Reduction Denied by Court | Total | |||
|---|---|---|---|---|---|---|
| 1st Degree Murder | 2nd Degree Murder | 1st Degree Murder | 2nd Degree Murder | 1st Degree Murder | 2nd Degree Murder | |
| Northwest Territories | 0 | 0 | 0 | 0 | 0 | 0 |
| Nunavut | 0 | 0 | 0 | 0 | 0 | 0 |
| Yukon Territories | 0 | 0 | 0 | 0 | 0 | 0 |
| Newfoundland & Labrador | 0 | 0 | 0 | 0 | 0 | 0 |
| Prince Edward Island | 0 | 0 | 0 | 0 | 0 | 0 |
| Nova Scotia | 1 | 1 | 1 | 0 | 2 | 1 |
| New Brunswick | 1 | 0 | 0 | 0 | 1 | 0 |
| Quebec | 77 | 16 | 6 | 2 | 83 | 18 |
| Ontario | 23 | 0 | 29 | 1 | 52 | 1 |
| Manitoba | 7 | 4 | 1 | 0 | 8 | 4 |
| Saskatchewan | 7 | 0 | 3 | 0 | 10 | 0 |
| Alberta | 19 | 0 | 8 | 1 | 27 | 1 |
| British Columbia | 27 | 1 | 7 | 0 | 34 | 1 |
| Sub-total | 162 | 22 | 55 | 4 | 217 | 26 |
| Total | 184 | 59 | 243 | |||
Table E2 Notes
Source: Correctional Service of Canada.
Judicial review is an application to the court for a reduction in the time required to be served before being eligible for parole. Judicial review procedures apply to offenders who have been sentenced to imprisonment for life without eligibility for parole until more than fifteen years of their sentence has been served. Offenders can apply when they have served at least 15 years of their sentence. Judicial reviews are conducted in the province where the conviction took place.
Number of Dangerous Offender designations

Image description
Line graph depicting the number of persons designated as Dangerous Offenders each fiscal year in Canada. The number of dangerous offender designations increased slowly and unevenly from less than 10 designations a year in 1978-1979 to approximately 20 a year in the mid-1990s, after this period the number of designations remained relatively stable until numbers start to increase more rapidly from 2005-2006 until a peak of approximately 60 designations a year in 2018-2019, with the number of designations falling very quickly to just over 30 in fiscal year 2020-2021. Full data by province, distinguishing between indeterminate and determinate offenders, is provided below.
Figure E3 Notes
Source: Correctional Service of Canada.
- At the end of fiscal year 2020-21, there have been 1,047 offenders designated as Dangerous Offenders (DOs) since 1978.
- At the end of fiscal year 2020-21 there were 880 DOs under the responsibility of Correctional Service Canada, and of those, 76.6% had indeterminate sentences.
- Of these 880 DOs, 729 were in custody (representing 5.9% of the total in-custody population) and 151 were in the community under supervision. There were eight female offenders with a Dangerous Offender designation. Indigenous offenders accounted for 36.3% of DOs and 27.0% of the total offender population.
Determinate sentence for Dangerous Offenders (DOs) must be a minimum punishment of imprisonment for a term of two years — and have an order that the offender be subject to long-term supervision for a period that does not exceed 10 years.
The number of DOs designated per year does not include overturned decisions.
Offenders who have died since receiving designations are no longer classified as active; however, they are still represented in the above graph, which depicts the total number of offenders ‘designated’.
The percentage of DOs who had at least one current conviction for a sexual offence is not available.
Dangerous Offender legislation came into effect in Canada on October 15, 1977, replacing the Habitual Offender and Dangerous Sexual Offender provisions that were abolished. A DO is an individual given an indeterminate or a determinate sentence on the basis of a particularly violent crime or pattern of serious violent offences where it is judged that the offender’s behaviour is unlikely to be inhibited by normal standards of behavioural restraint (see section 753 of the Criminal Code of Canada).
In addition to the DOs, there were 10 Dangerous Sexual Offenders and 2 offenders with an Habitual Offender designation under the responsibility of Correctional Service Canada at the end of fiscal 2020-2021.
| Province/Territory of Designation | All Designations (Designated Since 1978) | Active Dangerous Offenders | ||
|---|---|---|---|---|
| # of Indeterminate Offenders | # of Determinate Offenders | Total | ||
| Newfoundland & Labrador | 14 | 8 | 2 | 10 |
| Nova Scotia | 27 | 17 | 3 | 20 |
| Prince Edward Island | 0 | 0 | 0 | 0 |
| New Brunswick | 8 | 4 | 0 | 4 |
| Quebec | 137 | 92 | 27 | 119 |
| Ontario | 455 | 285 | 99 | 384 |
| Manitoba | 32 | 26 | 4 | 30 |
| Saskatchewan | 107 | 60 | 35 | 95 |
| Alberta | 76 | 54 | 9 | 63 |
| British Columbia | 171 | 116 | 21 | 137 |
| Yukon Territories | 6 | 1 | 3 | 4 |
| Northwest Territories | 11 | 10 | 1 | 11 |
| Nunavut | 3 | 1 | 2 | 3 |
| Total | 1,047 | 674 | 206 | 880 |
Table E3 Notes
Source: Correctional Service of Canada.
Determinate sentence for Dangerous Offenders (DOs) must be a minimum punishment of imprisonment for a term of two years — and have an order that the offender be subject to long-term supervision for a period that does not exceed 10 years.
The number of DOs designated per year does not include overturned decisions.
Offenders who have died since receiving designations are no longer classified as active; however, they are still represented in the above graph, which depicts the total number of offenders ‘designated’.
The percentage of DOs who had at least one current conviction for a sexual offence is not available.
Dangerous Offender legislation came into effect in Canada on October 15, 1977, replacing the Habitual Offender and Dangerous Sexual Offender provisions that were abolished. A DO is an individual given an indeterminate or a determinate sentence on the basis of a particularly violent crime or pattern of serious violent offences where it is judged that the offender’s behaviour is unlikely to be inhibited by normal standards of behavioural restraint (see section 753 of the Criminal Code of Canada).
In addition to the DOs, there were 10 Dangerous Sexual Offenders and 2 offenders with an Habitual Offender designation under the responsibility of Correctional Service Canada at the end of fiscal 2020-2021.
Number of long-term supervision orders imposed

Image description
Bar graph of the number of long-term supervision orders that were imposed during the fiscal year 2020-2021, by length of supervision order imposed. There was one long-term supervision order of one year, three of two years, and then we see a small jump to 13 long-term supervision order of three years, and 15 supervision orders of four years. Supervision orders that were between 5 years and 8 years were similar and ranged from 58 to 152. There were 152 long-term supervision orders of five years, 58 orders of 6 years, 98 of 7 years, and 76 orders of 8 years. By far, the largest number of long-term supervision orders were for a 10 year period, of which there were 1,043. Full data are available below.
Figure E4 Notes
Source: Correctional Service of Canada.
- At the end of fiscal year 2020-21, the courts had imposed 1,464 long term supervision orders. Of these, 71.2% were for a period of 10 years.
- At the end of fiscal year 2020-21, there were 951 offenders with long-term supervision orders under the responsibility of Correctional Service Canada. There were 15 female with long-term supervision orders under the responsibility of Correctional Service Canada.
- There were 488 offenders being supervised in the community on their long-term supervision order at the end of the fiscal year 2020-21. Of these, 430 offenders were supervised in the community, 14 offenders were temporarily detained, 39 offenders were on remand and 5 offenders were unlawfully at large for less than 90 days.
Long-Term Supervision Order (LTSO) legislation, which came into effect in Canada on August 1, 1997, allows the court to impose a sentence of two years or more for the predicate offence and order that the offender be supervised in the community for a further period not exceeding 10 years.
One hundred nine offenders under these provisions have died, and 330 offenders have completed their long term supervision period.
The percentage of long term supervision orders who had at least one current conviction for a sexual offence is not available.
Remand is the temporary detention of a person while awaiting trial, sentencing or the commencement of a custodial disposition.
| Province or Territory of Order | Length of Supervision Order (Years) | Current Status 2020-21 | ||||||||||||||
|---|---|---|---|---|---|---|---|---|---|---|---|---|---|---|---|---|
| 1 | 2 | 3 | 4 | 5 | 6 | 7 | 8 | 9 | 10 | Total | Incarcerated | DP, FP or SR | LTSO period | LTSO interrupted | Total | |
| Sentencing Province | ||||||||||||||||
| Newfoundland & Labrador | 0 | 0 | 0 | 0 | 0 | 0 | 0 | 1 | 0 | 12 | 13 | 1 | 2 | 7 | 0 | 10 |
| Nova Scotia | 0 | 0 | 0 | 0 | 4 | 0 | 1 | 3 | 0 | 16 | 24 | 1 | 0 | 9 | 1 | 11 |
| Prince Edward Island | 0 | 0 | 0 | 0 | 1 | 0 | 0 | 0 | 0 | 1 | 2 | 0 | 0 | 0 | 0 | 0 |
| New Brunswick | 0 | 0 | 1 | 0 | 2 | 0 | 0 | 1 | 0 | 8 | 12 | 2 | 0 | 3 | 2 | 7 |
| Quebec | 1 | 2 | 9 | 5 | 83 | 22 | 48 | 20 | 2 | 318 | 510 | 123 | 27 | 160 | 41 | 351 |
| Ontario | 0 | 0 | 1 | 7 | 21 | 16 | 23 | 29 | 0 | 330 | 427 | 68 | 15 | 159 | 37 | 279 |
| Manitoba | 0 | 0 | 0 | 0 | 1 | 2 | 3 | 2 | 0 | 39 | 47 | 7 | 0 | 9 | 5 | 21 |
| Saskatchewan | 0 | 1 | 1 | 1 | 11 | 10 | 13 | 11 | 2 | 83 | 133 | 27 | 9 | 38 | 24 | 98 |
| Alberta | 0 | 0 | 1 | 0 | 9 | 1 | 1 | 1 | 0 | 76 | 89 | 14 | 3 | 25 | 7 | 49 |
| British Columbia | 0 | 0 | 0 | 2 | 14 | 4 | 6 | 7 | 0 | 133 | 166 | 29 | 4 | 56 | 6 | 95 |
| Yukon Territories | 0 | 0 | 0 | 0 | 2 | 0 | 3 | 0 | 1 | 18 | 24 | 4 | 0 | 15 | 0 | 19 |
| Northwest Territories | 0 | 0 | 0 | 0 | 2 | 1 | 0 | 0 | 0 | 4 | 7 | 2 | 0 | 1 | 1 | 4 |
| Nunavut | 0 | 0 | 0 | 0 | 2 | 2 | 0 | 1 | 0 | 5 | 10 | 1 | 0 | 6 | 0 | 7 |
| Total | 1 | 3 | 13 | 15 | 152 | 58 | 98 | 76 | 5 | 1,043 | 1,464 | 279 | 60 | 488 | 124 | 951 |
Table E4 Notes
Source: Correctional Service of Canada.
Long-Term Supervision Order (LTSO) legislation, which came into effect in Canada on August 1, 1997, allows the court to impose a sentence of two years or more for the predicate offence and order that the offender be supervised in the community for a further period not exceeding 10 years.
One hundred nine offenders under these provisions have died, and 330 offenders have completed their long-term supervision period.
The percentage of long-term supervision orders who had at least one current conviction for a sexual offence is not available.
This category includes offenders whose current status is either supervised on day parole (DP), full parole (FP) or statutory release (SR).
This category includes offenders convicted of a new offence while on the supervision portion of an LTSO. When this occurs, the LTSO supervision period is interrupted until the offender has served the new sentence to its warrant expiry date. At that time, the LTSO supervision period resumes where it left off. From the 124, 101 offenders were in custody, 20 were supervised in the community (18 on statutory release, one on day parole and one a long-term supervision order), two offenders were unlawfully at large for less than 90 days and one offender was on remand.
Number of record suspension and pardon applications received: 5-year trend
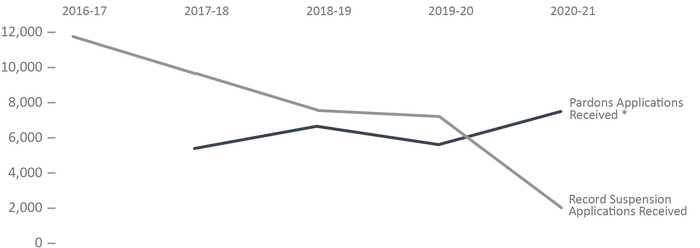
Image description
Line graph of the number of record suspension and pardons applications received over a period between fiscal year 2016-2017 and 2020-2021. From a high in 2016-2017, when nearly 12,000 record suspension applications were received, to a low in 2020-2021 of around 2,000 applications being received. Data reporting on pardons applications received starts in fiscal year 2017-2018 with around 5,000 applications received, slightly increasing the next year, and falling slightly the year after that, to end with about 7,000 pardons applications being received in 2020-2021. The number of pardons applications received out-stripped the number of record suspension applications received in the fiscal year 2019-2020. Full data are available below.
Figure E5 Notes
Source: Parole Board of Canada.
- In 2020-21, the Board received 1,830 record suspension applications and accepted 1,411 applications for processing. The Board also received 7,307 pardon applicationsFootnote * and accepted 6,032 applications for processing. The acceptance rate was 81.5%.
- In 2020-21, the Board rendered 7,535 pardon decisions, granting/issuing a pardon in 97.1% of cases and denying a pardon in 2.9% of cases.
- In 2020-21, the Board made 1,508 record suspension decisions; 93.1% of record suspensions were ordered and 6.9% were refused.
- Since 1970, when the pardon/record suspension process began, 554,332 pardons/record suspensions have been granted/issued and ordered.
On March 13, 2012, Bill C-10 amended the CRA by replacing the term pardon with the term record suspension. The Record Suspension and Clemency program involves the review of record suspension applications, the ordering of record suspensions and the making of clemency recommendations. The amendments to the CRA increased the waiting periods for a record suspension to five years for all summary convictions and to ten years for all indictable offences. Individuals convicted of sexual offences against minors (with certain exceptions) and those who have been convicted of more than three indictable offences, each with a sentence of two or more years, became ineligible for a record suspension.
| 2016-17 | 2017-18 | 2018-19 | 2019-20 | 2020-21 | |
|---|---|---|---|---|---|
| Record Suspension Applications Processed | |||||
| Received | 11,563 | 9,460 | 7,364 | 7,019 | 1,830 |
| Accepted | 8,153 | 6,502Footnote ** | 5,347 | 5,227 | 1,411 |
| % Accepted | 70.5 | 68.7 | 72.6 | 74.5 | 77.1 |
| Record Suspensions | |||||
| Ordered | 8,340 | 7,037 | 6,028 | 5,287 | 1,404 |
| Refused | 438 | 142 | 225 | 209 | 104 |
| Total Ordered/Refused | 8,778 | 7,179 | 6,253 | 5,496 | 1,508 |
| % Ordered | 95.0 | 98.0 | 96.4 | 96.2 | 93.1 |
| Pardon Applications Processed | |||||
| Received | NA | 5,202 | 6,463 | 5,422 | 7,307 |
| Accepted | NA | 4,366 | 5,184 | 4,360 | 6,032 |
| % Accepted | NA | 83.9 | 80.2 | 80.4 | 82.6 |
| Pardons | |||||
| Granted | 3,740 | 227 | 2,631 | 3,157 | 4,846 |
| Issued | NA | 1,730 | 1,772 | 1,552 | 2,469 |
| Denied | 125 | 133 | 42 | 210 | 220 |
| Total Granted/Issued/Denied | 3,865Footnote *** | 2,090Footnote **** | 4,445Footnote **** | 4,919Footnote **** | 7,535Footnote ***** |
| % Granted/Issued | 96.8 | 93.6 | 99.1 | 95.7 | 97.1 |
| Pardon/Record Suspension Revocations/Cessations | |||||
| RevocationsFootnote ***** | 501 | 85 | 59 | 410 | 316 |
| Cessations | 769 | 690 | 527 | 440 | 271 |
| Total Revocations/Cessations | 1,270 | 775 | 586 | 850 | 587 |
| Cumulative # Granted/Issued and OrderedFootnote ****** | 516,192 | 525,186 | 535,617 | 545,613 | 554,332 |
| Cumulative # Revocations/CessationsFootnote ****** | 25,908 | 26,683 | 27,269 | 28,119 | 28,706 |
Table E5 Notes
Source: Parole Board of Canada.
On March 13, 2012, Bill C-10 amended the CRA by replacing the term pardon with the term record suspension. The Record Suspension and Clemency program involves the review of record suspension applications, the ordering of record suspensions and the making of clemency recommendations. The amendments to the CRA increased the waiting periods for a record suspension to five years for all summary convictions and to ten years for all indictable offences. Individuals convicted of sexual offences against minors (with certain exceptions) and those who have been convicted of more than three indictable offences, each with a sentence of two or more years, became ineligible for a record suspension.
Section F: Federal Services to Registered Victims
Number of notifications to registered victims: 4-year trend

Image description
Line graph of the number of notifications that went to registered victims, over a four year period. In fiscal year 2017-2018 about 44,000 notifications went to registered victims, increasing in the next year to over 45,000, increasing further to over 50,000 notifications in fiscal year 2019-2020. The number of notifications to registered victims fell precipitously in fiscal year 2020-2021 when around 37,000 notifications were sent to registered victims. Full data are available below.
Figure F1 Notes
Source: Data Warehouse, Correctional Service of Canada.
- The number of contacts with registered victims for notifications increased by 15.8% from 2017-18 to 2019-20 (44,331 to 51,339) and then decreased by 24.7% from 2019-20 to 2020-21.
In order to register to receive information, a victim must meet the definition of a victim under the Corrections and Conditional Release Act (CCRA). Victims of federal offenders must be at least 18 years-old or legally emancipated or demonstrate they can act for themselves. Victims can register with the Correctional Service of Canada or the Parole Board of Canada.
Under the Corrections and Conditional Release Act (CCRA), a person can be a victim of a crime if: they are a spouse, conjugal partner, relative of, or person legally responsible for a victim who has died.
A notification contact is when the CSC Victim Services Unit sends information to victims. Examples include temporary absences, travel permits, and sentencing information of the offender.
Figure F1 in the 2021 CCRSO corresponds to Figure F12 in the 2020 CCRSO.
| Year | # |
|---|---|
| 2017-18 | 44,331 |
| 2018-19 | 46,000 |
| 2019-20 | 51,339 |
| 2020-21 | 38,660 |
Table F1 Notes
Source: Data Warehouse, Correctional Service of Canada.
In order to register to receive information, a victim must meet the definition of a victim under the Corrections and Conditional Release Act (CCRA). Victims of federal offenders must be at least 18 years-old or legally emancipated or demonstrate they can act for themselves. Victims can register with the Correctional Service of Canada or the Parole Board of Canada.
Under the Corrections and Conditional Release Act (CCRA), a person can be a victim of a crime if: they are a spouse, conjugal partner, relative of, or person legally responsible for a victim who has died.
A notification contact is when the CSC Victim Services Unit sends information to victims. Examples include temporary absences, travel permits, and sentencing information of the offender.
Table F1 in the 2021 CCRSO corresponds to Table F12 in the 2020 CCRSO.
Number of victim statements received for consideration in release decisions: 4-year trend
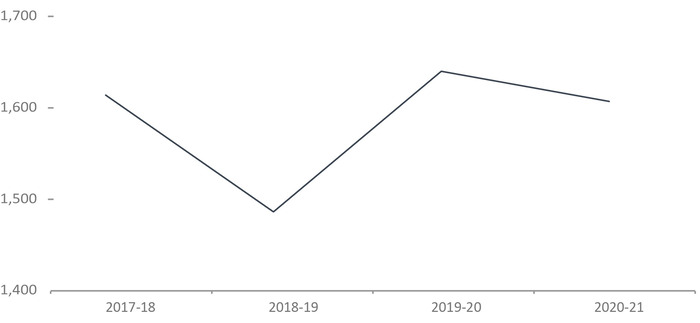
Image description
Line graph of the number of victim statements received for consideration in release decisions, over a four year period, staring in fiscal year 2017-2018. Over 1,600 victim statements were received in fiscal year 2017-2018, falling somewhat to under 1,500 in 2018-2019. However, the number of victims statements returns to the previous year's levels for the next two fiscal years where the number of victim statements received slightly decline from over 1,600 statements to around 1,600 victim statements being received in fiscal year 2020-2021. Full data are available below.
Figure F2 Notes
Source: Data Warehouse, Correctional Service of Canada.
- The number of victim statements received for consideration in 2020-21 is consistent with 2017-18. There was a slight dip in the number of statements in 2018-19.
The number of statements received for consideration in release decisions reflects the number of statements received. This is different than the number of victim statements considered when release decisions are made.
Figure F2 in the 2021 CCRSO corresponds to Figure F13 in the 2020 CCRSO.
| Year | # |
|---|---|
| 2017-18 | 1,614 |
| 2018-19 | 1,486 |
| 2019-20 | 1,640 |
| 2020-21 | 1,607 |
Table F2 Notes
Source: Data Warehouse, Correctional Service of Canada.
The number of statements received for consideration in release decisions reflects the number of statements received. This is different than the number of victim statements considered when release decisions are made.
Table F2 in the 2021 CCRSO corresponds to Table F13 in the 2020 CCRSO.
Requests for financial assistance to attend parole hearings: 5-year trend
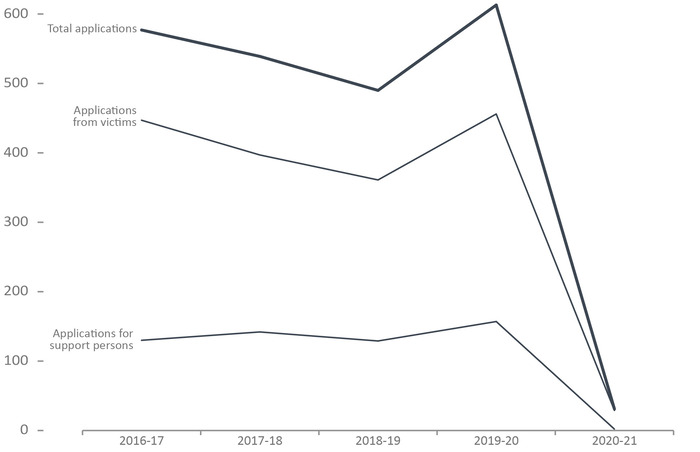
Image description
Line graph of the number of requests for financial assistance to attend parole hearings, over a five year period, for the number of applications made by victims and the number of applications made for the attendance of victim support persons, as well as the total number of applications overall. The trend in the number of total applications and applications for victims is shaped similarly because there are about three or four times more applications from victims as there are applications for support persons. Applications from victims falls from about 450 in fiscal year 2016-2017 to nearly 350 in 2018-2019. The number of requests from victims rose to over 400 in 2019-2020, with a very steep decline in requests in fiscal year 2020-2021 when the number of requests for financial assistance of this type was around 25. In comparison applications for support persons was relatively stable, at just over 100, for the fiscal years 2016-2017 until fiscal year 2019-2020, until falling off to zero applications in the fiscal year 2020-2021. Full data are available below.
Figure F3 Notes
Source: Justice Canada.
- The number of victim applications for financial assistance fluctuated between 2015-16 to 2019-20 and then had a sharp decline between 2019-20 to 2020-21. This decline was impacted by the COVID-19 related restrictions and limited access to CSC institutions began in mid-March 2020. To adapt to COVID-19, PBC hearings were conducted primarily by teleconference and/or video conference in 2020-21.
Victims can apply for financial assistance for a support person to accompany them to a parole hearing.
Figure F3 in the 2021 CCRSO corresponds to Figure F14 in the 2020 CCRSO.
| 2016-17 | 2017-18 | 2018-19 | 2019-20 | 2020-21 | |
|---|---|---|---|---|---|
| Number of applications for financial assistance received from victims | 447 | 397 | 361 | 456 | 29 |
| Number of applications for financial assistance received from support persons | 130 | 142 | 129 | 157 | 2 |
| Total number of applications | 577 | 539 | 490 | 613 | 31 |
Table F3 Notes
Source: Justice Canada.
Victims can apply for financial assistance for a support person to accompany them to a parole hearing.
Table F3 in the 2021 CCRSO corresponds to Table F14 in the 2020 CCRSO.
Number of Parole Board of Canada contacts with victims: 10-year trend
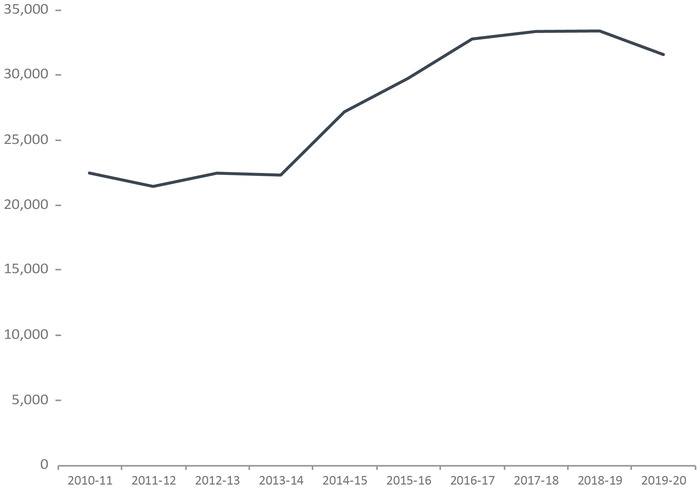
Image description
Line graph of the number of victims that are formally contacted by the Parole Board of Canada, over a 10 year period. Between fiscal year 2010-2011 and 2013-2014 the number of contacts was relatively stable at around 22,500 contacts with victims a year. The number of contacts rose from this level to crest at around 32,000 contacts with victims occurring each year between 2015-2016 and 2018-2019. In 2019-2020 the number of contacts declined slightly to closer to 30,000 contacts with victims a year. Full data are available below.
Figure F4 Notes
Source: Parole Board of Canada.
- In 2019-20Footnote *, the Parole Board of Canada (PBC) reported 31,587 contacts with victims, a decrease of 5.5% compared to the previous year.
- In the last 10 years, the number of PBC contacts with victims increased by 40.5% (9,104 more contacts).
A victim contact refers to each time the Parole Board of Canada has contact with a victim by mail, fax, or by telephone.
Figure F4 in the 2021 CCRSO corresponds to Figure F15 in the 2020 CCRSO.
| YearFootnote * | Total Number of Contacts |
|---|---|
| 2010-11 | 22,483 |
| 2011-12 | 21,449 |
| 2012-13 | 22,475 |
| 2013-14 | 22,323 |
| 2014-15 | 27,191 |
| 2015-16 | 29,771 |
| 2016-17 | 32,786 |
| 2017-18 | 33,370 |
| 2018-19 | 33,408 |
| 2019-20 | 31,587 |
Table F4 Notes
Source: Parole Board of Canada.
A victim contact refers to each time the Parole Board of Canada has contact with a victim by mail, fax, or by telephone.
Table F4 in the 2021 CCRSO corresponds to Table F15 in the 2020 CCRSO.
Victim presentations at PBC Hearings: 10-year trend

Image description
Line graph depicting the number of victim presentations and the number of hearings with victim presentations, over a ten year period. The two graphed lines follow roughly the same trend, at different frequencies. There are more victim presentations than there are hearings with victim presentations, as can be expected. There is a slight increase, from about 225 victim presentations in fiscal year 2011-2012 to a bit more than 250 in 2013-2014. After there is a drop to two years where the number of presentations was under 250 per year. The number of presentations greatly increased to around 325 presentations in 2016-2017. The number of presentations remained around 300 until the last year of available data, in 2020-2021. Hearings with victims presentations saw a gradual increase from just under 150 hearings a year in 2011-2012 to closer to 200 hearings a year in 2019-2020. Full data are available below.
Figure F5 Notes
Source: Parole Board of Canada.
- In 2020-21, victims made 291 presentations (a decrease of 8.8% or 28 fewer presentations) at 176 hearings (a decrease of 14.1% or 29 fewer hearings) compared to 2019-20.
- In the last 10 years, the number of presentations made by victims at hearings has been fluctuating. In 2020-21, this number increased by 30.5% (68 more presentations) compared to 2011-12.
- In 2020-2021, 94.8% of victim presentations at hearings were made by victims themselves. In 4.1% of these cases, victims presented their statement using other media and in 1.0% of hearings, a presentation was made on the victim’s behalf.
Figure F5 in the 2021 CCRSO corresponds to Figure F16 in the 2020 CCRSO.
| Year | Number of Hearings with Presentations | Number of Presentations |
|---|---|---|
| 2011-12 | 140 | 223 |
| 2012-13 | 140 | 254 |
| 2013-14 | 142 | 264 |
| 2014-15 | 128 | 231 |
| 2015-16 | 171 | 244 |
| 2016-17 | 149 | 244 |
| 2017-18 | 181 | 328 |
| 2018-19 | 167 | 288 |
| 2019-20 | 205 | 319 |
| 2020-21 | 176 | 291 |
Table F5 Notes
Source: Parole Board of Canada.
Table F5 in the 2021 CCRSO corresponds to Table F16 in the 2020 CCRSO.
Number of requests made by victims to access the PBC decision registry: 10-year trend
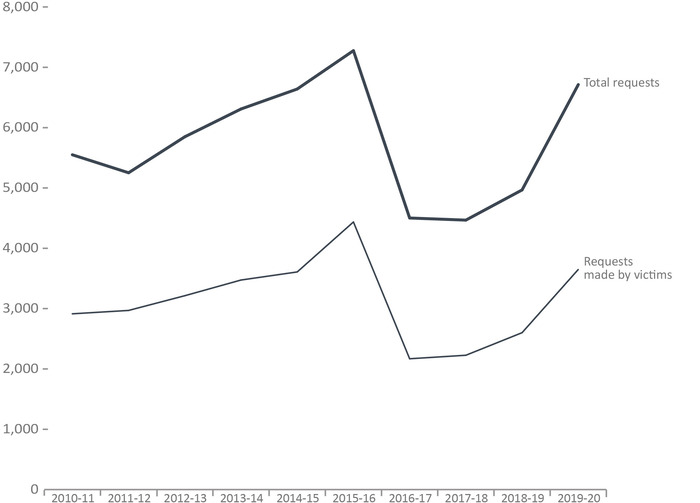
Image description
Line graph of the number of requests to access the decision registry and the number of requests made by victims to access the decision registry, for a 10 year period. The shape of the lines for total requests and for requests made by victims are very similar. The first year saw a small drop of total requests to just over 5,000 requests in fiscal year 2010-2011, after which there was an increase year-over-year until fiscal year 2015-2016 when there were more than 7,000 requests. The number of requests declined drastically in 2016-2017 and 2017-2018 to around 4,100 requests a year. From this point, the number of requests rose again to at least 6,500 requests in 2019-2020. Requests made by victims went from under 3,000 requests in 2010-2011 to a maximum of over 4,000 requests in 2015-2016, declining to a low of around 2,000 requests in 2016-2017, rising again to over 3,000 requests a year being made by victims in fiscal year 2019-2020. Full data are available below.
Figure F6 Notes
Source: Parole Board of Canada.
- In 2019-20, the number of requests to access the decision registry made by victims increased by 40.3% to 3,649 and the proportion of requests made by victims increased two percentage points to 54.4% compared to 2018-19.
The Corrections and Conditional Release Act (CCRA) requires the Parole Board of Canada (PBC) to maintain a decision registry that includes the decisions made and the reasons for those decisions. The purpose of the decision registry is to contribute to public understanding of conditional release decision making and to promote openness and accountability. Anyone may request a copy of these decisions.
Victims also include victims' agents and victims' organizations.
Figure F6 in the 2021 CCRSO corresponds to Figure F17 in the 2020 CCRSO. However, in the 2020 CCRSO, data on the number of requests are no longer reported and will be replaced by data on the number of decisions sent.
| Year | Requests made by victims | Total number of requests | |
|---|---|---|---|
| # | % | ||
| 2010-11 | 2,914 | 52.5 | 5,550 |
| 2011-12 | 2,970 | 56.5 | 5,252 |
| 2012-13 | 3,214 | 55.0 | 5,848 |
| 2013-14 | 3,474 | 55.1 | 6,309 |
| 2014-15 | 3,608 | 54.3 | 6,640 |
| 2015-16 | 4,436 | 61.0 | 7,276 |
| 2016-17 | 2,169 | 48.2 | 4,502 |
| 2017-18 | 2,227 | 49.9 | 4,467 |
| 2018-19 | 2,601 | 52.4 | 4,967 |
| 2019-20 | 3,649 | 54.4 | 6,713 |
Table F6 Notes
Source: Parole Board of Canada.
The Corrections and Conditional Release Act (CCRA) requires the Parole Board of Canada (PBC) to maintain a decision registry that includes the decisions made and the reasons for those decisions. The purpose of the decision registry is to contribute to public understanding of conditional release decision making and to promote openness and accountability. Anyone may request a copy of these decisions.
Victims also include victims' agents and victims' organizations.
Table F6 in the 2021 CCRSO corresponds to Table F17 in the 2020 CCRSO. However, In the 2020 CCRSO, data on the number of requests are no longer reported and will be replaced by data on the number of decisions sent.
Number of decisions sent from PBC decision registry
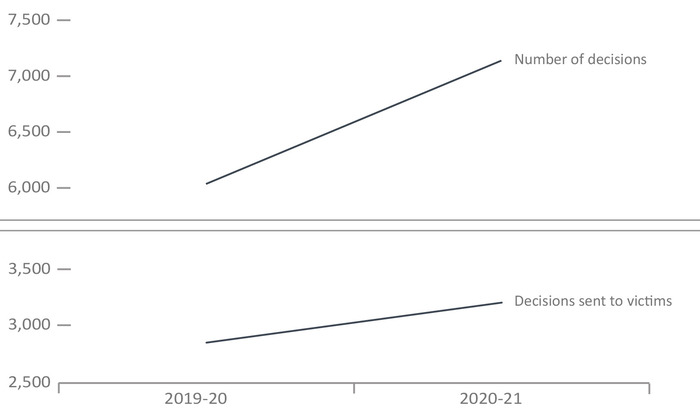
Image description
Line graph describing the total number of decisions sent from the Parole Board of Canada decision registry and the number of decisions sent to victims, over a two year period. The number of decisions increase in both categories from fiscal year 2019-2020 to 2020-2021. Decisions sent to victims rose from under 3,000 a year to over 3,000 a year, while the total number of decisions sent from the Parole Board of Canada decision register went from around 6,000 to over 7,000 during the same period. Full data are available below.
Figure F7 Notes
Source: Parole Board of Canada.
- In 2020-21, the number of decisions sent to victims from the registry increased by 12.4% to 3,242 while the proportion of decisions sent to victims decreased 2.3 percentage points to 45.2% compared to 2019-20.
The Corrections and Conditional Release Act (CCRA) requires the Parole Board of Canada (PBC) to maintain a decision registry that includes the decisions made and the reasons for those decisions. The purpose of the decision registry is to contribute to public understanding of conditional release decision making and to promote openness and accountability. Anyone may request a copy of these decisions.
Victims also include victims' agents and victims' organizations.
| Year | Decisions sent to victims | Total number of decisions sent | |
|---|---|---|---|
| # | % | ||
| 2019-20 | 2,884 | 47.5 | 6,076 |
| 2020-21 | 3,242 | 45.2 | 7,179 |
Table F7 Notes
Source: Parole Board of Canada.
Victims also include victims' agents and victims' organizations.
- Date modified: