2015 Corrections and Conditional Release Statistical Overview

Table of contents
- Preface
- Contributing Partners
- Section A: Context - Crime and the Criminal Justice System
- Police-reported crime rate has been decreasing since 1998
- Crime rates are higher in the west and highest in the north
- Canada's incarceration rate is high relative to most western European countries
- The rate of adults charged has declined
- Administration of justice cases account for 23% of cases in adult courts
- Most adult custodial sentences ordered by the court are short
- Relatively few crimes result in sentences to federal penitentiaries
- The rate of youth charged has declined over the past eight years
- The most common youth court case is theft
- The most common sentence for youth is probation
- Section B: Corrections Administration
- Expenditures on corrections increased in 2013-14
- CSC employees are concentrated in custody centres
- The cost of keeping an inmate incarcerated
- The number of Parole Board of Canada employees
- The number of employees in the Office of the Correctional Investigator
- Health care is the most common area of offender complaint received by the Office of the Correctional Investigator
- Section C: Offender Population
- Offenders under the responsibility of the Correctional Service Canada
- The number of offenders in custody in a CSC facility decreased in 2014-15
- The number of admissions to federal jurisdiction has fluctuated
- The number of women admitted from the courts to federal jurisdiction increased in 2014-15
- About half of total offender population in CSC facilities are serving a sentence of less than 5 years
- Offender age at admission to federal jurisdiction is increasing
- The average age at admission is lower for Aboriginal offenders than for non-Aboriginal offenders
- 24% of the in-custody offender population is aged 50 or over
- 60% of offenders are Caucasian
- The religious identification of the offender population is diverse
- The proportion of Aboriginal offenders in custody is higher than for non-Aboriginal offenders
- The majority of in-custody offenders are classified as medium security risk
- Admissions with a life or indeterminate sentence decreased in 2014-15
- Offenders with life or indeterminate sentences represent 23% of the total offender population
- 69% of offenders are serving a sentence for a violent offence
- The number of Aboriginal offenders has increased
- The total number of admissions to administrative segregation has fluctuated
- 67% of admissions to administrative segregation stay for less than 30 days
- The number of offender deaths while in custody has fluctuated
- The number of escapees was stable in 2014-15
- The population of offenders in the community under supervision has increased in the past two years
- Provincial/territorial community corrections population decreased in 2013-14
- The number of offenders on provincial parole increased in 2013-14
- Section D: Conditional Release
- The percentage of offenders released from federal penitentiaries at statutory release decreased in the past two years
- The percentage of offenders released from federal penitentiaries on day and full parole increased in the past two years
- The federal day and full parole grant rates increased in 2014-15
- The federal day parole grant rate for Aboriginal offenders increased in 2014-15
- Federal parole hearings involving an Aboriginal Cultural Advisor decreased
- Proportion of sentence served prior to being released on parole decreased
- Aboriginal offenders serve a higher proportion of their sentences before being released on parole
- The majority of federal day paroles are successfully completed
- The majority of federal full paroles are successfully completed
- Statutory releases have the lowest rates of successful completion
- Over the past decade, the rate of violent conviction for offenders while under supervision has declined
- The number of offenders granted temporary absences decreased in 2014-15
- Section E: Statistics on Special Applications of Criminal Justice
- The number of initial detention reviews decreased in 2014-15
- 77% of judicial review hearings result in earlier parole eligibility
- The number of dangerous offender designations
- Most long term supervision orders are for a 10-year period
- The number of record suspension applications received has decreased
- Section F: Victims of Crime
- Victimization rates for theft of personal property have decreased
- The majority of victims of violent crime are under 30
- The majority of victims receiving services are victims of violent crime
- The number of victims registered with the federal correctional system has increased
- Offences causing death is the most common type of offence that harmed the victims registered with Correctional Service Canada
- Temporary Absence information is the most common type of information provided during a notification to registered victims with Correctional Service Canada
- Parole Board of Canada contacts with victims have increased
Preface
This document provides a statistical overview of corrections and conditional release within a context of trends in crime and criminal justice. A primary consideration in producing this overview was to present general statistical information in a "user friendly" way that will facilitate understanding by a broad audience. Accordingly, there are a number of features of this document that make it different from typical statistical reports.
- First, the visual representation of the statistics is simple and uncluttered, and under each chart there are a few key points that will assist the reader in extracting the information from the chart.
- Second, for each chart there is a table of numbers corresponding to the visual representation. In some instances, the table includes additional numbers, e.g., a five-year series, even though the chart depicts the data for the most recent year (e.g., Figure A2).
- Third, rather than using the conventional headings for statistics (e.g., "Police-reported crime rate by year by type of crime") the titles for each chart and table inform the reader about the matter at hand (e.g., "Police-reported crime rate has decreased since 1998").
- Fourth, notes have been kept to a minimum, that is, only where they were judged to be essential for the reader to understand the statistics.
- Finally, the source of the statistics is indicated under each chart so that the interested reader can easily access more information if desired.
The Corrections and Conditional Release Statistical Overview (CCRSO) has been published annually since 1998. Readers are advised that in some instances figures have been revised from earlier publications. Also, the total number of offenders will vary slightly depending on characteristics of the data set.
It is hoped that this document will serve as a useful source of statistical information on corrections and conditional release and assist the public in gaining a better understanding of these important components of the criminal justice system.
Regarding police crime data from Statistics Canada, until the late 1980s, the Uniform Crime Reporting (UCR) survey provided aggregate counts of the number of incidents reported to police and the number of persons charged by type of offence. With the advent of microdata reporting, the UCR has become an "incident-based" survey (UCR2), collecting in-depth information about each criminal incident. The update to this new survey, as well as revisions to the definitions of Violent crime, Property crime, and Other Criminal Code offences has resulted in data only being available from 1998 to the present. It is worth noting that the Total Crime Rates presented in the CCRSO differ from those reported by Statistics Canada in their publications. The Total Crime Rate reported in the CCRSO includes offences (i.e., traffic offences in the Canadian Criminal Code and offences against federal statutes) that are excluded in rates published by Statistics Canada.
Contributing Partners
Public Safety Canada
Public Safety Canada is Canada's lead federal department for public safety, which includes emergency management, national security and community safety. Its many responsibilities include developing legislation and policies governing corrections, implementing innovative approaches to community justice, and providing research expertise and resources to the corrections community.
Correctional Service of Canada
The mandate of the Correctional Service of Canada, as set out in the Corrections and Conditional Release Act, is to contribute to the maintenance of a just, peaceful and safe society by carrying out sentences imposed by courts through the safe and humane custody and supervision of offenders with sentences of two years or more, and assisting in the rehabilitation of offenders and their reintegration into the community as law-abiding citizens through the provision of programs in penitentiaries and in the community.
Parole Board of Canada
The Parole Board of Canada is an independent administrative tribunal responsible for making decisions about the timing and conditions of release of offenders to the community on various forms of conditional release. The Board also makes pardon decisions and recommendations respecting clemency through the Royal Prerogative of Mercy.
Office of the Correctional Investigator
The Office of the Correctional Investigator is an ombudsman for federal offenders. It conducts investigations into the problems of offenders related to decisions, recommendations, acts or omissions of the Correctional Service of Canada that affect offenders individually or as a group.
Canadian Centre for Justice Statistics (Statistics Canada)
The Canadian Centre for Justice Statistics (CCJS) is a division of Statistics Canada. The CCJS is the focal point of a federal-provincial-territorial partnership, known as the National Justice Statistics Initiative, for the collection of information on the nature and extent of crime and the administration of civil and criminal justice in Canada.
Section A: Context – Crime and the Criminal Justice System
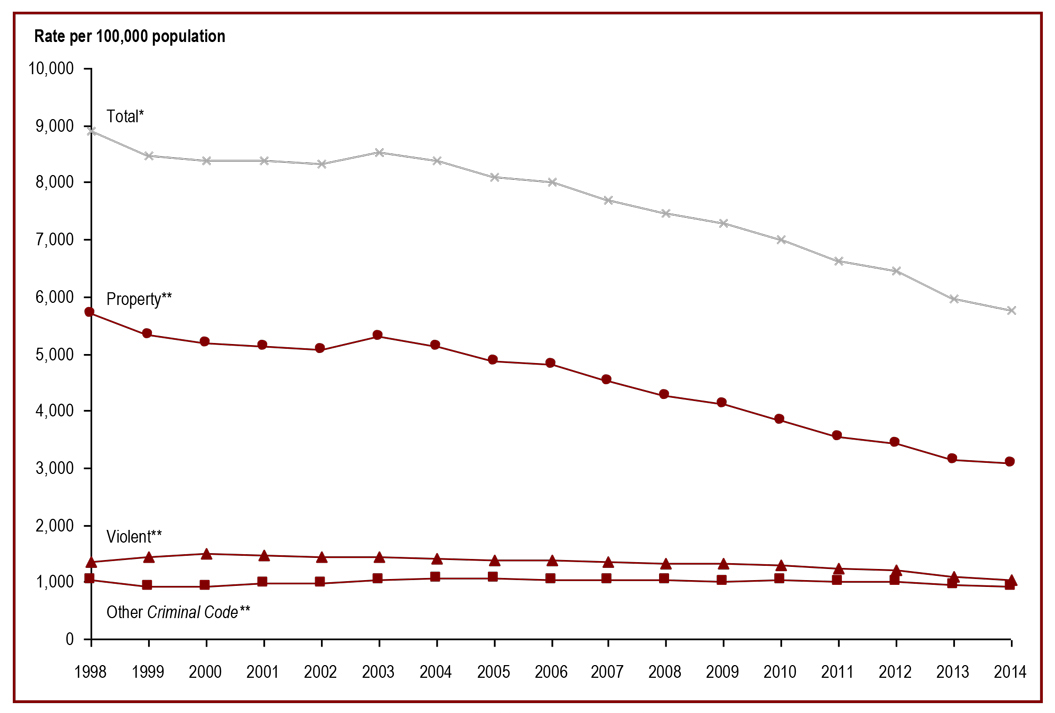
Police-reported crime rate has been decreasing since 1998
Figure A1
Source: Uniform Crime Reporting Survey, Canadian Centre for Justice Statistics, Statistics Canada.
- The overall crime rate has decreased 35.2% since 1998, from 8,915 per 100,000 to 5,774 in 2014.
- Over the same period, there was a 45.6% decrease in the property crime rate, from a rate of 5,696 per 100,000 to 3,096 in 2014. In contrast, the crime rate for drug offences has increased 24.3% since 1998, from 235 per 100,000 population to 292.
- The rate of violent crime has fluctuated over the last fifteen years, peaking in 2000 at 1,494 per 100,000 population. Since 2000, the rate of violent crimes has decreased 30.5% to 1,039 in 2014.
- In general, the crime rates for traffic offences and other Criminal Code offences have fluctuated since 1998.
Note:
*Unlike Statistics Canada, the Total Crime Rate in the Corrections and Conditional Release Statistical Overview includes traffic offences and offences against federal statutes to provide a measure of all criminal offences. As a result, the Total Crime Rate reported here is higher than that reported by Statistics Canada.
**The definitions for Violent, Property and Other Criminal Code offences have been revised by Statistics Canada to better reflect definitions used by the policing community. As a result of these changes, comparable data are only available starting in 1998 and the data presented in this year's report are not comparable to the data reported in previous versions of the Corrections and Conditional Release Statistical Overview.
These crime statistics are based on crimes that are reported to the police. Since not all crimes are reported to the police, these figures underestimate actual crime. See Figure F1 for rates based on victimization surveys (drawn from the General Social Survey), an alternative method of measuring crime.
| Year | Type of offence | ||||||
|---|---|---|---|---|---|---|---|
| Violent** | Property** | Traffic | Other CCC** | Drugs | Other Fed. Statutes | Total* | |
| 1998 | 1,345 | 5,696 | 469 | 1,051 | 235 | 119 | 8,915 |
| 1999 | 1,440 | 5,345 | 388 | 910 | 264 | 128 | 8,474 |
| 2000 | 1,494 | 5,189 | 370 | 924 | 287 | 113 | 8,376 |
| 2001 | 1,473 | 5,124 | 393 | 989 | 288 | 123 | 8,390 |
| 2002 | 1,441 | 5,080 | 379 | 991 | 296 | 128 | 8,315 |
| 2003 | 1,435 | 5,299 | 373 | 1,037 | 274 | 115 | 8,532 |
| 2004 | 1,404 | 5,123 | 379 | 1,072 | 306 | 107 | 8,391 |
| 2005 | 1,389 | 4,884 | 378 | 1,052 | 290 | 97 | 8,090 |
| 2006 | 1,387 | 4,809 | 376 | 1,050 | 295 | 87 | 8,004 |
| 2007 | 1,354 | 4,525 | 402 | 1,029 | 308 | 90 | 7,707 |
| 2008 | 1,334 | 4,258 | 437 | 1,039 | 308 | 100 | 7,475 |
| 2009 | 1,322 | 4,122 | 435 | 1,017 | 291 | 94 | 7,281 |
| 2010 | 1,292 | 3,838 | 420 | 1,029 | 321 | 96 | 6,996 |
| 2011 | 1,236 | 3,536 | 424 | 1,008 | 330 | 94 | 6,627 |
| 2012 | 1,197 | 3,435 | 406 | 1,000 | 317 | 103 | 6,458 |
| 2013 | 1,093 | 3,148 | 386 | 954 | 310 | 79 | 5,970 |
| 2014 | 1,039 | 3,096 | 364 | 911 | 292 | 71 | 5,774 |
Source: Uniform Crime Reporting Survey, Canadian Centre for Justice Statistics, Statistics Canada.
Note:
*Unlike Statistics Canada, the Total Crime Rate in the Corrections and Conditional Release Statistical Overview includes traffic offences and offences against federal statutes to provide a measure of all criminal offences. As a result, the Total Crime Rate reported here is higher than that reported by Statistics Canada.
**The definitions for Violent, Property and Other Criminal Code offences have been revised by Statistics Canada to better reflect definitions used by the policing community. As a result of these changes, comparable data are only available starting in 1998 and the data presented in this year’s report are not comparable to the data reported in previous versions of the Corrections and Conditional Release Statistical Overview.
Rates are based on incidents reported per 100,000 population.
Due to rounding, rates may not add to Totals.
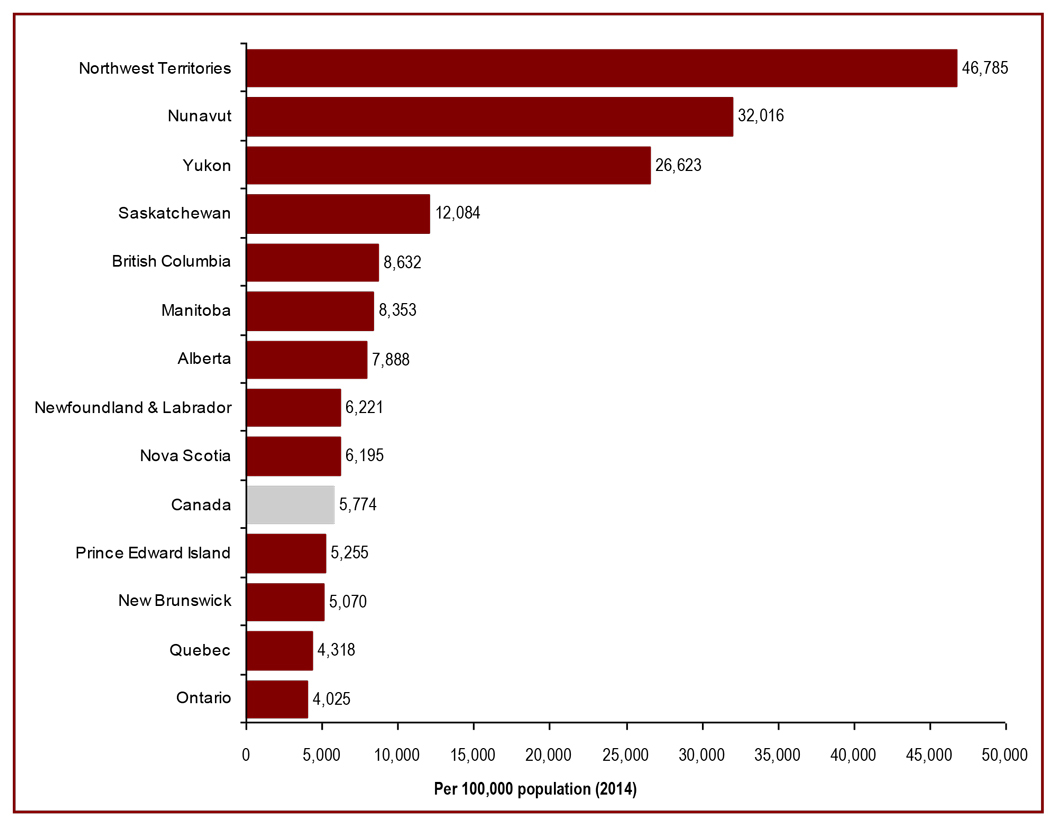
Crime rates are higher in the west and highest in the north
Figure A2
Source: Uniform Crime Reporting Survey, Canadian Centre for Justice Statistics, Statistics Canada.
- Crime rates are higher in the west and highest in the Territories. This general pattern has been stable over time.
- The Canadian crime rate* dropped from 6,996 in 2010 to 5,774 in 2014.
Note:
*Rates are based on 100,000 population.
Unlike Statistics Canada, the Crime Rate in the Corrections and Conditional Release Statistical Overview includes traffic offences and offences against federal statutes to provide a measure of all criminal offences. As a result, the Crime Rate reported here is higher than that reported by Statistics Canada. In addition, the definitions for Violent, Property and Other Criminal Code offences have been revised by Statistics Canada to better reflect definitions used by the policing community. As a result of these changes, comparable data are only available starting in 1998 and the data presented in this year’s report are not comparable to the data reported in previous versions of the Corrections and Conditional Release Statistical Overview.
| Province/Territory | Crime Rate* | ||||
|---|---|---|---|---|---|
| 2010 | 2011 | 2012 | 2013 | 2014 | |
| Newfoundland & Labrador | 7,535 | 7,136 | 6,837 | 6,667 | 6,221 |
| Prince Edward Island | 7,141 | 7,290 | 7,351 | 6,528 | 5,255 |
| Nova Scotia | 7,837 | 7,343 | 7,143 | 6,415 | 6,195 |
| New Brunswick | 6,339 | 6,063 | 6,276 | 5,477 | 5,070 |
| Quebec | 5,553 | 5,295 | 5,199 | 4,700 | 4,318 |
| Ontario | 5,073 | 4,796 | 4,612 | 4,184 | 4,025 |
| Manitoba | 10,650 | 9,866 | 9,741 | 8,721 | 8,353 |
| Saskatchewan | 14,309 | 14,121 | 13,539 | 12,529 | 12,084 |
| Alberta | 9,073 | 8,372 | 8,187 | 7,943 | 7,888 |
| British Columbia | 9,814 | 9,308 | 9,069 | 8,549 | 8,632 |
| Yukon Territory | 23,069 | 22,544 | 22,648 | 26,103 | 26,623 |
| Northwest Territories | 51,585 | 52,300 | 51,255 | 48,475 | 46,785 |
| Nunavut | 41,025 | 39,443 | 40,540 | 34,631 | 32,016 |
| Canada | 6,996 | 6,627 | 6,458 | 5,970 | 5,774 |
Source: Uniform Crime Reporting Survey, Canadian Centre for Justice Statistics, Statistics Canada.
Note:
*Rates are based on 100,000 population.
Unlike Statistics Canada, the Crime Rate in the Corrections and Conditional Release Statistical Overview includes traffic offences and offences against federal statutes to provide a measure of all criminal offences. As a result, the Crime Rate reported here is higher than that reported by Statistics Canada. In addition, the definitions for Violent, Property and Other Criminal Code offences have been revised by Statistics Canada to better reflect definitions used by the policing community. As a result of these changes, comparable data are only available starting in 1998 and the data presented in this year’s report are not comparable to the data reported in previous versions of the Corrections and Conditional Release Statistical Overview.
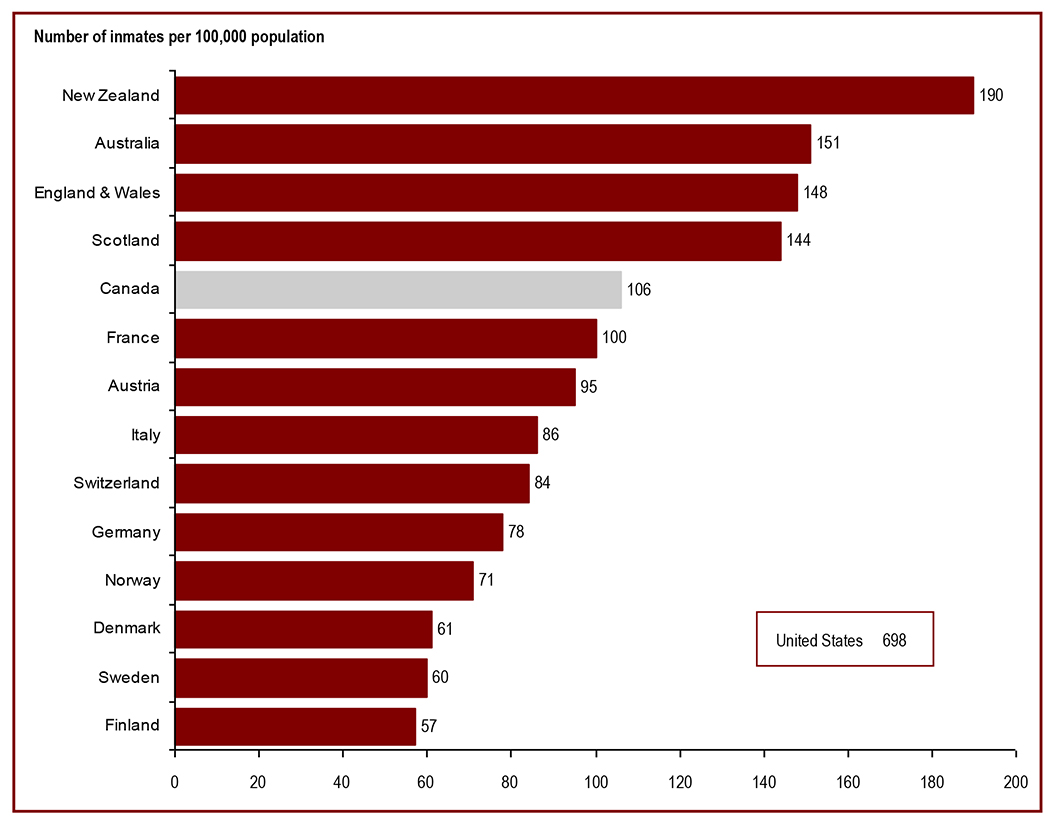
Canada’s incarceration rate is high relative to most western European countries
Figure A3
Source: World Prison Population List (retrieved November 20, 2015 at www.prisonstudies.org/highest-to-lowest/prison-population-total).
- Canada’s incarceration rate is higher than the rates in most Western European countries but much lower than the United States, where the most recent incarceration rate was 698 per 100,000 general population.
- Based on the most up to date information available from the International Centre for Prison Studies, Canada’s incarceration rate was 106 per 100,000. When ranked from highest to lowest, Canada's prison population rate was 141 of 222 countries.
Note:
The incarceration rate, in this figure, is a measure of the number of people (i.e., adults and youth) in custody per 100,000 people in the general population. Incarceration rates from the World Prison Population List are based on the most recently available data at the time the list was compiled. Due to variations in the availability of information, the 2006 and 2008 dates reported in Table A3 refer to when the World Prison Population Lists (Seventh and Eighth Editions respectively) were published, but may not necessarily correspond to the date the data were obtained. For 2015, the data was retrieved online on November 20, 2015 from http://www.prisonstudies.org which contains the most up-to-date information available. These data reflect incarceration rates based on the country’s population. Additionally, different practices and variations in measurement in different countries limit the comparability of these figures.
| 2002 | 2003 | 2004 | 20061* | 20082* | 20113* | 20124* | 20135* | 20146* | 20157* | |
|---|---|---|---|---|---|---|---|---|---|---|
| United States | 701 | 714 | 723 | 738 | 756 | 743 | 730 | 716 | 707 | 698 |
| New Zealand | 155 | 168 | 168 | 186 | 185 | 199 | 194 | 192 | 190 | 190 |
| England & Wales | 141 | 142 | 141 | 148 | 153 | 155 | 154 | 148 | 149 | 148 |
| Scotland | 129 | 132 | 136 | 139 | 152 | 155 | 151 | 147 | 144 | 144 |
| Australia | 115 | 117 | 120 | 126 | 129 | 133 | 129 | 130 | 143 | 151 |
| Canada | 116 | 108 | 107 | 107 | 116 | 117 | 114 | 118 | 118 | 106 |
| Italy | 100 | 98 | 96 | 104 | 92 | 110 | 109 | 106 | 88 | 86 |
| Austria | 100 | 106 | 110 | 105 | 95 | 104 | 104 | 98 | 99 | 95 |
| France | 93 | 91 | 91 | 85 | 96 | 102 | 102 | 101 | 102 | 100 |
| Germany | 98 | 96 | 98 | 95 | 89 | 87 | 83 | 79 | 81 | 78 |
| Switzerland | 68 | 81 | 81 | 83 | 76 | 79 | 76 | 82 | 87 | 84 |
| Sweden | 73 | 75 | 81 | 82 | 74 | 78 | 70 | 67 | 57 | 60 |
| Denmark | 64 | 70 | 70 | 77 | 63 | 74 | 74 | 73 | 67 | 61 |
| Norway | 59 | 65 | 65 | 66 | 69 | 73 | 73 | 72 | 75 | 71 |
| Finland | 70 | 71 | 66 | 75 | 64 | 59 | 59 | 58 | 55 | 57 |
Source: International Centre for Prison Studies: 1World Prison Population List (Seventh Edition); 2World Prison Population List (Eighth Edition); 3World Prison Population List (retrieved October 7, 2011 at www.prisonstudies.org/info/worldbrief/index.php), 4World Prison Population List (retrieved October 15, 2012 at www.prisonstudies.org/info/worldbrief/index.php). 5World Prison Population List (retrieved November 20, 2013 at www.prisonstudies.org/info/worldbrief/index.php). 6World Prison Population List (retrieved December 8, 2014 at http://www.prisonstudies.org/world-prison-brief). 7World Prison Population List (retrieved November 20, 2015 at www.prisonstudies.org/highest-to-lowest/prison-population-total).
Note:
*Incarceration rates from the World Prison Population List are based on the most recently available data at the time the list was compiled. Due to variations in the availability of information, the 2006 and 2008 dates reported in Table A3 refer to when the World Prison Population Lists (Seventh and Eighth Editions respectively) were published, but may not necessarily correspond to the date the data were obtained. For 2015, the data was retrieved online on November 20, 2015 at http://www.prisonstudies.org which contains the most up to date information available. Additionally, different practices and variations in measurement in different countries limit the comparability of these figures. Rates are based on 100,000 population.
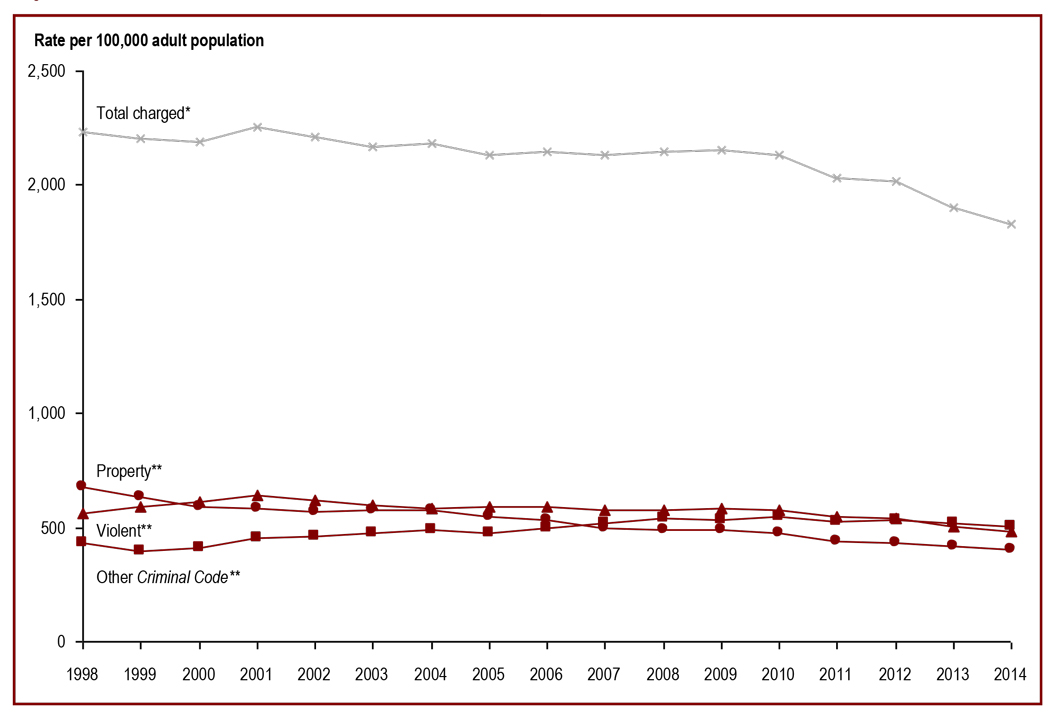
The rate of adults charged has declined
Figure A4
Source: Uniform Crime Reporting Survey, Canadian Centre for Justice Statistics, Statistics Canada.
- Since 1998, the rate of adults charged has decreased from 2,236 adults per 100,000 to 1,831 in 2014, a decrease of 18.1%.
- Over the same period, the rate of adults charged with violent crimes decreased by 14.2%, such that in 2014, 483 adults were charged per 100,000. Whereas the rate of adults charged for property offences has decreased 40.2% from 677 adults per 100,000 to 405 in 2014.
Note:
*Unlike Statistics Canada, the Total Crime Rate in the Corrections and Conditional Release Statistical Overview includes traffic offences and offences against federal statutes to provide a measure of all criminal offences. As a result, the Total Crime Rate reported here is higher than that reported by Statistics Canada.
**The definitions for Violent, Property and Other Criminal Code offences have been revised by Statistics Canada to better reflect definitions used by the policing community. As a result of these changes, comparable data are only available starting in 1998 and the data presented in this year’s report are not comparable to the data reported in previous versions of the Corrections and Conditional Release Statistical Overview.
Violent crimes include homicide, attempted murder, assault, sexual offences, abduction, extortion, robbery, firearms, and other violent offences such as uttering threats and criminal harassment.
Property crimes include break and enter, motor vehicle thefts, other thefts, possession of stolen property, fraud, mischief and arson.
| Year | Type of offence | ||||||
|---|---|---|---|---|---|---|---|
| Violent** | Property** | Traffic | Other CCC** | Drugs | Other Fed. Statutes | Total Charged* | |
| 1998 | 563 | 677 | 374 | 430 | 168 | 24 | 2,236 |
| 1999 | 590 | 632 | 371 | 396 | 185 | 30 | 2,203 |
| 2000 | 615 | 591 | 349 | 411 | 198 | 26 | 2,190 |
| 2001 | 641 | 584 | 349 | 451 | 202 | 28 | 2,256 |
| 2002 | 617 | 569 | 336 | 460 | 199 | 29 | 2,211 |
| 2003 | 598 | 573 | 326 | 476 | 172 | 23 | 2,168 |
| 2004 | 584 | 573 | 314 | 490 | 187 | 30 | 2,180 |
| 2005 | 589 | 550 | 299 | 479 | 185 | 29 | 2,131 |
| 2006 | 594 | 533 | 300 | 498 | 198 | 27 | 2,150 |
| 2007 | 577 | 499 | 298 | 521 | 208 | 28 | 2,132 |
| 2008 | 576 | 487 | 307 | 540 | 207 | 31 | 2,149 |
| 2009 | 585 | 490 | 311 | 532 | 201 | 34 | 2,152 |
| 2010 | 576 | 473 | 295 | 545 | 211 | 32 | 2,132 |
| 2011 | 548 | 441 | 271 | 527 | 213 | 34 | 2,034 |
| 2012 | 541 | 434 | 268 | 535 | 202 | 37 | 2,016 |
| 2013 | 499 | 415 | 242 | 514 | 200 | 26 | 1,904 |
| 2014 | 483 | 405 | 231 | 506 | 188 | 18 | 1,831 |
Source: Uniform Crime Reporting Survey, Canadian Centre for Justice Statistics, Statistics Canada.
Note:
*Unlike Statistics Canada, the Total Crime Rate in the Corrections and Conditional Release Statistical Overview includes traffic offences and offences against federal statutes to provide a measure of all criminal offences. As a result, the Total Crime Rate reported here is higher than that reported by Statistics Canada.
**The definitions for Violent, Property and Other Criminal Code offences have been revised by Statistics Canada to better reflect definitions used by the policing community. As a result of these changes, comparable data are only available starting in 1998 and the data presented in this year's report are not comparable to the data reported in previous versions of the Corrections and Conditional Release Statistical Overview.
Rates are based on 100,000 population, 18 years of age and older.
Due to rounding, rates may not add to Totals.
Violent crimes include homicide, attempted murder, assault, sexual offences, abduction, extortion, robbery, firearms, and other violent offences such as uttering threats and criminal harassment.
Property crimes include break and enter, motor vehicle thefts, other thefts, possession of stolen property, fraud, mischief and arson.
Administration of justice cases account for 23% of cases* in adult courts
Figure A5

Source: Adult Criminal Court Survey, Canadian Centre for Justice Statistics, Statistics Canada.
- Administration of justice cases (offences related to case proceedings such as failure to appear in court, failure to comply with a court order, breach of probation, and unlawfully at large) account for more than one fifth of cases completed in adult criminal courts.
- Apart from administration of justice cases, impaired driving and theft are the most frequent case in adult courts.
Note:
*Cases completed in adult criminal courts.
The concept of a case has changed to more closely reflect court processing. Statistics from the Adult Criminal Court Survey used in this report should not be compared to editions of the Corrections and Conditional Release Statistical Overview prior to 2007. A case is one or more charges against an accused person or corporation, processed by the courts at the same time, and where all of the charges in the case received a final disposition. Where a case has more than one charge, it is necessary to select a charge to represent the case. An offence is selected by applying two rules. First, the "most serious decision" rule is applied. In cases where two or more offences have the same decision, the "most serious offence" rule is applied. All charges are ranked according to an offence seriousness scale.
Superior Court data are not reported to the Adult Criminal Court Survey for Prince Edward Island, Quebec, Ontario, Manitoba and Saskatchewan. In addition, information from Quebec’s municipal courts is not collected.
The Canadian Centre for Justice Statistics continues to make updates to the offence library used to classify offence data sent by the provinces and territories. These improvements have resulted in minor changes in the counts of charges and cases as well as the distributions by type of offence. Data presented have been revised to account for these updates.
Due to rounding, percentages may not add to 100 percent.
| Type of Charge | Criminal Code and Other Federal Statute Charges | |||||
|---|---|---|---|---|---|---|
| 2011-12 | 2012-13 | 2013-14 | ||||
| # | % | # | % | # | % | |
| Crimes Against the Person | 93,225 | 23.65 | 91,033 | 23.49 | 84,862 | 23.53 |
| Homicide and Related | 272 | 0.07 | 243 | 0.06 | 258 | 0.07 |
| Attempted Murder | 158 | 0.04 | 145 | 0.04 | 186 | 0.05 |
| Robbery | 3,929 | 1.00 | 3,985 | 1.03 | 3,388 | 0.94 |
| Sexual Assault | 4,058 | 1.03 | 3,204 | 0.83 | 3,002 | 0.83 |
| Other Sexual Offences | 2,321 | 0.59 | 3,307 | 0.85 | 3,462 | 0.96 |
| Major Assault (Levels 2 & 3) | 21,998 | 5.33 | 20,547 | 5.30 | 19,232 | 5.33 |
| Common Assault (Level 1) | 37,443 | 9.50 | 35,853 | 9.25 | 33,630 | 9.33 |
| Uttering Threats | 17,701 | 4.49 | 17,559 | 4.53 | 15,810 | 4.38 |
| Criminal Harassment | 3,300 | 0.84 | 3,158 | 0.81 | 3,175 | 0.88 |
| Other Crimes Against Persons | 3,045 | 0.77 | 3,022 | 0.78 | 2,719 | 0.75 |
| Crimes Against Property | 91,380 | 23.19 | 88,664 | 22.87 | 82,187 | 22.79 |
| Theft | 40,328 | 10.23 | 39,318 | 10.14 | 36,364 | 10.08 |
| Break and Enter | 10,959 | 2.78 | 10,864 | 2.80 | 9,609 | 2.66 |
| Fraud | 12,850 | 3.26 | 12,130 | 3.13 | 11,381 | 3.16 |
| Mischief | 14,348 | 3.64 | 13,771 | 3.55 | 13,041 | 3.62 |
| Possession of Stolen Property | 11,244 | 2.85 | 10,987 | 2.83 | 10,371 | 2.88 |
| Other Property Crimes | 1,651 | 0.42 | 1,594 | 0.41 | 1,421 | 0.39 |
| Administration of Justice | 85,607 | 21.72 | 85,554 | 22.07 | 82,116 | 22.77 |
| Fail to Appear | 4,689 | 1.19 | 4,565 | 1.18 | 4,389 | 1.22 |
| Breach of probation | 32,029 | 8.13 | 32,742 | 8.45 | 31,334 | 8.69 |
| Unlawfully at large | 2,653 | 0.67 | 2,512 | 0.65 | 2,595 | 0.72 |
| Fail to Comply with Order | 37,445 | 9.50 | 37,232 | 9.61 | 35,516 | 9.85 |
| Other Admin. Justice | 8,791 | 2.23 | 8,503 | 2.19 | 8,282 | 2.30 |
| Other Criminal Code | 16,970 | 4.31 | 16,791 | 4.33 | 15,272 | 4.23 |
| Weapons | 9,727 | 2.47 | 9,682 | 2.50 | 9,020 | 2.50 |
| Prostitution | 1,040 | 0.26 | 896 | 0.23 | 903 | 0.25 |
| Disturbing the Peace | 1,423 | 0.36 | 1,452 | 0.37 | 1,316 | 0.36 |
| Residual Criminal Code | 4,780 | 1.21 | 4,761 | 1.23 | 4,033 | 1.12 |
| Criminal Code Traffic | 54,608 | 13.86 | 52,413 | 13.52 | 48,334 | 13.40 |
| Impaired Driving | 43,383 | 11.01 | 42,048 | 10.85 | 38,635 | 10.71 |
| Other CC Traffic | 11,225 | 2.85 | 10,365 | 2.67 | 9,699 | 2.69 |
| Other Federal Statutes | 52,326 | 13.28 | 53,159 | 13.71 | 47,869 | 13.27 |
| Drug Possession | 16,947 | 4.30 | 16,303 | 4.21 | 14,925 | 4.14 |
| Other Drug Offences | 12,728 | 3.23 | 11,577 | 2.99 | 10,100 | 2.80 |
| Residual Federal Statutes | 22,651 | 5.75 | 25,279 | 6.52 | 22,844 | 6.33 |
| Total Offences | 394,116 | 100.0 | 387,614 | 100.00 | 360,640 | 100.00 |
Source: Adult Criminal Court Survey, Canadian Centre for Justice Statistics, Statistics Canada.
Note:
*Cases completed in adult criminal courts.
The concept of a case has changed to more closely reflect court processing. Statistics from the Adult Criminal Court Survey used in this report should not be compared to editions of the Corrections and Conditional Release Statistical Overview prior to 2007. Superior Court data are not reported to the Adult Criminal Court Survey for Prince Edward Island, Quebec, Ontario, Manitoba and Saskatchewan. In addition, information from Quebec's municipal courts is not collected. The Canadian Centre for Justice Statistics continues to make updates to the offence library used to classify offence data sent by the provinces and territories. These improvements have resulted in minor changes in the counts of charges and cases as well as the distributions by type of offence. Data presented have been revised to account for these updates.
Due to rounding, percentages may not add to 100 percent.
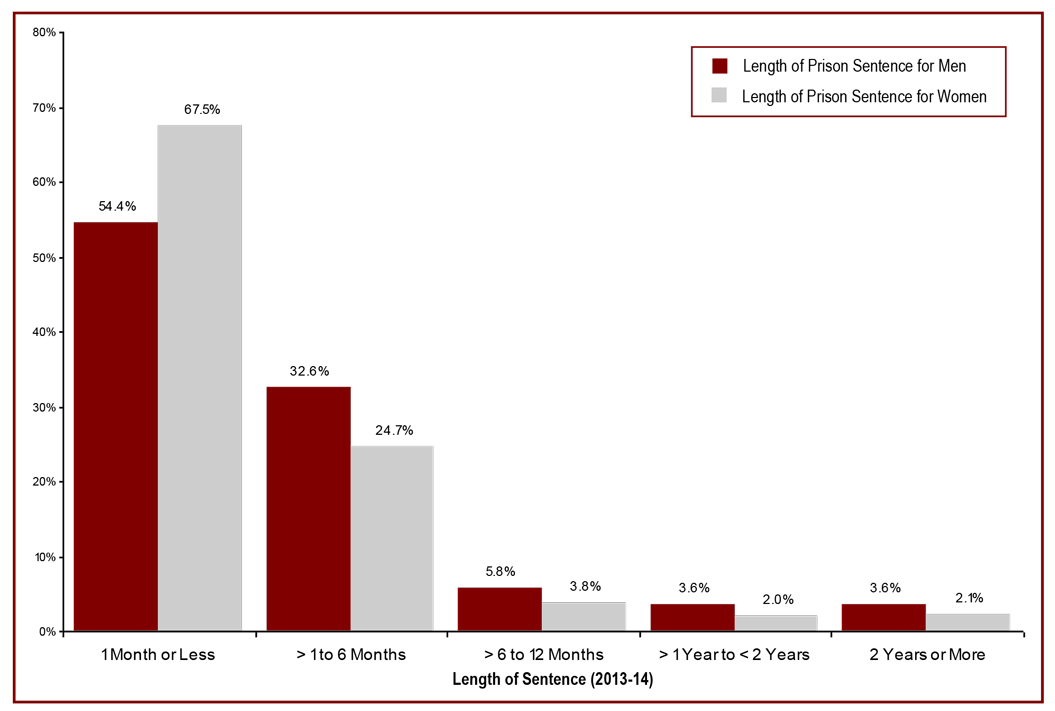
Most adult custodial sentences ordered by the court are short
Figure A6
Source: Adult Criminal Court Survey, Canadian Centre for Justice Statistics, Statistics Canada.
- Over half (56%) of all custodial sentences imposed by adult criminal courts are one month or less.
- Prison sentences for men tend to be longer than for women. About two-thirds (67.5%) of women and just over half of men (54.4%) who are incarcerated upon guilty* finding receive a sentence of one month or less, and 92.2% of women and 87% of men receive a sentence of six months or less.
- Of all guilty findings that result in custody, only 3.4% result in federal jurisdiction (i.e., a sentence of two years or more).
Note:
*The type of decision group “guilty” includes guilty of the offence, of an included offence, of an attempt of the offence, or of an attempt of an included offence. This category also includes cases where an absolute or conditional discharge has been imposed.
The concept of a case has changed to more closely reflect court processing. Statistics from the Adult Criminal Court Survey used in this report should not be compared to editions of the Corrections and Conditional Release Statistical Overview prior to 2007.
Excludes cases where length of prison sentence and/or sex was not known, data for Manitoba as information on sentence length was not available.
Superior Court data are not reported to the Adult Criminal Court Survey for Prince Edward Island, Quebec, Ontario, Manitoba and Saskatchewan. In addition, information from Quebec’s municipal courts is not collected.
The Canadian Centre for Justice Statistics continues to make updates to the offence library used to classify offence data sent by the provinces and territories. These improvements have resulted in minor changes in the counts of charges and cases as well as the distributions by type of offence. Data presented have been revised to account for these updates.
Due to rounding, totals may not add to 100 percent.
| Length of Prison Sentence | 2009-10 | 2010-11 | 2011-12 | 2012-13 | 2013-14 |
|---|---|---|---|---|---|
| % | % | % | % | % | |
| 1 Month or Less | |||||
| Women | 67.7 | 66.7 | 67.5 | 67.8 | 67.5 |
| Men | 53.6 | 51.4 | 52.6 | 53.2 | 54.4 |
| Total | 55.2 | 53.0 | 54.3 | 54.9 | 56.0 |
| More Than 1 Month to 6 Months | |||||
| Women | 23.3 | 24.7 | 23.9 | 24.1 | 24.7 |
| Men | 31.6 | 33.9 | 33.2 | 32.6 | 32.6 |
| Total | 30.7 | 32.9 | 32.2 | 31.6 | 31.7 |
| More Than 6 Months to 12 Months | |||||
| Women | 4.4 | 3.8 | 4.4 | 4.2 | 3.8 |
| Men | 6.7 | 6.8 | 6.6 | 6.4 | 5.8 |
| Total | 6.4 | 6.5 | 6.4 | 6.1 | 5.5 |
| More Than 1 Year to Less Than 2 Years | |||||
| Women | 2.2 | 2.4 | 2.2 | 2.1 | 2.0 |
| Men | 3.7 | 3.6 | 3.7 | 3.9 | 3.6 |
| Total | 3.6 | 3.5 | 3.5 | 3.7 | 3.4 |
| 2 Years or More | |||||
| Women | 2.3 | 2.4 | 2.1 | 1.8 | 2.1 |
| Men | 4.4 | 4.4 | 3.9 | 3.8 | 3.6 |
| Total | 4.2 | 4.1 | 3.7 | 3.6 | 3.4 |
Source: Adult Criminal Court Survey, Canadian Centre for Justice Statistics, Statistics Canada.
Note:
The concept of a case has changed to more closely reflect court processing. Statistics from the Adult Criminal Court Survey used in this report should not be compared to editions of the Corrections and Conditional Release Statistical Overview prior to 2007.
Excludes cases where length of prison sentence and/or sex was not known, data for Manitoba as information on both sentence length was not available.
Superior Court data are not reported to the Adult Criminal Court Survey for Quebec, Ontario, Manitoba and Saskatchewan. In addition, information from Quebec’s municipal courts is not collected.
The Canadian Centre for Justice Statistics continues to make updates to the offence library used to classify offence data sent by the provinces and territories. These improvements have resulted in minor changes in the counts of charges and cases as well as the distributions by type of offence. Data presented have been revised to account for these updates.
Due to rounding, totals may not add to 100 percent.
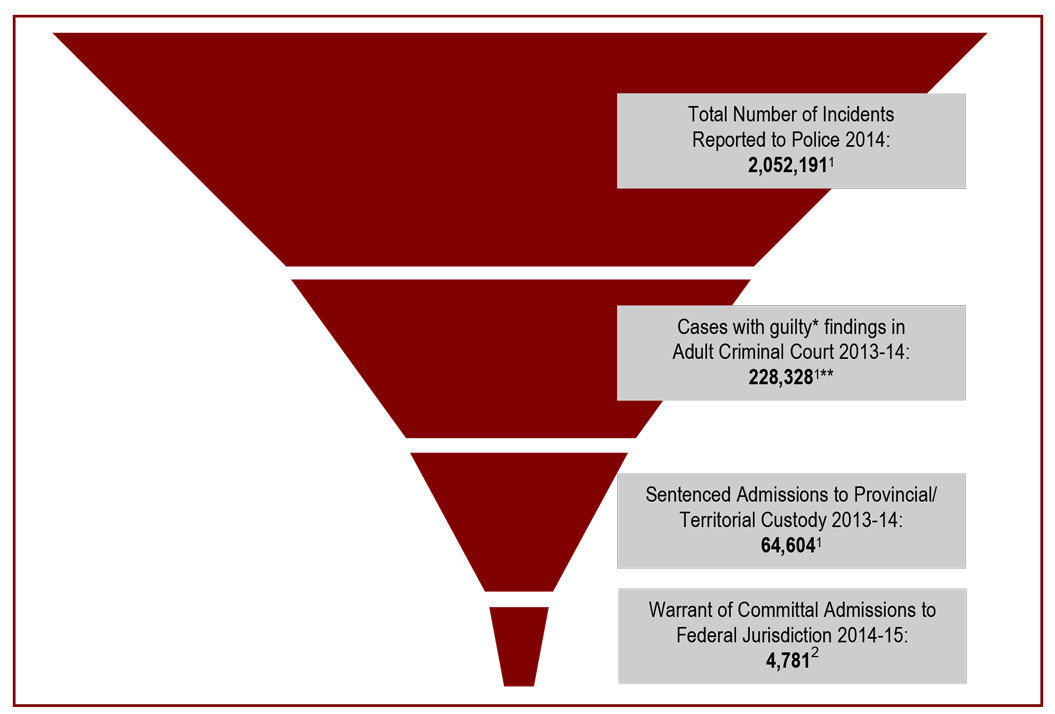
Relatively few crimes result in sentences to federal penitentiaries
Figure A7
Source: 1Uniform Crime Reporting Survey-2, Adult Criminal Court Survey, and Adult Correctional Services Survey, Canadian Centre for Justice Statistics, Statistics Canada; 2 Correctional Service Canada.
- There were about 2 million incidents reported to police in 2014.
- During 2014-15, there were 4,781 warrant of committal admissions for offenders sentenced to federal jurisdiction (i.e., two years or more).
Note:
*The type of decision group “guilty” includes guilty of the offence, of an included offence, of an attempt of the offence, or of an attempt of an included offence. This category also includes cases where an absolute or conditional discharge has been imposed.
**This figure only includes cases in provincial court and partial data from Superior Court. Superior Court data are not reported to the Adult Criminal Court Survey for Quebec, Ontario, Manitoba and Saskatchewan. Information from Quebec’s municipal courts is not collected.
The concept of a case has changed to more closely reflect court processing. Statistics from the Adult Criminal Court Survey used in this report should not be compared to editions of the Corrections and Conditional Release Statistical Overview prior to 2007. A case is one or more charges against an accused person or corporation, processed by the courts at the same time, and where all of the charges in the case received a final disposition.
Police data are reported on a calendar year basis whereas court and prison data are reported on a fiscal year basis (April 1 through March 31).
| 2010-11 | 2011-12 | 2012-13 | 2013-14 | 2014-15 | |
|---|---|---|---|---|---|
| Total Number of Incidents Reported to Police1 | 2,379,130 | 2,275,917 | 2,244,458 | 2,098,776 | 2,098,302 |
| Cases with guilty* findings in Adult Criminal Court1** | 261,325 | 256,603 | 249,152 | 228,328 | Not available |
| Sentenced Admissions to Provincial/Territorial Custody1 | 83,976 | 85,013 | 65,922 | 64,604 | Not available |
| Warrant of Committal Admissions to Federal Facilities2 | 5,423 | 5,103 | 5,094 | 5,139 | 4,781 |
Source: 1 Uniform Crime Reporting Survey-2, Adult Criminal Court Survey, and Adult Correctional Services Survey, Canadian Centre for Justice Statistics, Statistics Canada; 2 Correctional Service Canada.
Note:
*The type of decision group “guilty” includes guilty of the offence, of an included offence, of an attempt of the offence, or of an attempt of an included offence. This category also includes cases where an absolute or conditional discharge has been imposed.
**This figure only includes cases convicted in provincial court and partial data from Superior Court. Superior Court data are not reported to the Adult Criminal Court Survey for Quebec, Ontario, Manitoba and Saskatchewan. Information from Quebec’s municipal courts is not collected.
The concept of a case has changed to more closely reflect court processing. Statistics from the Adult Criminal Court Survey used in this report should not be compared to editions of the Corrections and Conditional Release Statistical Overview prior to 2007. A case is one or more charges against an accused person or corporation, processed by the courts at the same time, and where all of the charges in the case received a final disposition.
Police data are reported on a calendar year basis whereas court and prison data are reported on a fiscal year basis (April 1 through March 31).
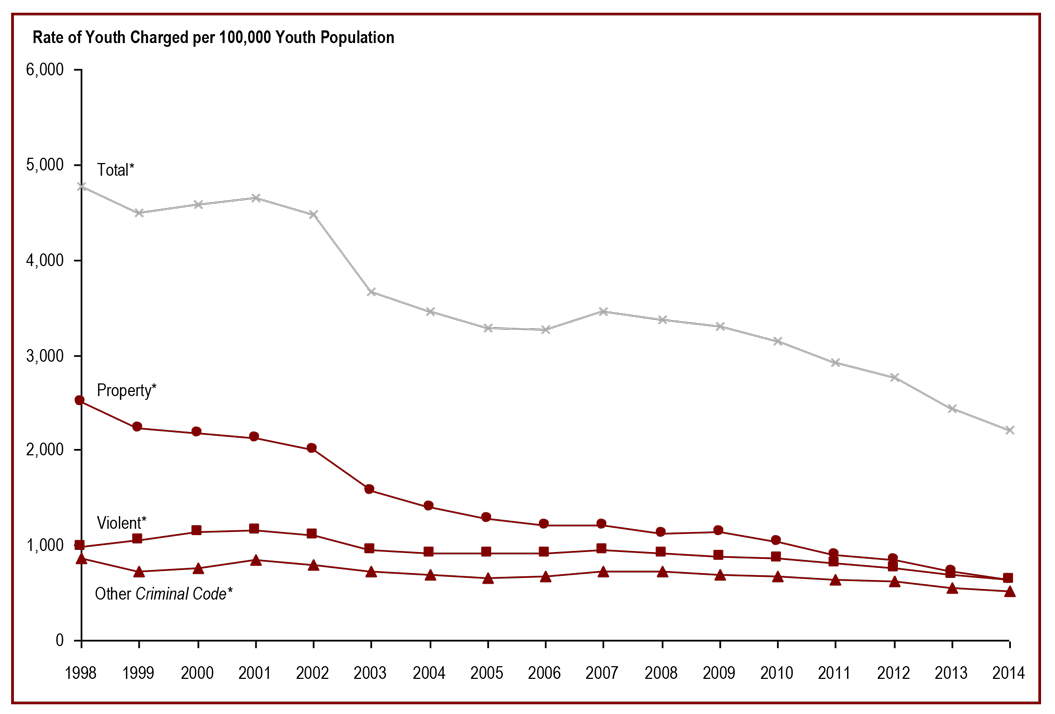
The rate of youth charged has declined over the past eight years
Figure A8
Source: Uniform Crime Reporting Survey, Canadian Centre for Justice Statistics, Statistics Canada.
- The rate of youth** charged has declined over the past eight years.
- In 2003, there was a notable decrease in all major crime categories, in part attributable to the implementation of the Youth Criminal Justice Act (YCJA) in April 2003, which places greater emphasis on diversion.
- The rate of youth** charged with property crimes have decreased since 1998 by 74% from 2,500 per 100,000 youth to 641 in 2014.
- The rate of youth** charged with violent crimes have decreased 45% since reaching its peak in 2001 from 1,157 per 100,000 youth to 636 in 2014.
Note:
*Unlike Statistics Canada, the Total Crime Rate in the Corrections and Conditional Release Statistical Overview includes traffic offences and offences against federal statutes to provide a measure of all criminal offences. As a result, the Total Crime Rate reported here is higher than that reported by Statistics Canada. In addition, the definitions for Violent, Property and Other Criminal Code offences have been revised by Statistics Canada to better reflect definitions used by the policing community. As a result of these changes, comparable data are only available starting in 1998 and the data presented in this year’s report are not comparable to the data reported in previous versions of the Corrections and Conditional Release Statistical Overview.
**For criminal justice purposes, youth are defined under Canadian law as persons aged 12 to 17 years.
Rates are based on 100,000 youth population (12 to 17 years).
Violent crimes include homicide, attempted murder, assault, sexual offences, abduction, extortion, robbery, firearms, and other violent offences such as uttering threats and criminal harassment.
Property crimes include break and enter, motor vehicle thefts, other thefts, possession of stolen property, fraud, mischief and arson.
| Year | Type of Offence | ||||||
|---|---|---|---|---|---|---|---|
| Violent* | Property* | Traffic | Other CCC* | Drugs | Other Fed. Statutes | Total Charged* | |
| 1998 | 994 | 2,500 | -- | 870 | 226 | 184 | 4,775 |
| 1999 | 1,060 | 2,237 | -- | 728 | 266 | 209 | 4,500 |
| 2000 | 1,136 | 2,177 | -- | 760 | 317 | 198 | 4,589 |
| 2001 | 1,157 | 2,119 | -- | 840 | 343 | 195 | 4,656 |
| 2002 | 1,102 | 2,009 | -- | 793 | 337 | 235 | 4,476 |
| 2003 | 953 | 1,570 | -- | 726 | 208 | 204 | 3,662 |
| 2004 | 918 | 1,395 | -- | 691 | 230 | 222 | 3,457 |
| 2005 | 924 | 1,276 | -- | 660 | 214 | 212 | 3,287 |
| 2006 | 917 | 1,216 | -- | 680 | 240 | 216 | 3,269 |
| 2007 | 943 | 1,211 | 75 | 732 | 260 | 239 | 3,461 |
| 2008 | 909 | 1,130 | 74 | 730 | 267 | 259 | 3,369 |
| 2009 | 888 | 1,143 | 68 | 698 | 238 | 260 | 3,294 |
| 2010 | 860 | 1,035 | 62 | 669 | 255 | 266 | 3,147 |
| 2011 | 805 | 903 | 58 | 635 | 263 | 251 | 2,915 |
| 2012 | 764 | 840 | 58 | 628 | 240 | 235 | 2,765 |
| 2013 | 692 | 723 | 42 | 555 | 229 | 193 | 2,436 |
| 2014 | 636 | 641 | 42 | 522 | 203 | 168 | 2,214 |
Source: Uniform Crime Reporting Survey, Canadian Centre for Justice Statistics, Statistics Canada.
Note:
*Unlike Statistics Canada, the Total Crime Rate in the Corrections and Conditional Release Statistical Overview includes traffic offences and offences against federal statutes to provide a measure of all criminal offences. As a result, the Total Crime Rate reported here is higher than that reported by Statistics Canada. In addition, the definitions for Violent, Property and Other Criminal Code offences have been revised by Statistics Canada to better reflect definitions used by the policing community. As a result of these changes, comparable data are only available starting in 1998 and the data presented in this year’s report are not comparable to the data reported in previous versions of the Corrections and Conditional Release Statistical Overview.
**Data for Youth Charged and Youth Not Charged for Impaired Driving are not available prior to 2007. As a result, comparisons to Total Charged and Other CCC (including traffic) over time should be made with caution.
For criminal justice purposes, youth are defined under Canadian law as persons aged 12 to 17 years.
Rates are based on 100,000 youth population (12 to 17 years).
Violent crimes include homicide, attempted murder, assault, sexual offences, abduction, extortion, robbery, firearms, and other violent offences such as uttering threats and criminal harassment.
Property crimes include break and enter, motor vehicle thefts, other thefts, possession of stolen property, fraud, mischief and arson.
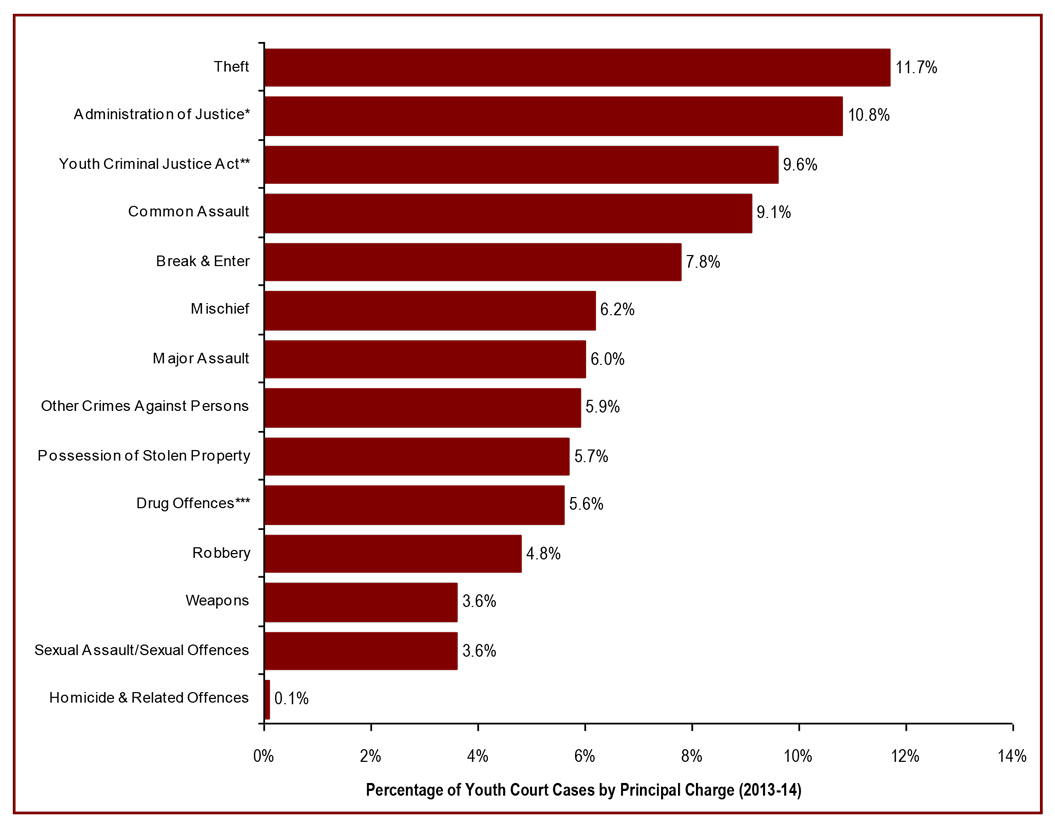
The most common youth court case is theft
Figure A9
Source: Integrated Criminal Court Survey, Canadian Centre for Justice Statistics, Statistics Canada.
- Following the enactment of the Youth Criminal Justice Act in 2003, fewer youth are in court.
- Theft is the most common case in youth court.
- Homicides and related offences account for 0.1% of all youth cases.
- Females account for 22% of all cases, but they account for 36% of common assaults.
Note:
*“Administration of Justice” includes the offences failure to appear, failure to comply, and breach of recognizance.
**Youth Criminal Justice Act offences include failure to comply with a disposition or undertaking, contempt against youth court, assisting a youth to leave a place of custody and harbouring a youth unlawfully at large. Also included are similar offences under the Young Offenders Act, which preceded the Youth Criminal Justice Act.
***“Drug Offences” includes possession and trafficking.
The concept of a case has changed to more closely reflect court processing. Statistics from the Youth Court Survey used in this report should not be compared to editions of the Corrections and Conditional Release Statistical Overview prior to 2007. A case is one or more charges against an accused person or corporation, processed by the courts at the same time, and where all of the charges in the case received a final disposition. Where a case has more than one charge, it is necessary to select a charge to represent the case. An offence is selected by applying two rules. First, the “most serious decision” rule is applied. In cases where two or more offences have the same decision, the “most serious offence” rule is applied. All charges are ranked according to an offence seriousness scale.
The Canadian Centre for Justice Statistics continues to make updates to the offence library used to classify offence data sent by the provinces and territories. These improvements have resulted in minor changes in the counts of charges and cases as well as the distributions by type of offence. Data presented have been revised to account for these updates.
| Type of Case | Number of Youth Court Cases | ||||
|---|---|---|---|---|---|
| 2009-10 | 2010-11 | 2011-12 | 2012-13 | 2013-14 | |
| Crimes Against the Person | 14,823 | 14,275 | 13,216 | 12,792 | 11,720 |
| Homicide and Attempted Murder | 70 | 69 | 55 | 52 | 53 |
| Robbery | 2,539 | 2,605 | 2,464 | 2,336 | 1,904 |
| Sexual Assault / Other Sexual Offences | 1,255 | 1,306 | 1,277 | 1,331 | 1,417 |
| Major Assault | 3,561 | 3,361 | 2,900 | 2,715 | 2,396 |
| Common Assault | 4,477 | 4,208 | 4,029 | 3,878 | 3,613 |
| Other Crimes Against the Person* | 2,921 | 2,726 | 2,491 | 2,480 | 2,337 |
| Crimes Against Property | 22,242 | 20,408 | 17,389 | 15,723 | 13,370 |
| Theft | 8,454 | 7,879 | 6,591 | 5,476 | 4,658 |
| Break and Enter | 4,835 | 4,410 | 3,824 | 3,606 | 3,100 |
| Fraud | 837 | 641 | 525 | 474 | 465 |
| Mischief | 4,253 | 3,752 | 3,330 | 2,948 | 2,489 |
| Possession of Stolen Property | 3,249 | 3,147 | 2,689 | 2,779 | 2,294 |
| Other Crimes Against Property | 614 | 579 | 430 | 440 | 364 |
| Administration of Justice | 6,104 | 5,702 | 5,259 | 4,893 | 4,290 |
| Failure to comply with order | 4,045 | 3,738 | 3,529 | 3,230 | 2,875 |
| Other Administration of Justice** | 2,059 | 1,964 | 1,730 | 1,663 | 1,415 |
| Other Criminal Code | 2,967 | 2,709 | 2,476 | 2,424 | 2,160 |
| Weapons / Firearms | 2,016 | 1,834 | 1,686 | 1,555 | 1,451 |
| Prostitution | 10 | 14 | 5 | 6 | 11 |
| Disturbing the Peace | 187 | 165 | 121 | 132 | 86 |
| Residual Criminal Code | 754 | 696 | 664 | 731 | 612 |
| Criminal Code Traffic | 1,118 | 963 | 855 | 828 | 646 |
| Other Federal Statutes | 9,605 | 9,437 | 9,757 | 8,781 | 7,715 |
| Drug Possession | 2,556 | 2,560 | 2,018 | 1,844 | 1,568 |
| Drug Trafficking | 1,279 | 1,220 | 857 | 718 | 662 |
| Youth Criminal Justice Act*** | 5,685 | 5,603 | 5,272 | 4,542 | 3,841 |
| Residual Federal Statutes | 85 | 54 | 1,610 | 1,677 | 1,644 |
| Total | 56,859 | 53,494 | 48,952 | 45,441 | 39,901 |
Source: Integrated Criminal Court Survey, Canadian Centre for Justice Statistics, Statistics Canada.
Note:
*“Other Crimes Against the Person” includes the offences uttering threats and criminal harassment.
**“Other Administration of Justice” includes the offences failure to appear, failure to comply, and breach of recognizance.
***Youth Criminal Justice Act offences include failure to comply with a disposition or undertaking, contempt against youth court, assisting a youth to leave a place of custody and harbouring a youth unlawfully at large. Also included are similar offences under the Young Offenders Act, which preceded the Youth Criminal Justice Act.
The concept of a case has changed to more closely reflect court processing. Statistics from the Youth Court Survey used in this report should not be compared to editions of the Corrections and Conditional Release Statistical Overview prior to 2007. A case is one or more charges against an accused person or corporation, processed by the courts at the same time, and where all of the charges in the case received a final disposition. Where a case has more than one charge, it is necessary to select a charge to represent the case. An offence is selected by applying two rules. First, the “most serious decision” rule is applied. In cases where two or more offences have the same decision, the “most serious offence” rule is applied. All charges are ranked according to an offence seriousness scale.
The Canadian Centre for Justice Statistics continues to make updates to the offence library used to classify offence data sent by the provinces and territories. These improvements have resulted in minor changes in the counts of charges and cases as well as the distributions by type of offence. Data presented have been revised to account for these updates.
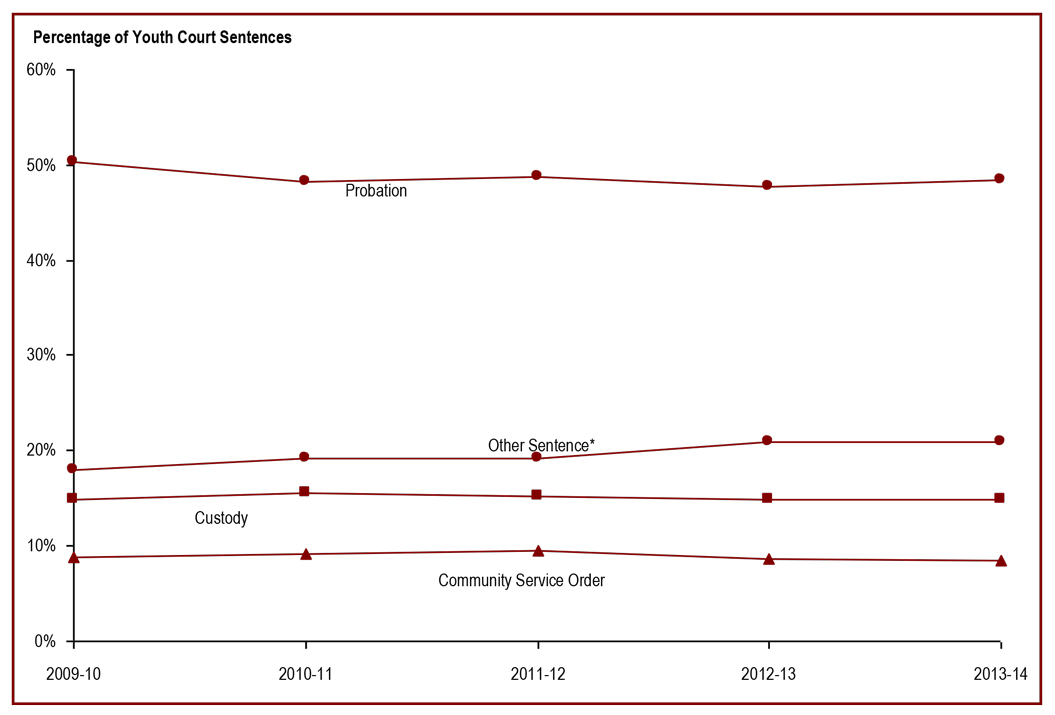
The most common sentence for youth is probation
Figure A10
Source: Integrated Criminal Court Survey, Canadian Centre for Justice Statistics, Statistics Canada.
- Consistent with the objectives of the YCJA, fewer youth are sentenced to custody. In 2013-14, 14.9% of all guilty cases resulted in the youth being sentenced to custody.
- In 2013-14, 48.5% of youth found guilty were given probation as the most serious sentence. This rate has remained relatively stable since the implementation of the YCJA in April 2003.
- Of the new YCJA sentences, deferred custody and supervision orders were handed down most frequently. In 2013-14, 4.5% of all guilty cases received such an order as the most serious sentence.
Note:
*“Other Sentence” includes absolute discharge, restitution, prohibition, seizure, forfeiture, compensation, pay purchaser, essays, apologies, counselling programs and conditional discharge, conditional sentence, intensive support and supervision, attendance at non-residential program(s) and reprimand. This category also includes deferred custody and supervision, intensive support and supervision, attendance at non-residential program(s) and reprimand where sentencing data under the Youth Criminal Justice Act (YCJA) are not available.
Unlike previous years, this data represents the most serious sentence and therefore, sanctions are mutually exclusive. However, each case may receive more than one sentence.
The concept of a case has changed to more closely reflect court processing. Statistics from the Youth Court Survey used in this report should not be compared to editions of the Corrections and Conditional Release Statistical Overview prior to 2007.
| Type of Sentence | Gender | Year | ||||
|---|---|---|---|---|---|---|
| 2009-10 | 2010-11 | 2011-12 | 2012-13 | 2013-14 | ||
| % | % | % | % | % | ||
| Probation | Female | 50.0 | 47.5 | 47.4 | 48.7 | 49.2 |
| Male | 50.0 | 47.5 | 48.4 | 47.6 | 48.4 | |
| Total | 50.3 | 48.2 | 48.7 | 47.7 | 48.5 | |
| Custody | Female | 12.5 | 12.6 | 11.5 | 11.1 | 10.8 |
| Male | 16.2 | 17.2 | 17.0 | 16.4 | 16.2 | |
| Total | 14.8 | 15.5 | 15.2 | 14.9 | 14.9 | |
| Community Service Order | Female | 9.3 | 9.4 | 9.7 | 9.7 | 9.0 |
| Male | 8.0 | 8.5 | 8.6 | 8.1 | 7.9 | |
| Total | 8.9 | 9.1 | 9.5 | 8.7 | 8.5 | |
| Fine | Female | 2.8 | 3.2 | 2.5 | 2.4 | 2.3 |
| Male | 4.1 | 3.7 | 3.3 | 3.5 | 2.8 | |
| Total | 3.7 | 3.6 | 3.0 | 3.2 | 2.8 | |
| Deferred Custody and Supervision | Female | 4.0 | 4.3 | 5.1 | 3.9 | 4.1 |
| Male | 4.6 | 4.7 | 4.5 | 4.7 | 4.6 | |
| Total | 4.3 | 4.4 | 4.3 | 4.4 | 4.5 | |
| Other Sentence* | Female | 21.4 | 23.0 | 23.8 | 24.2 | 24.6 |
| Male | 17.0 | 18.4 | 18.2 | 19.7 | 20.0 | |
| Total | 18.0 | 19.2 | 19.2 | 21.0 | 20.9 | |
Source: Integrated Criminal Court Survey, Canadian Centre for Justice Statistics, Statistics Canada.
Note:
*“Other Sentence” includes absolute discharge, restitution, prohibition, seizure, forfeiture, compensation, pay purchaser, essays, apologies, counselling programs and conditional discharge, conditional sentence, intensive support and supervision, attendance at non-residential program(s) and reprimand. This category also includes deferred custody and supervision, intensive support and supervision, attendance at non-residential program(s) and reprimand where sentencing data under the Youth Criminal Justice Act (YCJA) are not available.
Unlike previous years, this data represents the most serious sentence and therefore, sanctions are mutually exclusive. However, each case may receive more than one sentence.
The concept of a case has changed to more closely reflect court processing. Statistics from the Youth Court Survey used in this report should not be compared to editions of the Corrections and Conditional Release Statistical Overview prior to 2007.
Section B: Corrections Administration
Expenditures on corrections increased in 2013-14
Figure B1

Source: Correctional Service Canada; Parole Board of Canada; Office of the Correctional Investigator; Statistics Canada Consumer Price Index.
- In 2013-14, expenditures on federal corrections in Canada totaled approximately $2.81 billion, a 4.2% increase from 2012-13.
- Since 2004-05, expenditures on federal corrections have increased 72.1%, from $1.63 billion to $2.81 billion. In constant dollars, this represents an increase of 67.4%.
- Provincial/territorial expenditures totaled about $2.16 billion in 2013-14, an increase of 56.2% since 2004-05. In constant dollars, this represents an increase of 51.9%.
Note:
Federal expenditures on corrections include spending by the Correctional Service Canada (CSC), the Parole Board of Canada (PBC), and the Office of the Correctional Investigator (OCI). The expenditures for the CSC include both operating and capital costs. CSC expenditures exclude CORCAN (a Special Operating Agency that conducts industrial operations within penitentiaries).
Constant dollars (2002) represent dollar amounts calculated on a one-year base that adjusts for inflation, thus allowing the yearly amounts to be directly comparable. Changes in the Consumer Price Index were used to calculate constant dollars.
| Year | Current Dollars | Constant 2002 Dollars | ||||||
|---|---|---|---|---|---|---|---|---|
| Operating $’000 |
Capital | Total | Per capita $ |
Operating $’000 |
Capital | Total | Per capita | |
| 2009-10 | ||||||||
| CSC | 2,065,085 | 200,357 | 2,265,442 | 67.17 | 1,889,986 | 183,369 | 2,073,355 | 61.47 |
| PBC | 47,300 | -- | 47,300 | 1.40 | 42,289 | -- | 43,289 | 1.28 |
| OCI | 4,375 | -- | 4,375 | 0.13 | 4,004 | -- | 4,004 | 0.12 |
| Total | 2,116,760 | 200,357 | 2,317,117 | 68.70 | 1,937,279 | 183,369 | 2,120,648 | 62.88 |
| 2010-11 | ||||||||
| CSC | 2,156,955 | 22,849 | 2,379,803 | 69.73 | 1,981,066 | 20,986 | 2,185,742 | 64.05 |
| PBC | 46,000 | -- | 46,000 | 1.35 | 42,249 | -- | 42,249 | 1.24 |
| OCI | 4,162 | -- | 4,162 | 0.12 | 3,823 | -- | 3,823 | 0.11 |
| Total | 2,207,117 | 22,849 | 2,429,965 | 71.20 | 2,027,138 | 20,986 | 2,231,813 | 65.40 |
| 2011-12 | ||||||||
| CSC | 2,313,422 | 345,327 | 2,658,750 | 77.10 | 2,105,040 | 314,222 | 2,419,263 | 70.16 |
| PBC | 52,200 | -- | 52,200 | 1.51 | 47,498 | -- | 47,498 | 1.38 |
| OCI | 4,936 | -- | 4,936 | 0.14 | 4,491 | -- | 4,491 | 0.13 |
| Total | 2,370,558 | 345,327 | 2,715,886 | 78.76 | 2,157,030 | 314,222 | 2,471,252 | 71.66 |
| 2012-13 | ||||||||
| CSC | 2,204,005 | 437,736 | 2,641,742 | 76.01 | 2,019,281 | 401,048 | 2,420,331 | 69.64 |
| PBC | 46,500 | -- | 46,500 | 1.34 | 42,603 | -- | 42,603 | 1.23 |
| OCI | 4,801 | -- | 4,801 | 0.14 | 4,399 | -- | 4,399 | 0.13 |
| Total | 2,255,306 | 437,736 | 2,693,043 | 77.49 | 2,066,283 | 401,048 | 2,467,332 | 70.99 |
| 2013-14 | ||||||||
| CSC | 2,371,700 | 378,372 | 2,750,072 | 78.22 | 2,203,672 | 351,566 | 2,555,238 | 72.68 |
| PBC | 50,400 | -- | 50,400 | 1.43 | 46,829 | -- | 46,829 | 1.33 |
| OCI | 4,946 | -- | 4,946 | 0.14 | 4,596 | -- | 4,596 | 0.13 |
| Total | 2,427,046 | 378,372 | 2,805,418 | 79.79 | 2,255,097 | 351,566 | 2,606,663 | 74.14 |
Source: Correctional Service Canada; Parole Board of Canada; Office of the Correctional Investigator; Statistics Canada Consumer Price Index.
Note:
Due to rounding, constant dollar amounts may not add to “Total”.
Per capita cost is calculated by dividing the total expenditures by the total Canadian population and thus represents the cost per Canadian for federal correctional services.
Constant dollars represent dollar amounts calculated on a one-year base (2002) that adjusts for inflation allowing the yearly amounts to be directly comparable. Changes in the Consumer Price Index were used to calculate constant dollars.
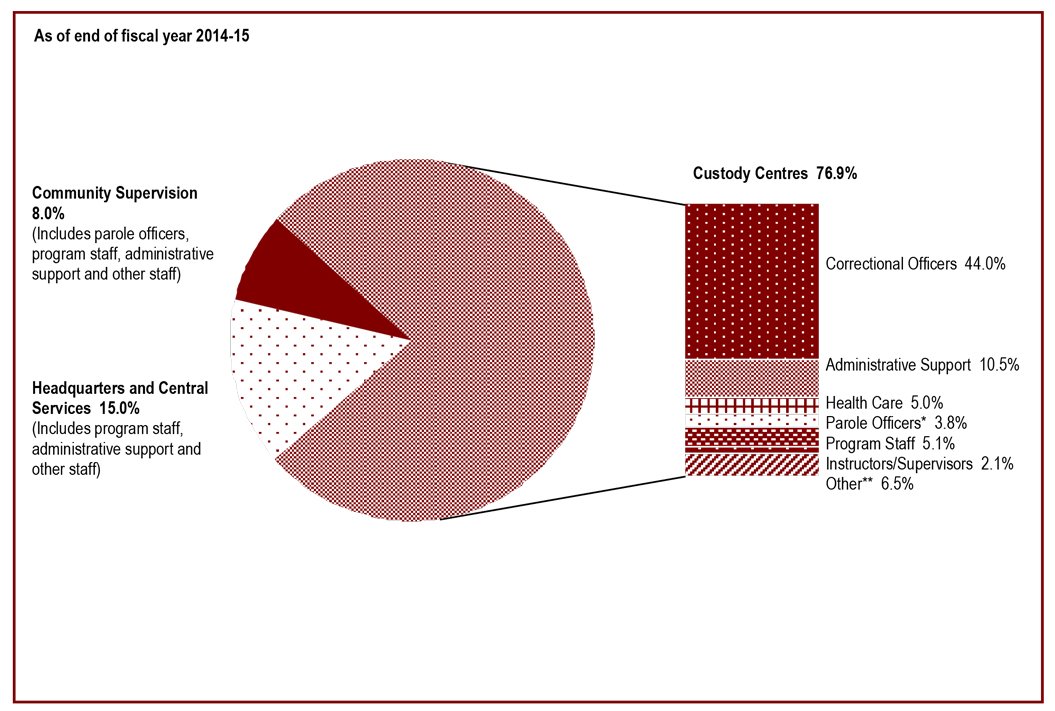
CSC employees are concentrated in custody centres
Figure B2
Source: Correctional Service Canada.
- Correctional Service Canada (CSC) has a total staff of 17,559.***
- Approximately 77% of CSC staff work in institutions.
- Staff employed in community supervision account for 8% of the total.
Note:
*These parole officers are situated within institutions, with the responsibility of preparing offenders for release.
**The “Other” category represents job classifications such as trades and food services.
***CSC has changed its definition of employee. Previously, the total number of employees included casual employees, employees on leave without pay and suspended employees. These categories have been removed from the total as of 2005-06. These numbers represent Indeterminate and Term equal to, or more than 3 months substantive employment; and Employee Status of Active and Paid Leave as of end of fiscal year 2014-15.
Due to rounding, percentages may not add to 100 percent.
| Service Area | March 31, 2006 | March 31, 2015 | ||
|---|---|---|---|---|
| # | % | |||
| Headquarters and Central Services | 2,087 | 14.5 | 2,641 | 15.0 |
| Administration | 1,699 | 11.8 | 2,256 | 12.8 |
| Health Care | 111 | 0.8 | 95 | 0.5 |
| Program Staff | 120 | 0.8 | 71 | 0.4 |
| Correctional Officers | 28 | 0.2 | 29 | 0.2 |
| Instructors/Supervisors | 10 | 0.1 | 9 | 0.1 |
| Parole Officers/Parole Supervisors | 2 | <0.1 | ||
| Other* | 119 | 0.8 | 179 | 1.0 |
| Custody Centres | 11,229 | 77.8 | 13,510 | 76.9 |
| Correctional Officers | 5,965 | 41.3 | 7,730 | 44.0 |
| Administration | 1,914 | 13.3 | 1,838 | 10.5 |
| Health Care | 779 | 5.4 | 882 | 5.0 |
| Program Staff | 534 | 3.7 | 888 | 5.1 |
| Parole Officers/Parole Supervisors** | 648 | 4.5 | 665 | 3.8 |
| Instructors/Supervisors | 387 | 2.7 | 369 | 2.1 |
| Other* | 1,002 | 6.9 | 1,138 | 6.5 |
| Community Supervision | 1,125 | 7.8 | 1,408 | 8.0 |
| Parole Officers/Parole Supervisors | 581 | 4.0 | 686 | 3.9 |
| Administration | 315 | 2.2 | 367 | 2.1 |
| Program Staff | 172 | 1.2 | 280 | 1.6 |
| Health Care | 34 | 0.2 | 74 | 0.4 |
| Correctional Officers | 22 | 0.2 | 0 | 0.0 |
| Other* | 1 | <0.1 | 1 | <0.1 |
| Total*** | 14,441 | 100.0 | 17,559 | 100.0 |
Source: Correctional Service Canada.
Note:
*These parole officers are situated within institutions, with the responsibility of preparing offenders for release.
**The "Other" category represents job classifications such as trades and food services.
***CSC has changed its definition of employee. Previously, the total number of employees included casual employees, employees on leave without pay and suspended employees. These categories have been removed from the total as of 2005-06. These numbers represent Indeterminate and Term equal to, or more than 3 months substantive employment; and Employee Status of Active and Paid Leave as of end of fiscal year 2014-15.
Due to rounding, percentages may not add to 100 percent.
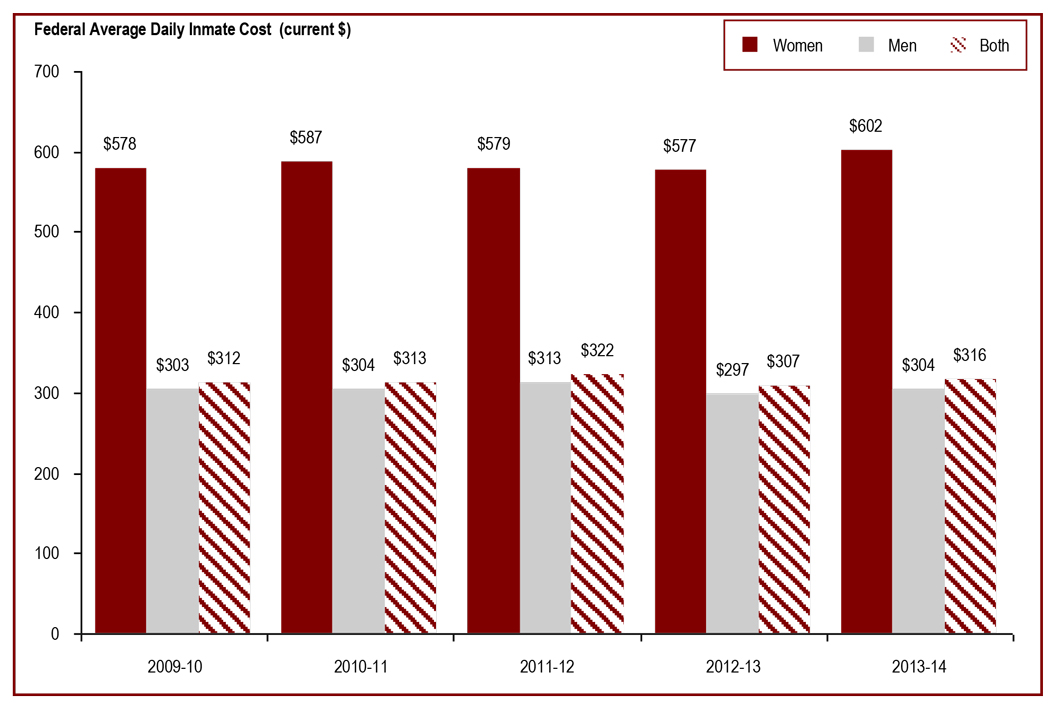
The cost of keeping an inmate incarcerated
Figure B3
Source: Correctional Service Canada.
- The federal average daily inmate cost has increased from $312 in 2009-10 to $316 in 2013-14.
- In 2013-14, the annual average cost of keeping an inmate incarcerated was $115,310 per year, up from $113,974 per year in 2009-10. In 2013-14, the annual average cost of keeping a man inmate incarcerated was $111,202 per year, whereas the annual average cost for incarcerating a woman inmate was $219,884.
- The cost associated with maintaining an offender in the community is 70% less than what it costs to maintain an offender in custody ($34,432 per year versus $115,310 per year).
Note:
The average daily inmate cost includes those costs associated with the operation of the institutions, such as salaries and employee benefit plan contributions, but excludes capital expenditures and expenditures related to CORCAN (a Special Operating Agency that conducts industrial operations within penitentiaries). Total incarcerated and community includes additional NHQ & RHQ administrative costs which are not part of the Institutional and/or Community calculations.
| Categories | Annual Average Costs per Offender (current $) | ||||
|---|---|---|---|---|---|
| 2009-10 | 2010-11 | 2011-12 | 2012-13 | 2013-14 | |
| Incarcerated Offenders | |||||
| Maximum Security (men only) | 150,808 | 147,418 | 151,484 | 148,330 | 156,768 |
| Medium Security (men only) | 98,219 | 99,519 | 104,889 | 99,207 | 101,583 |
| Minimum Security (men only) | 95,038 | 95,034 | 91,959 | 83,910 | 83,182 |
| Women’s Facilities | 211,093 | 214,614 | 211,618 | 210,695 | 219,884 |
| Exchange of Services Agreements | 89,800 | 90,712 | 97,545 | 104,828 | 108,388 |
| Incarcerated Average | 113,974 | 114,364 | 117,788 | 112,197 | 115,310 |
| Offenders in the Community | 29,537 | 31,148 | 35,101 | 33,799 | 34,432 |
| Total Incarcerated and Community | 93,916 | 96,412 | 100,622 | 95,504 | 99,923 |
Source: Correctional Service Canada.
Note:
The average daily inmate cost includes those costs associated with the operation of the institutions, such as salaries and employee benefit plan contributions, but excludes capital expenditures and expenditures related to CORCAN (a Special Operating Agency that conducts industrial operations within penitentiaries). Total incarcerated and community includes additional NHQ & RHQ administrative costs which are not part of the Institutional and/or Community calculations.
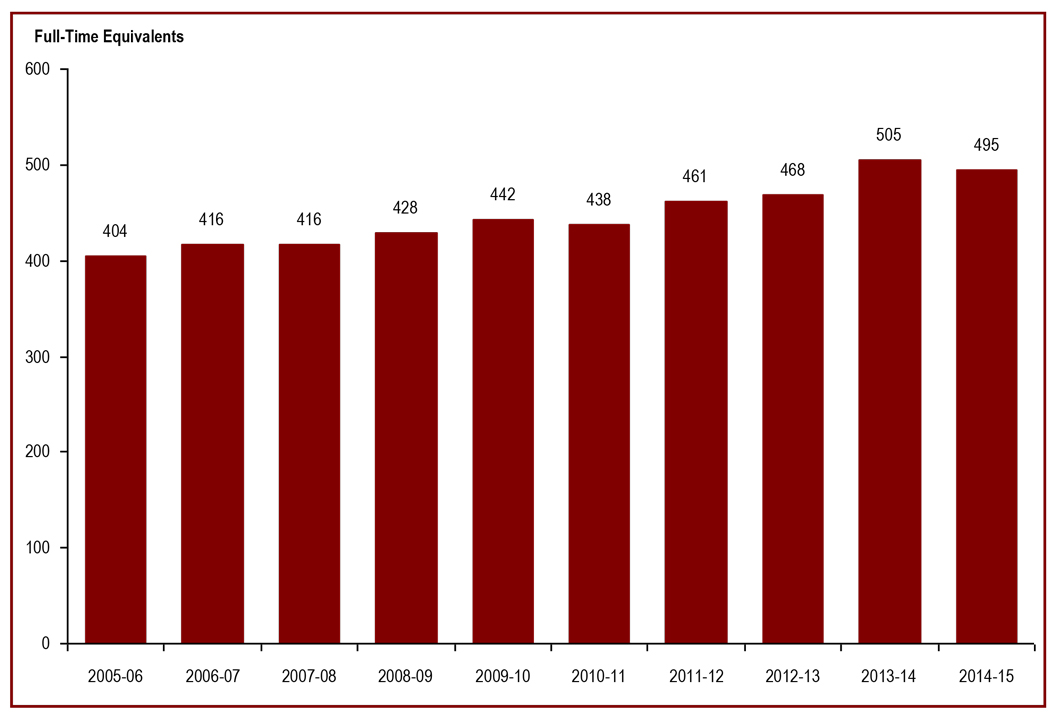
The number of Parole Board of Canada employees
Figure B4
Source: Parole Board of Canada.
- The total number of full-time equivalents used by the Parole Board of Canada has increased by 22% since 2005-06.
| Full-Time Equivalents | |||||
|---|---|---|---|---|---|
| 2010-11 | 2011-12 | 2012-13 | 2013-14 | 2014-15 | |
| Strategic Outcome* | |||||
| Conditional Release Decisions | 297 | 310 | 311 | 325 | 325 |
| Conditional Release Openness and Accountability | 57 | 60 | 56 | 53 | 54 |
| Record Suspension and Clemency Recommendations | 38 | 37 | 58 | 79 | 69 |
| Internal Services | 46 | 54 | 43 | 48 | 47 |
| Total | 438 | 461 | 468 | 505 | 495 |
| Type of Employees | |||||
| Full-time Board Members | 40 | 43 | 44 | 42 | 42 |
| Part-time Board Members | 21 | 21 | 20 | 20 | 18 |
| Staff | 377 | 397 | 404 | 443 | 435 |
| Total | 438 | 461 | 468 | 505 | 495 |
Source: Parole Board of Canada.
Note:
*As of 2006-07, the Receiver General and Treasury Board Secretariat reporting requirements have been changed from Business Line to Strategic Outcome. Consequently, data regarding Conditional Release Openness and Accountability is unavailable prior to 2006-07.
The number of employees in the Office of the Correctional Investigator
Figure B5
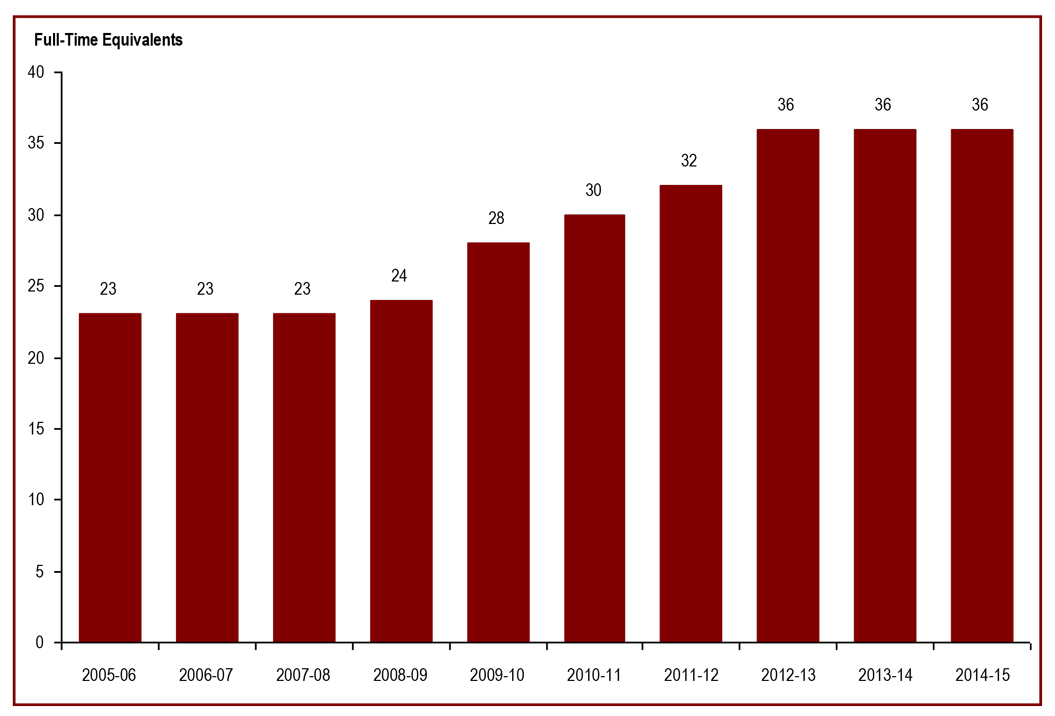
Source: Office of the Correctional Investigator.
- The total number of full-time equivalents at the Office of the Correctional Investigator was stable over the last three years.
- In 2014-15, 6,252 complaints/inquires* were received by the Office of the Correctional Investigator.
Note:
*The Office of the Correctional Investigator (OCI) may commence an investigation on receipt of a complaint by or on behalf of an offender or on its own initiative. Complaints are made by telephone, letter and during interviews with the OCI's investigative staff at federal correctional facilities. The dispositions in response to complaints involve a combination of internal responses (where the information or assistance sought by the offender can generally be provided by the OCI's investigative staff) and investigations (where, further to a review/analysis of law, policies and documentation, OCI investigative staff make an inquiry or several interventions with Correctional Service Canada and submit recommendations to address the complaint). Investigations vary considerably in terms of scope, complexity, duration and resources required.
| Full-Time Equivalents | |||||
|---|---|---|---|---|---|
| 2010-11 | 2011-12 | 2012-13 | 2013-14 | 2014-15 | |
| Type of Employees | |||||
| Correctional Investigator | 1 | 1 | 1 | 1 | 1 |
| Senior Management and Legal Counsel/Advisor | 5 | 5 | 5 | 5 | 5 |
| Investigative Services | 20 | 21 | 25 | 25 | 25 |
| Administrative Services | 4 | 5 | 5 | 5 | 5 |
| Total | 30 | 32 | 36 | 36 | 36 |
Source: Office of the Correctional Investigator.
Health Care is the most common area of offender complaint received by the Office of the Correctional Investigator
Figure B6
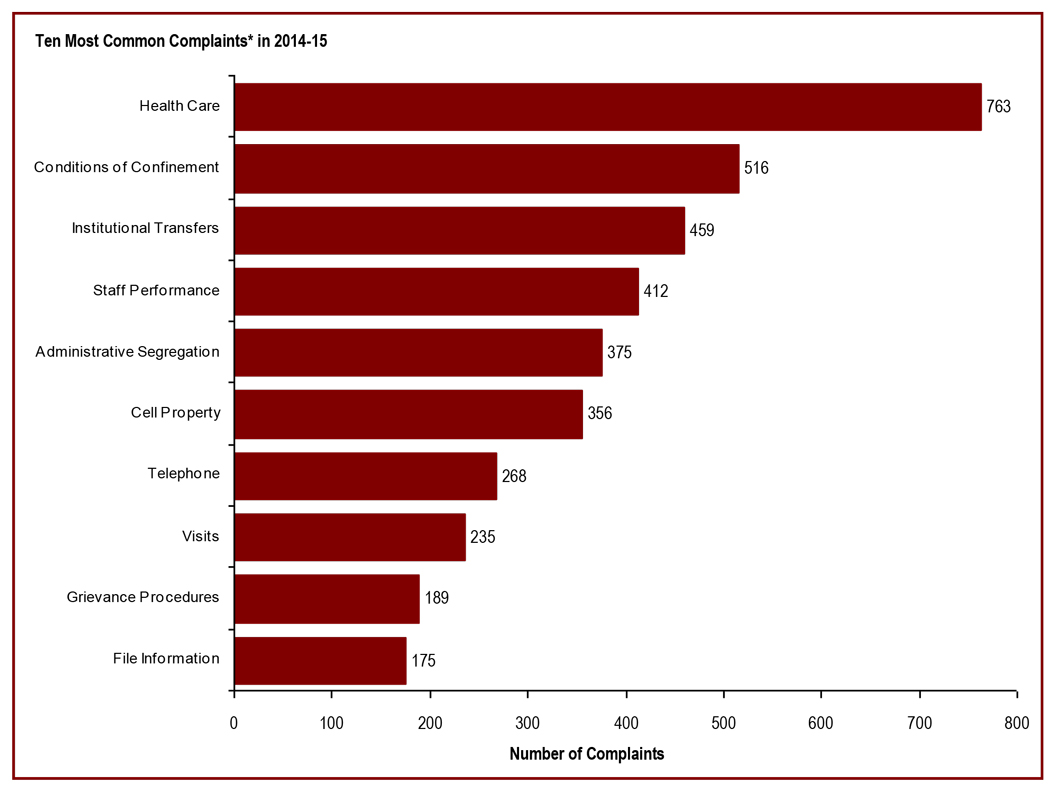
Source: Office of the Correctional Investigator.
- There were 6,252 complaints/inquires* received at the Office of the Correctional Investigator (OCI) in 2014-15.
- Health care (12.2%), conditions of confinement (8.3%), and institutional transfers (7.3%) accounted for 27.8% of all complaints.
Note:
*The Office of the Correctional Investigator (OCI) may commence an investigation on receipt of a complaint by or on behalf of an offender or on its own initiative. Complaints are made by telephone, letter and during interviews with the OCI's investigative staff at federal correctional facilities. The dispositions in response to complaints involve a combination of internal responses (where the information or assistance sought by the offender can generally be provided by the OCI's investigative staff) and investigations (where, further to a review/analysis of law, policies and documentation, OCI investigative staff make an inquiry or several interventions with Correctional Service Canada and submit recommendations to address the complaint). Investigations vary considerably in terms of scope, complexity, duration and resources required.
| Category of Complaint | Number of Complaints* | ||||
|---|---|---|---|---|---|
| 2010-11 | 2011-12 | 2012-13 | 2013-14 | 2014-15 | |
| # | # | # | # | # | |
| Health Care (including Dental) | 797 | 730 | 577 | 613 | 763 |
| Conditions of Confinement | 469 | 483 | 509 | 628 | 516 |
| Institutional Transfers | 369 | 408 | 376 | 403 | 459 |
| Staff Performance | 347 | 310 | 368 | 412 | 412 |
| Administrative Segregation | 346 | 428 | 424 | 363 | 375 |
| Cell Property | 407 | 386 | 399 | 327 | 356 |
| Telephone | 168 | 141 | 135 | 227 | 268 |
| Visits (includes Private Family Visits) | 205 | 253 | 213 | 225 | 235 |
| Grievance Procedures | 284 | 255 | 163 | 161 | 189 |
| File Information | 202 | 166 | 162 | 140 | 175 |
| Financial Matters | 78 | 108 | 109 | 138 | 172 |
| Correspondence | 115 | 127 | 84 | 85 | 144 |
| Security Classification | 135 | 92 | 115 | 98 | 139 |
| Programs/Services | 188 | 122 | 101 | 107 | 117 |
| Decisions (General) - Implementation** | 129 | 227 | 372 | 93 | 102 |
| Safety/Security of Offender | 90 | 87 | 54 | 56 | 77 |
| Mental Health | 112 | 54 | 74 | 50 | 74 |
| Harassment | 88 | 119 | 64 | 42 | 74 |
| Other*** | 1,087 | 1,061 | 943 | 957 | 1,296 |
| Outside OCI’s Terms of Reference | 187 | 232 | 235 | 309 | 309 |
| Total | 5,914 | 5,789 | 5,477 | 5,434 | 6,252 |
Source: Office of the Correctional Investigator.
Note:
*The Office of the Correctional Investigator (OCI) may commence an investigation on receipt of a complaint by or on behalf of an offender or on its own initiative. Complaints are made by telephone, letter and during interviews with the OCI's investigative staff at federal correctional facilities. The dispositions in response to complaints involve a combination of internal responses (where the information or assistance sought by the offender can generally be provided by the OCI's investigative staff) and investigations (where, further to a review/analysis of law, policies and documentation, OCI investigative staff make an inquiry or several interventions with Correctional Service Canada and submit recommendations to address the complaint). Investigations vary considerably in terms of scope, complexity, duration and resources required.
OCI has updated the categories of complaints to better reflect their corporate priorities and the changing nature of the complaints that they received in the 2010-11 fiscal year. As a result, some categories reported in previous years have been changed or removed.
- **Previously, Decisions (General) - Implementation, Correspondence, and Mental Health were reported in "Other", therefore, numbers previous to 2010-11 are not reported.
- ***“Other” refers to other types of complaints not specified in the table and includes: Cell Placement, Claims Against the Crown, Community Programs/Supervision, Conditional Release, Death or Serious Injury, Diets, Discipline, Discrimination, Double Bunking, Employment, Financial Matters, Food Services, Health and Safety - Inmate Worksites/Programs, Hunger Strike, Inmate Requests, Ion Scan/Drug Dog, Methadone, OCI, Official Languages, Operation/Decisions of the OCI, Release Procedures, Religious/ Spiritual, Safety/Security - Incompatibles/Worksite, Search and Seizure, Sentence Administration, Temporary Absence, Temporary Absence Decision, Uncategorized, Urinalysis and Use of Force. In 2010-11, Cell Placement, Conditional Release, Employment, Inmate Requests, OCI, Religious/Spiritual, Safety/Security - Incompatibles/ Worksite, and Temporary Absence were added to the “Other” category, and Correspondence, General Decision/Implementation, and Mental Health were removed.
The number of individual complaints processed by the OCI has decreased in recent years because the OCI has reallocated resources to sharpen its focus on systemic issues and death in custody investigations.
Section C: Offender Population
Offenders under the responsibility of Correctional Service of Canada
Figure C1
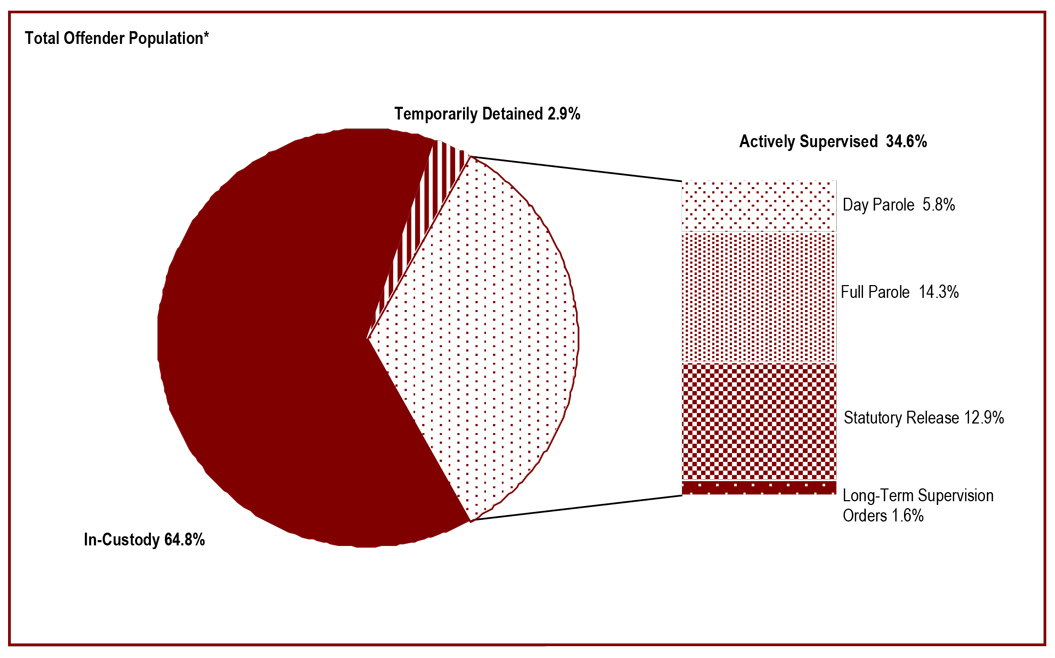
Source: Correctional Service Canada.
Definitions:
Total Offender Population includes all active offenders, who are incarcerated in a CSC facility, offenders on temporary absence from a CSC facility, offenders who are temporarily detained, offenders who are actively supervised and offenders who are unlawfully at large for less than 90 days.
In Custody includes all active offenders incarcerated in a CSC facility, offenders on temporary absence from a CSC facility, and offenders who are temporarily detained in a CSC facility.
Temporarily Detained includes offenders who are physically held in a CSC facility or a non-CSC facility after being suspended for a breach of a parole condition or to prevent a breach of parole conditions.
Actively Supervised includes all active offenders on day parole, full parole or statutory release, as well as those who are in the community on long-term supervision orders.
CSC Facilities include all federal institutions and federally funded healing lodges.
In Community Under Supervision includes all active offenders on day parole, full parole, or statutory release, or in the community supervised on a long term supervision order, offenders who are temporarily detained in a non-CSC facility, and offenders who are unlawfully at large for less than 90 days.
In addition to that Total Offender Population, there are excluded groups such as:
Federal jurisdiction offenders incarcerated in a Community Correctional Centre or in a non-CSC facility. Federal jurisdiction offenders deported/extradited including offenders for whom a deportation order has been enforced by Citizenship and Immigration Canada. Federal offenders on bail which includes offenders on judicial interim release; they have appealed their conviction or sentence and have been released to await results of a new trial. Escaped includes offenders who have absconded from either a correctional facility or while on a temporary absence and whose whereabouts are unknown. Unlawfully at Large for 90 days or more. This includes offenders who have been released to the community on day parole, full parole, statutory release, or a long-term supervision order for whom a warrant of suspension has been issued at least 90 day but has not yet been executed.
Note:
*The definition of “Offender Population” changed in the 2014 edition of the Corrections and Conditional Release Statistical Overview (CCRSO). As such, comparisons to editions of the CCRSO prior to 2014 should be done with caution.
| Status | Offenders under the responsibility of Correctional Service Canada | |||||
|---|---|---|---|---|---|---|
| # | # | # | % | % | % | |
| In Custody Population (CSC Facility) | 14,865 | 64.8 | ||||
| Incarcerated in CSC Facility | 14,203 | 61.9 | ||||
| Temporarily Detained in CSC Facility | 662 | 2.9 | ||||
| In Community under Supervision | 8,070 | 35.2 | ||||
| Temporarily Detained in non-CSC Facility | 130 | 0.6 | ||||
| Actively Supervised | 7,940 | 34.6 | ||||
| Day Parole | 1,326 | 5.8 | ||||
| Full Parole | 3,291 | 14.3 | ||||
| Statutory Release | 2,957 | 12.9 | ||||
| Long Term Supervision Order | 366 | 1.6 | ||||
| Total | 22,935* | 100.0 | ||||
Source: Correctional Service Canada.
Note:
*In addition to this total offender population, 138 offenders were on bail, 122 offenders had escaped, 180 offenders were under federal jurisdiction serving their sentence in a non-CSC facility, 327 offenders were unlawfully at large for 90 days or more, and 454 offenders were deported or on immigration hold.
The definition of "Offender Population" changed in the 2014 edition of the Corrections and Conditional Release Statistical Overview (CCRSO). As such, comparisons to editions of the CCRSO prior to 2014 should be done with caution.
The number of offenders in custody in a CSC facility decreased in 2014-15
Figure C2
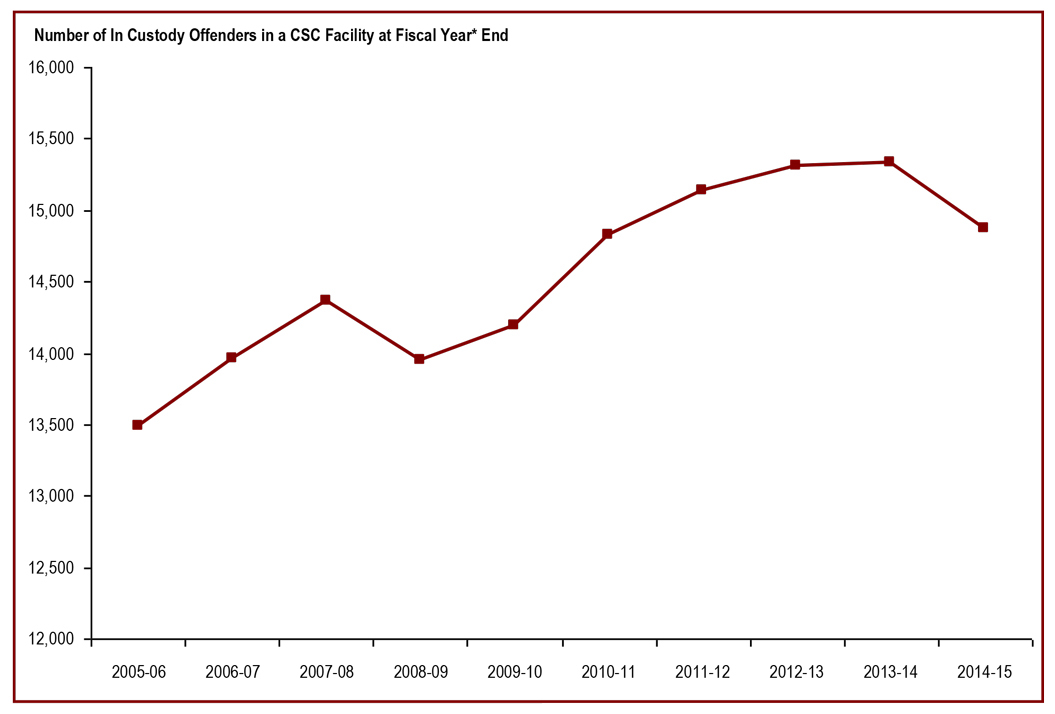
Source: Correctional Service Canada.
- The in-custody population has increased in eight of the past ten consecutive years. In 2008-09 and in 2014-15, there was a decrease in the in-custody population with a 3.0% decrease in the last year.
- From 2012-13 to 2013-14, the provincial/territorial sentenced offender population in custody decreased 11.2% from 11,138 to 9,889. The remand population decreased 16.3% from 13,739 to 11,493 during this period. Since 2005-06, the number of remanded inmates has exceeded the number of sentenced inmates in provincial/territorial custody.**
Note:
*The data reflect the number of offenders in custody at the end of each fiscal year. A fiscal year runs from April 1 to March 31 of the following year.
The term "In custody Offenders" includes all active offenders incarcerated in a CSC facility, offenders on temporary absence from a CSC facility, and offenders who are temporarily detained in a CSC facility.
**Source: Corrections Key Indicator Report for Adults and Youth, Canadian Centre for Justice Statistics, Statistics Canada
| Year | In Custody Offenders | |||||
|---|---|---|---|---|---|---|
| In Custody in a CSC Facility*1 | Provincial/Territorial2 | Total | ||||
| Sentenced | Remand | Other/Temporary Detention | Total | |||
| 2005-06 | 13,488 | 9,476 | 11,040 | 277 | 20,794 | 34,282 |
| 2006-07 | 13,960 | 10,032 | 12,169 | 283 | 22,484 | 36,444 |
| 2007-08 | 14,362 | 9,799 | 12,973 | 315 | 23,086 | 37,448 |
| 2008-09 | 13,950 | 9,931 | 13,548 | 311 | 23,790 | 37,740 |
| 2009-10 | 14,185 | 10,045 | 13,739 | 308 | 24,092 | 38,277 |
| 2010-11 | 14,824 | 10,922 | 13,086 | 427 | 24,435 | 39,259 |
| 2011-12 | 15,136 | 11,138 | 13,369 | 308 | 24,814 | 39,950 |
| 2012-13 | 15,313 | 11,138 | 13,739 | 308 | 25,185 | 40,498 |
| 2013-14 | 15,327 | 9,889 | 11,493 | 321 | 21,704 | 37,031 |
| 2013-14 | 14,865 | -- | -- | -- | -- | -- |
Source: 1Correctional Service Canada.; 2Corrections Key Indicator Report for Adults and Youth, Canadian Centre for Justice Statistics, Statistics Canada
Note:
*Data reflects the number of offenders in custody at the end of each fiscal year. A fiscal year runs from April 1 to March 31 of the following year.
The term "In Custody in a CSC Facility" includes all active offenders incarcerated in a CSC facility, offenders on temporary absence from a CSC facility, and offenders who are temporarily detained in a CSC facility.
The figures for provincial and territorial offenders reflect annual average counts.
-- Data not available.
The number of admissions to federal jurisdiction has fluctuated
Figure C3
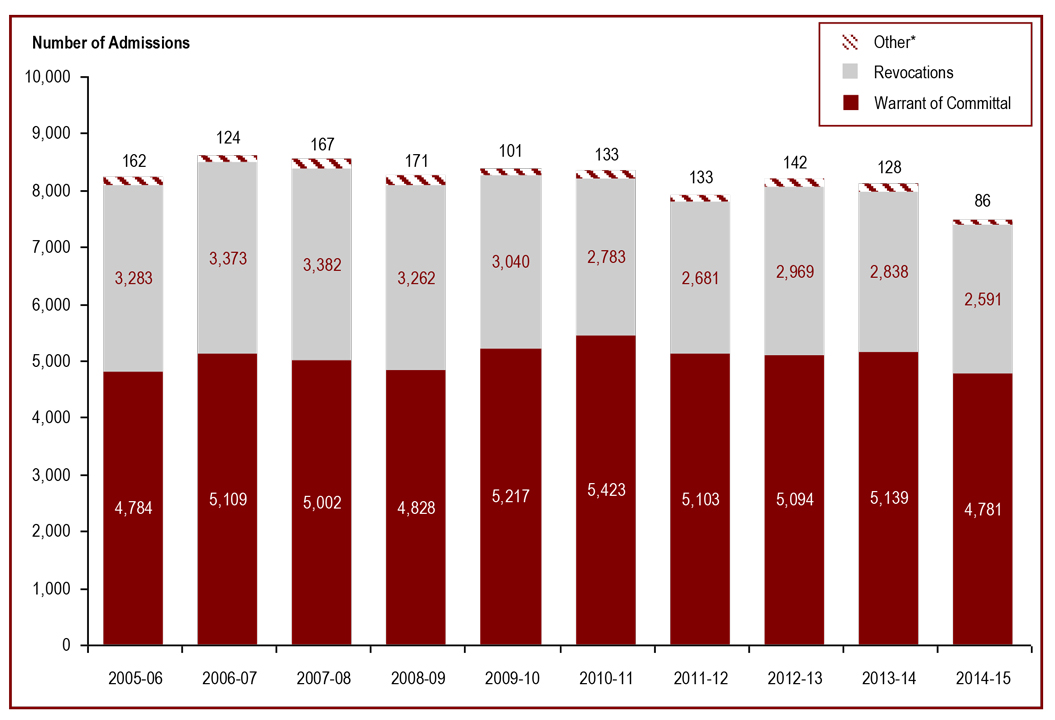
Source: Correctional Service Canada.
- The number of warrant of committal admissions has fluctuated over the past decade but has declined by 7.0% in the last year.
- After peaking at 8,606 in 2006-07, the number of admissions has decreased by 13.3% to 7,458 in 2014-15.
- The number of women admitted to federal jurisdiction under warrants of committal increased 9.0% from 333 in 2010-11 to 363 in 2014-15.
Note:
*“Other” includes transfers from other jurisdictions (exchange of services), terminations, transfers from foreign countries, and admissions where a release is interrupted as a consequence of a new conviction.
These numbers refer to the federal jurisdiction admissions during each fiscal year and may be greater than the actual number of offenders admitted, since an individual offender may be admitted more than once in a given year. A fiscal year runs from April 1 to March 31 of the following year.
| 2010-11 | 2011-12 | 2012-13 | 2013-14 | 2014-15 | ||||||
|---|---|---|---|---|---|---|---|---|---|---|
| Women | Men | Women | Men | Women | Men | Women | Men | Women | Men | |
| Warrant of Committal | ||||||||||
| 1st Federal Sentence | 294 | 3,701 | 302 | 3,490 | 227 | 3,521 | 289 | 3,574 | 321 | 3,343 |
| All Others | 39 | 1,389 | 43 | 1,268 | 45 | 1,301 | 40 | 1,236 | 42 | 1,075 |
| Subtotal | 333 | 5,090 | 345 | 4,758 | 272 | 4,822 | 329 | 4,810 | 363 | 4,418 |
| Total | 5,423 | 5,103 | 5,094 | 5,139 | 4,781 | |||||
| Revocations | 153 | 2,630 | 135 | 2,546 | 140 | 2,829 | 121 | 2,717 | 136 | 2,455 |
| Total | 2,783 | 2,681 | 2,969 | 2,838 | 2,591 | |||||
| Other* | 8 | 125 | 17 | 116 | 15 | 127 | 6 | 122 | 7 | 79 |
| Total | 133 | 133 | 142 | 128 | 86 | |||||
| 494 | 7,845 | 497 | 7,420 | 427 | 7,778 | 456 | 7,649 | 506 | 6,952 | |
| Total Admissions | 8,339 | 7,917 | 8,205 | 8,105 | 7,458 | |||||
Source: Correctional Service Canada.
Note:
*“Other” includes transfers from other jurisdictions (exchange of services), terminations, transfers from foreign countries, and admissions where a release is interrupted as a consequence of a new conviction.
These numbers refer to the federal jurisdiction admissions during each fiscal year and may be greater than the actual number of offenders admitted, since an individual offender may be admitted more than once in a given year. A fiscal year runs from April 1 to March 31 of the following year.
The number of women admitted from the courts to federal Jurisdiction increased in 2014-15
Figure C4
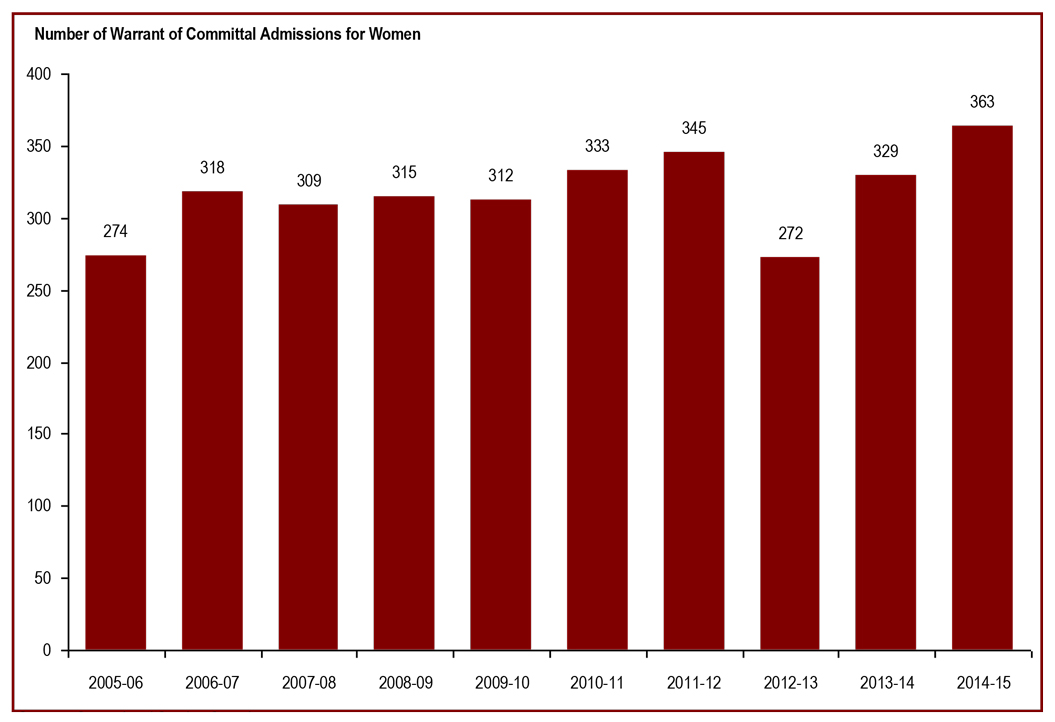
Source: Correctional Service Canada.
- In the last ten years, the number of women admitted to federal jurisdiction increased 32.5% from 274 in 2005-06 to 363 in 2014-15. During the same time period, there was a small decrease in the number of men admitted to federal jurisdiction from 4,510 in 2005-06 to 4,418 in 2014-15.
- Overall, women continue to represent a small proportion of the total number of admissions (i.e., 7.6% in 2014-15).
- At the end of fiscal year 2014-15, there were 676 women incarcerated within Correctional Service Canada facilities.
Note:
A warrant of committal is a new admission to federal jurisdiction from the courts.
| Year | Warrant of Committal Admissions | Total | |||
|---|---|---|---|---|---|
| Women | Men | ||||
| # | % | # | % | ||
| 2005-06 | 274 | 5.7 | 4,510 | 94.3 | 4,784 |
| 2006-07 | 318 | 6.2 | 4,791 | 93.8 | 5,109 |
| 2007-08 | 309 | 6.2 | 4,693 | 93.8 | 5,002 |
| 2008-09 | 315 | 6.5 | 4,513 | 93.5 | 4,828 |
| 2009-10 | 312 | 6.0 | 4,905 | 94.0 | 5,217 |
| 2010-11 | 333 | 6.1 | 5,090 | 93.9 | 5,423 |
| 2011-12 | 345 | 6.8 | 4,758 | 93.2 | 5,103 |
| 2012-13 | 272 | 5.3 | 4,822 | 94.7 | 5,094 |
| 2013-14 | 329 | 6.4 | 4,810 | 93.6 | 5,139 |
| 2014-15 | 363 | 7.6 | 4,418 | 92.4 | 4,781 |
Source: Correctional Service Canada.
Note:
A warrant of committal is a new admission to federal jurisdiction from the courts.
Over half of the total offender population in CSC facilities is serving a sentence of less than 5 years
Figure C5
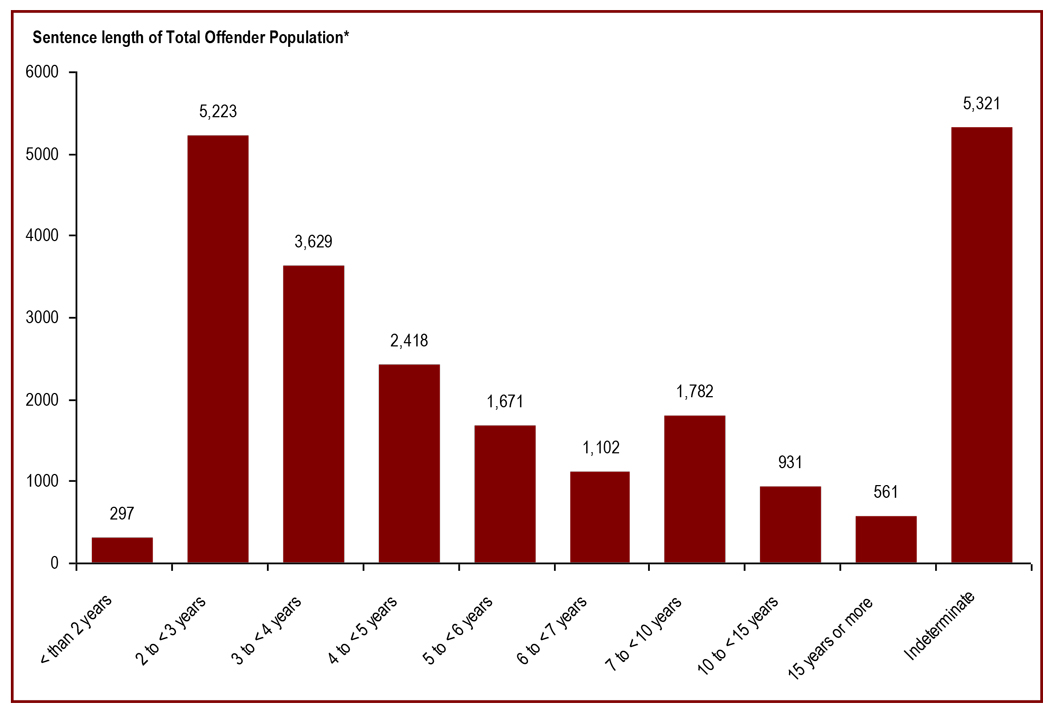
Source: Correctional Service Canada.
- In 2014-15, about half (50.4%) of the total offender population* was serving a sentence of less than 5 years with 22.8% serving a sentence between two years and less than three years.
- Almost one quarter (23.2%) of the total offender population* was serving an indeterminate sentence. The total number of offenders with indeterminate sentences has increased 6.8% since 2010-11 from 4,984 to 5,321 in 2014-15.
Note:
Total Offender Population includes all active offenders who are incarcerated in a CSC facility, offenders on temporary absence from a CSC facility, offenders who are temporarily detained, offenders who are actively supervised, and offenders who are unlawfully at large for less than 90 days.
Offenders serving a sentence less than 2 years includes offenders transferred from foreign countries or offenders under a long term supervision order who received a new sentence of less than 2 years.
| Sentence Length | 2010-11 | 2011-12 | 2012-13 | 2013-14 | 2014-15 | |||||
|---|---|---|---|---|---|---|---|---|---|---|
| # | % | # | % | # | % | # | % | # | % | |
| < than 2 years | 277 | 1.2 | 262 | 1.1 | 280 | 1.2 | 294 | 1.3 | 297 | 1.3 |
| 2 years to < 3 years | 5,927 | 26.2 | 5,785 | 25.3 | 5,467 | 23.8 | 5,298 | 22.9 | 5,223 | 22.8 |
| 3 years to < 4 years | 3,519 | 15.5 | 3,626 | 15.8 | 3,729 | 16.2 | 3,767 | 16.3 | 3,629 | 15.8 |
| 4 years to < 5 years | 2,202 | 9.7 | 2,290 | 10.0 | 2,363 | 10.3 | 2,447 | 10.6 | 2,418 | 10.5 |
| 5 years to < 6 years | 1,516 | 6.7 | 1,577 | 6.9 | 1,598 | 7.0 | 1,635 | 7.1 | 1,671 | 7.3 |
| 6 years to < 7 years | 996 | 4.4 | 999 | 4.4 | 1,083 | 4.7 | 1,099 | 4.7 | 1,102 | 4.8 |
| 7 years to < 10 years | 1,580 | 7.0 | 1,656 | 7.2 | 1,722 | 7.5 | 1,790 | 7.7 | 1,782 | 7.8 |
| 10 years to < 15 years | 988 | 4.4 | 978 | 4.3 | 961 | 4.2 | 955 | 4.1 | 931 | 4.1 |
| 15 years and more | 674 | 3.0 | 630 | 2.8 | 608 | 2.6 | 611 | 2.6 | 561 | 2.4 |
| Indeterminate | 4,984 | 22.0 | 5,098 | 22.3 | 5,167 | 22.5 | 5,258 | 22.7 | 5,321 | 23.2 |
| Total | 22,663 | 100 | 22,901 | 100 | 22,978 | 100 | 23,154 | 100 | 22,935 | 100 |
Source: Correctional Service Canada.
Note:
Total Offender Population includes all active offenders who are incarcerated in a CSC facility, offenders on temporary absence from a CSC facility, offenders who are temporarily detained, offenders who are actively supervised, and offenders who are unlawfully at large for less than 90 days.
Offenders serving a sentence less than 2 years includes offenders transferred from foreign countries or offenders under a long term supervision order who received a new sentence of less than 2 years.
Offender age at admission to federal jurisdiction is increasing
Figure C6
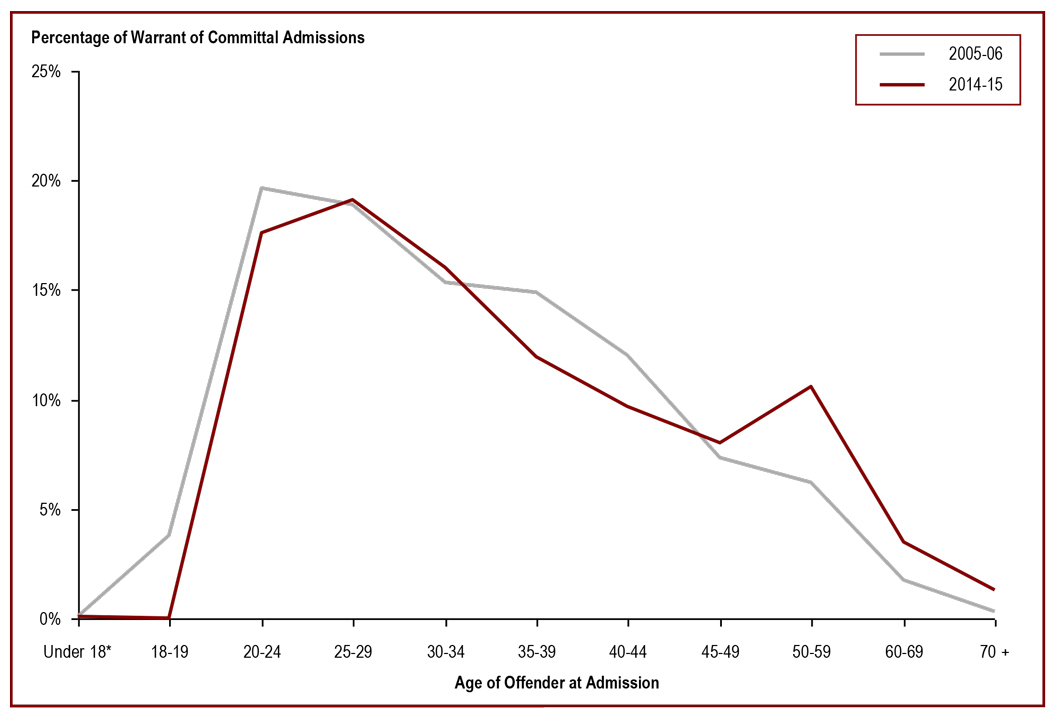
Source: Correctional Service Canada.
- In 2014-15, 36.7% of offenders admitted to federal jurisdiction were between the ages of 20 and 29, and 28.0% were between 30 and 39 years of age.
- The distribution of age upon admission is similar for both men and women, except for the ages between 25-29 where there was a 5.9% difference.
- The median age of the population upon admission in 2014-15 was 33, compared to a median age of 32 in 2005-06.
- The number of offenders between the ages of 40 and 49 at admission decreased from 925 in 2005-06 to 848 in 2014-15, representing an 8.3% decrease.
- The number of offenders between the ages of 50 and 59 at admission significantly increased from 295 in 2005-06 to 505 in 2014-15.
Note:
*These six offenders include 5 offenders admitted to a youth correctional centre and one offender who was admitted to federal jurisdiction by the courts. A warrant of committal is a new admission to federal jurisdiction from the courts.
Due to rounding, percentages may not add to 100 percent.
| Age at Admission | 2005-06 | 2014-15 | ||||||||||
|---|---|---|---|---|---|---|---|---|---|---|---|---|
| Women | Men | Total | Women | Men | Total | |||||||
| # | % | # | % | # | % | # | % | # | % | # | % | |
| Under 18 | 0 | 0.0 | 6* | 0.1 | 6 | 0.1 | 0 | 0.0 | 1** | 0.0 | 1 | 0.0 |
| 18 and 19 | 3 | 1.1 | 178 | 3.9 | 181 | 3.8 | 9 | 2.5 | 98 | 2.2 | 107 | 2.2 |
| 20 to 24 | 51 | 18.6 | 885 | 19.6 | 936 | 19.6 | 56 | 15.4 | 787 | 17.8 | 843 | 17.6 |
| 25 to 29 | 68 | 24.8 | 835 | 18.5 | 903 | 18.9 | 89 | 24.5 | 824 | 18.7 | 913 | 19.1 |
| 30 to 34 | 41 | 15.0 | 689 | 15.3 | 730 | 15.3 | 64 | 17.6 | 703 | 15.9 | 767 | 16.0 |
| 35 to 39 | 48 | 17.5 | 664 | 14.7 | 712 | 14.9 | 36 | 9.9 | 534 | 12.1 | 570 | 11.9 |
| 40 to 44 | 35 | 12.8 | 539 | 12.0 | 574 | 12.0 | 34 | 9.4 | 430 | 9.7 | 464 | 9.7 |
| 45 to 49 | 16 | 5.8 | 335 | 7.4 | 351 | 7.3 | 30 | 8.3 | 354 | 8.0 | 384 | 8.0 |
| 50 to 59 | 10 | 3.6 | 285 | 6.3 | 295 | 6.2 | 37 | 10.2 | 468 | 10.6 | 505 | 10.6 |
| 60 to 69 | 2 | 0.7 | 81 | 1.8 | 83 | 1.7 | 7 | 1.9 | 160 | 3.6 | 167 | 3.5 |
| 70 and over | 0 | 0.0 | 13 | 0.3 | 13 | 0.3 | 1 | 0.3 | 59 | 1.3 | 60 | 1.3 |
| Total | 274 | 4,510 | 4,784 | 363 | 4,418 | 4,781 | ||||||
Source: Correctional Service Canada.
Note:
*These six offenders include 5 offenders admitted to a youth correctional centre and one offender who was admitted to federal jurisdiction by the courts.
**This offender was admitted to a youth correctional centre.
A warrant of committal is a new admission to federal jurisdiction from the courts.
Due to rounding, percentages may not add to 100 percent.
The average age at admission is lower for Aboriginal offenders than for non-Aboriginal offenders
Figure C7
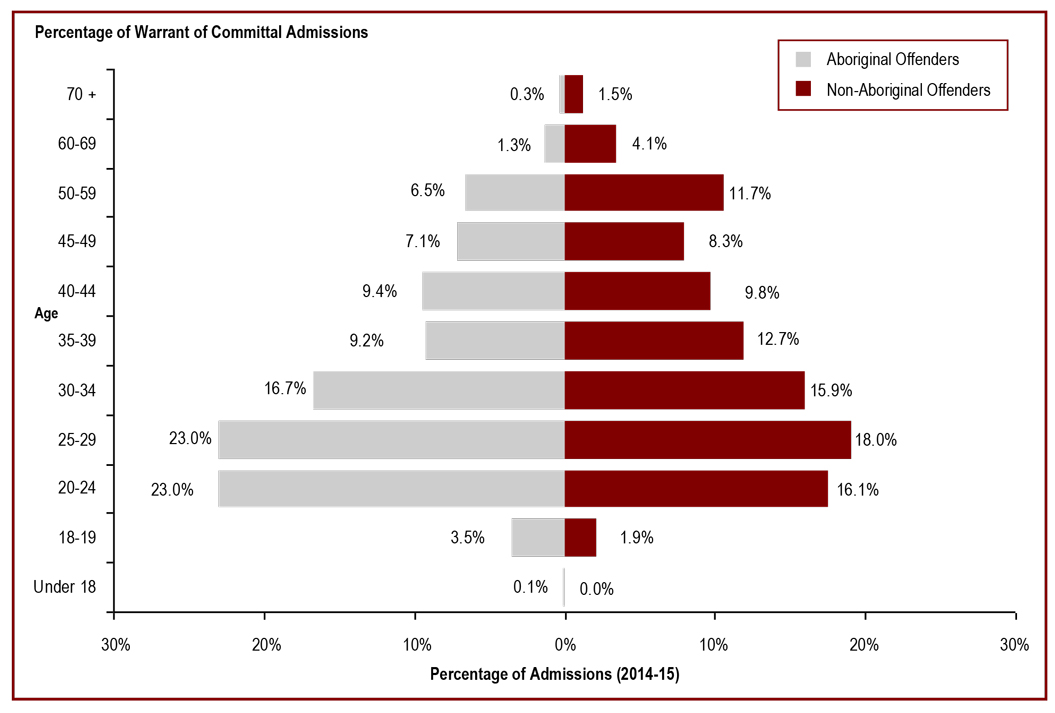
Source: Correctional Service Canada.
- Of those offenders admitted to federal jurisdiction in 2014-15, 49.6% of Aboriginal offenders were under the age of 30, compared to 36.0% of non-Aboriginal offenders.
- The median age of Aboriginal offenders at admission is 30, compared to a median age of 34 for non-Aboriginal offenders.
- The median age of Aboriginal women offenders at admission is 29, compared to a median age of 32 for non-Aboriginal women offenders.
Note:
A warrant of committal is a new admission to federal jurisdiction from the courts.
Due to rounding, percentages may not add to 100 percent.
| Age at Admission | 2005-06 | 2014-15 | ||||||||||
|---|---|---|---|---|---|---|---|---|---|---|---|---|
| Aboriginal | Non-Aboriginal | Total | Aboriginal | Non-Aboriginal | Total | |||||||
| # | % | # | % | # | % | # | % | # | % | # | % | |
| Under 18 | 2 | 0.2 | 4 | 0.1 | 6 | 0.1 | 1 | 0.1 | 0 | 0.0 | 1 | 0.0 |
| 18 and 19 | 55 | 5.8 | 126 | 3.3 | 181 | 3.8 | 37 | 3.5 | 70 | 1.9 | 107 | 2.2 |
| 20 to 24 | 225 | 23.8 | 711 | 18.5 | 936 | 19.6 | 241 | 23.0 | 602 | 16.1 | 843 | 17.6 |
| 25 to 29 | 209 | 22.1 | 694 | 18.1 | 903 | 18.9 | 241 | 23.0 | 672 | 18.0 | 913 | 19.1 |
| 30 to 34 | 142 | 15.0 | 588 | 15.3 | 730 | 15.3 | 175 | 16.7 | 592 | 15.9 | 767 | 16.0 |
| 35 to 39 | 125 | 13.2 | 587 | 15.3 | 712 | 14.9 | 96 | 9.2 | 474 | 12.7 | 570 | 11.9 |
| 40 to 44 | 95 | 10.0 | 479 | 12.5 | 574 | 12.0 | 99 | 9.4 | 365 | 9.8 | 464 | 9.7 |
| 45 to 49 | 50 | 5.3 | 301 | 7.8 | 351 | 7.3 | 74 | 7.1 | 310 | 8.3 | 384 | 8.0 |
| 50 to 59 | 38 | 4.0 | 257 | 6.7 | 295 | 6.2 | 68 | 6.5 | 437 | 11.7 | 505 | 10.6 |
| 60 to 69 | 6 | 0.6 | 77 | 2.0 | 83 | 1.7 | 14 | 1.3 | 153 | 4.1 | 167 | 3.5 |
| 70 and over | 0 | 0.0 | 13 | 0.3 | 13 | 0.3 | 3 | 0.3 | 57 | 1.5 | 60 | 1.3 |
| Total | 947 | 3,837 | 4,784 | 1,049 | 3,732 | 4,781 | ||||||
Source: Correctional Service Canada.
Note:
A warrant of committal is a new admission to federal jurisdiction from the courts.
Due to rounding, percentages may not add to 100 percent.
24% of the in-custody offender population is aged 50 or over
Figure C8

Source: Correctional Service Canada; Statistics Canada.
- In 2014-15, 55.0% of in-custody offenders were under the age of 40.
- In 2014-15, 23.5% of the in-custody offender population was aged 50 and over.
- The community offender population was older than the in-custody population; 36.6% of offenders in the community were aged 50 and over, compared to 23.5% of the in-custody offenders in this age group.
Note:
*In-custody Population includes all active offenders incarcerated in a CSC facility, offenders on temporary absence from a CSC facility, and offenders who are temporarily detained in a CSC facility.
**2014 Postcensal Estimates, Demography Division, Statistics Canada and include only those age 18 and older.
In community under supervision includes all active offenders on day parole, full parole, statutory release, or in the community supervised on a long term supervision order, offenders who are temporarily detained in a non-CSC facility, and offenders who are unlawfully at large for less than 90 days.
Due to rounding, percentages may not add to 100 percent.
| Age | In-Custody | In Community Under Supervision | Total | % of Canadian Adult Population* | |||
|---|---|---|---|---|---|---|---|
| # | % | # | % | # | % | % | |
| Under 18 | 0 | 0.0 | 0 | 0.0 | 0 | 0.0 | 0.0 |
| 18 and 19 | 70 | 0.5 | 1 | 0.0 | 71 | 0.3 | 3.2 |
| 20 to 24 | 1,595 | 10.7 | 501 | 6.2 | 2,096 | 9.1 | 8.6 |
| 25 to 29 | 2,392 | 16.1 | 979 | 12.1 | 3,371 | 14.7 | 8.5 |
| 30 to 34 | 2,251 | 15.1 | 1,072 | 13.3 | 3,323 | 14.5 | 8.7 |
| 35 to 39 | 1,863 | 12.5 | 874 | 10.8 | 2,737 | 11.9 | 8.3 |
| 40 to 44 | 1,623 | 10.9 | 840 | 10.4 | 2,463 | 10.7 | 8.2 |
| 45 to 49 | 1,577 | 10.6 | 848 | 10.5 | 2,425 | 10.6 | 8.7 |
| 50 to 54 | 1,380 | 9.3 | 874 | 10.8 | 2,254 | 9.8 | 9.7 |
| 55 to 59 | 906 | 6.1 | 702 | 8.7 | 1,608 | 7.0 | 8.9 |
| 60 to 64 | 569 | 3.8 | 535 | 6.6 | 1,104 | 4.8 | 7.6 |
| 65 to 69 | 361 | 2.4 | 405 | 5.0 | 766 | 3.3 | 64 |
| 70 and over | 278 | 1.9 | 439 | 5.4 | 717 | 3.1 | 13.1 |
| Total | 14,865 | 100.0 | 8,070 | 100.0 | 22,935 | 100.0 | 100.0 |
Source: Correctional Service Canada; Statistics Canada.
Note:
*2014 Postcensal Estimates, Demography Division, Statistics Canada and include only those age 18 and older.
In-custody population includes all active offenders incarcerated in a CSC facility, offenders on temporary absence from a CSC facility, and offenders who are temporarily detained in a CSC facility.
In community under supervision includes all active offenders on day parole, full parole, statutory release, or in the community supervised on a long term supervision order, offenders who are temporarily detained in a non-CSC facility, and offenders who are unlawfully at large for less than 90 days.
Due to rounding, percentage may not add to 100 percent.
60% of offenders are Caucasian
Figure C9
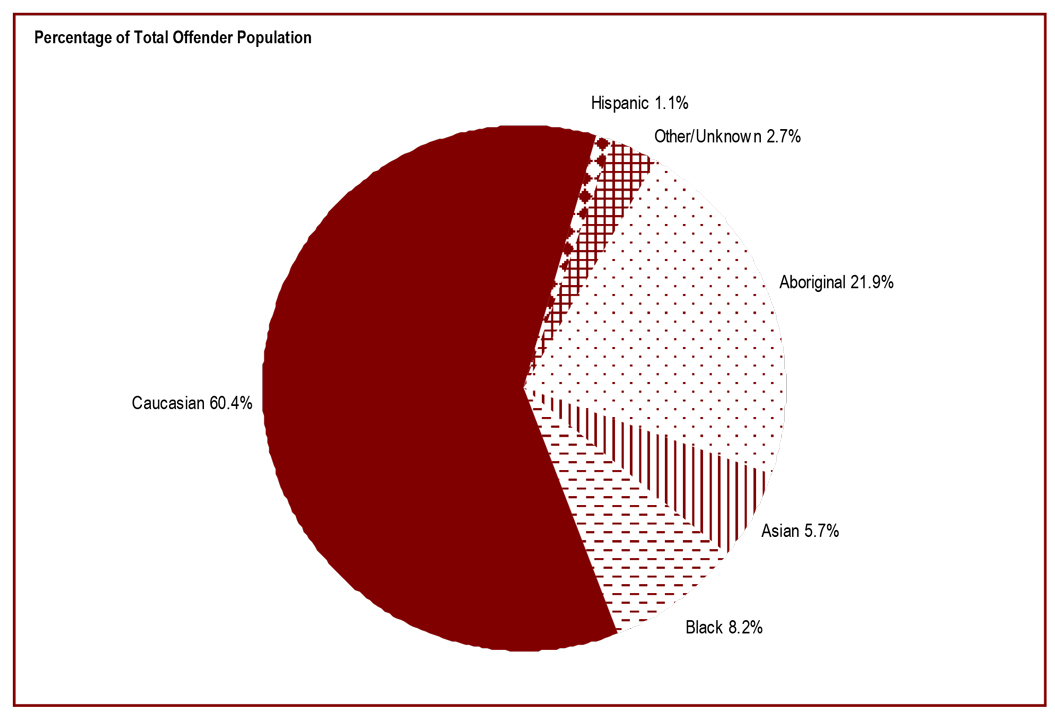
Source: Correctional Service Canada.
- The federal offender population is becoming more diverse, as evidenced by the decrease in the proportion of Caucasian offenders (from 64.4% in 2010-11 to 60.4% in 2014-15).
- Between 2010-11 and 2014-15, the Aboriginal population has increased by 17.1% (from 4,285 to 5,016).
Note:
The offenders themselves identify to which race they belong. The list of categories may not fully account for all races and the race groupings information has changed; therefore, the comparisons between 2010-11 and 2014-15 should be done with caution.
“Aboriginal” includes offenders who are Inuit, Innu, Métis and North American Indian.
"Asian" includes offenders who are Arab, Arab/West Asian, Asian-East and Southeast, Asian-South, Asian West, Asiatic, Chinese, East Indian, Filipino, Japanese, Korean, South Asian, South East Asian.
“Hispanic” includes offenders who are Hispanic and Latin American.
“Black” includes offenders who are black.
“Other/Unknown” includes offenders who are European French, European-Eastern, European-Northern, European-Southern, European-Western, Multiracial/Ethnic, Oceania, British Isles, Caribbean, Sub-Sahara African, offenders unable to identify to one race, other and unknown.
The data reflects the total offender population, which includes all active offenders who are incarcerated in a CSC facility, offenders on temporary absence from a CSC facility, and offenders who are temporarily detained, offenders who are actively supervised, and offenders who are unlawfully at large for less than 90 days.
The data reflect the number of offenders active at the end of each fiscal year. A fiscal year runs from April 1 to March 31 of the following year.
Due to rounding, percentages may not add to 100 percent.
| Total Offender Population | ||||
|---|---|---|---|---|
| 2010-11 | 2014-15 | |||
| # | % | # | % | |
| Aboriginal | 4,285 | 18.9 | 5,016 | 21.9 |
| Inuit | 198 | 0.9 | 238 | 1.0 |
| Métis | 1,093 | 4.8 | 1,381 | 6.0 |
| North American Indian | 2,994 | 13.2 | 3,397 | 14.8 |
| Asian | 1,121 | 4.9 | 1,305 | 5.7 |
| Arab/West Asian | 268 | 1.2 | 344 | 1.5 |
| Asiatic* | 52 | 0.2 | 269 | 1.2 |
| Chinese | 134 | 0.6 | 131 | 0.6 |
| East Indian | 21 | 0.1 | 13 | 0.1 |
| Filipino | 64 | 0.3 | 71 | 0.3 |
| Japanese | 1 | 0.0 | 5 | 0.0 |
| Korean | 20 | 0.1 | 21 | 0.1 |
| South East Asian | 365 | 1.6 | 272 | 1.2 |
| South Asian | 196 | 0.9 | 179 | 0.8 |
| Black | 1,818 | 8.0 | 1,887 | 8.2 |
| Caucasian | 14,597 | 64.4 | 13,859 | 60.4 |
| Hispanic | 209 | 0.9 | 249 | 1.1 |
| Hispanic | 10 | 0.0 | 6 | 0.0 |
| Latin American | 199 | 0.9 | 243 | 1.1 |
| Other/Unknown | 633 | 2.8 | 619 | 2.7 |
| Total | 22,663 | 100.0 | 22,935 | 100.0 |
Source: Correctional Service Canada.
Note:
*Due to changes in categorization of races, 2013-14 “Asiatic” category includes Asian-East and Southeast/Asian South/Asian West/Asiatic.
The offenders themselves identify to which race they belong. The list of categories may not fully account for all races and the race groupings information has changed; therefore, the comparisons between 2010-11 and 2014-15 should be done with caution.
“Aboriginal” includes offenders who are Inuit, Innu, Métis and North American Indian.
"Asian" includes offenders who are Arab, Arab/West Asian, Asian-East and Southeast, Asian-South, Asian West, Asiatic, Chinese, East Indian, Filipino, Japanese, Korean, South Asian, South East Asian.n.
“Hispanic” includes offenders who are Hispanic and Latin American.
“Black” includes offenders who are black.
"Other/Unknown" includes offenders who are European French, European-Eastern, European-Northern, European-Southern, European-Western, Multiracial/Ethnic, Oceania, British Isles, Caribbean, Sub-Sahara African, offenders unable to identify to one race, other and unknown.
The data reflects the total offender population, which includes all active offenders who are incarcerated in a CSC facility, offenders on temporary absence from a CSC facility, and offenders who are temporarily detained, offenders who are actively supervised, and offenders who are unlawfully at large for less than 90 days.
The data reflect the number of offenders active at the end of each fiscal year. A fiscal year runs from April 1 to March 31 of the following year.
Due to rounding, percentages may not add to 100 percent.
The religious identification of the offender population is diverse
Figure C10
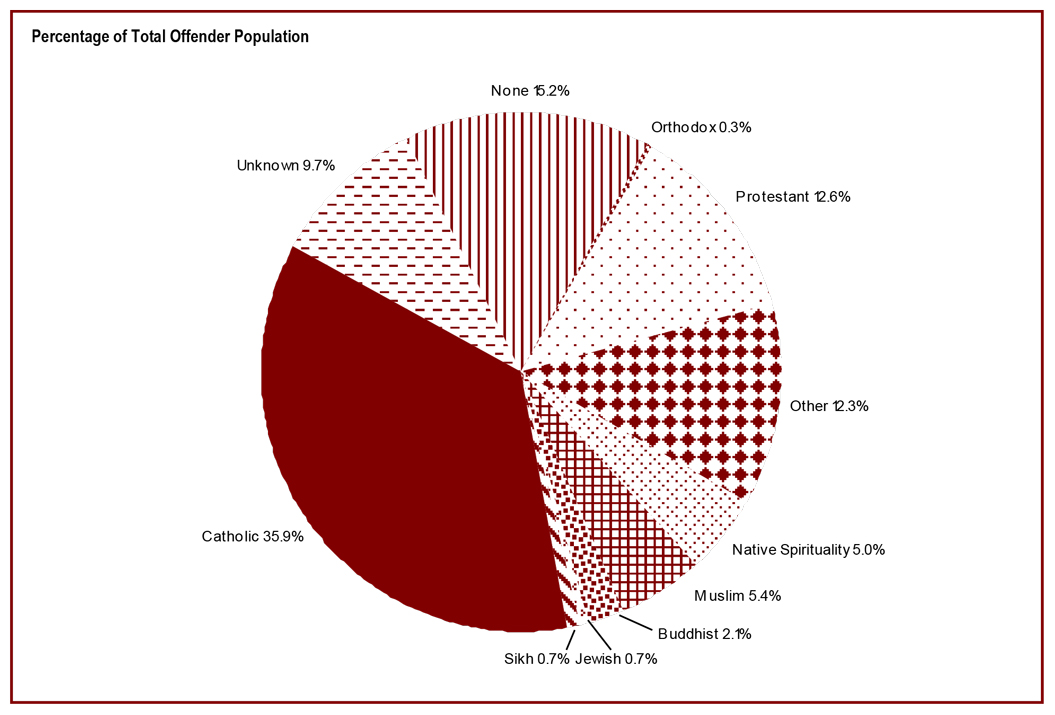
Source: Correctional Service Canada.
- The religious identification of the Offender population was diverse. While the proportion of offenders who identified as Catholic or Protestant still represented the majority, their proportions decreased from 56.7% in 2010-11 to 48.5% in 2014-15.
- Religious identification was unknown for 9.7% of offenders, whereas 15.2% stated they had no religion.
Note:
Religious identification is self-declared by offenders while they are incarcerated, and the categories are not comprehensive; therefore, the reader should interpret these data with caution.
Catholic includes offenders who are Catholic, Roman-Catholic, Greek-Catholic, Native-Catholic and Ukrainian-Catholic.
Orthodox includes offenders who are Greek Orthodox, Russian Orthodox and Ukrainian Orthodox.
Protestant includes offenders who are Anglican, Baptist, Christian Missionary, Christian Reform, Hutterite, Lutheran, Mennonite, Moravian, Native Spirit, Nazarene Christ, Pentecostal, Philad. Church God, Presbyterian, Protestant, Salvation Army, Seventh Day Adventist, United Church, Christ Methodist, Christ Wesleyan and Worldwide Church.
Buddhist includes offenders who are Buddhist, Mahayana Buddhist and Theravadan Buddhist.
Other includes other declared identifications such as Agnostic, Asatruar Pagan, Atheist, Baha'i, Christian non spec., Christian Science, Church of Science, Church of Christ Scientist, Druidry Pagan, Hindu, Independant Spirit, Jehovah's Witness, Krishna, Mormon, Pagan, Quaker (Society of Friends), Rastafarian, Scientology, Sufiism, Taoism, Unitarian, Wicca and Zoroastrian.
The data reflect the total offender population which includes all active offenders who are incarcerated in a CSC facility, offenders on a temporary absence from a CSC facility, offenders who are temporarily detained, offenders who are actively supervised, and offenders who are unlawfully at large for less than 90 days.
The data reflect the number of offenders active at the end of each fiscal year. A fiscal year runs from April 1 to March 31 of the following year.
Due to rounding, percentages may not add to 100 percent.
| Total Offender Population | ||||
|---|---|---|---|---|
| 2010-11 | 2014-15 | |||
| # | % | # | % | |
| Catholic | 8,446 | 37.3 | 8,241 | 35.9 |
| Protestant | 4,403 | 19.4 | 2,889 | 12.6 |
| Muslim | 990 | 4.4 | 1,236 | 5.4 |
| Native Spirituality | 921 | 4.1 | 1,157 | 5.0 |
| Buddhist | 456 | 2.0 | 475 | 2.1 |
| Jewish | 157 | 0.7 | 171 | 0.7 |
| Orthodox | 105 | 0.5 | 80 | 0.3 |
| Sikh | 139 | 0.6 | 154 | 0.7 |
| Other | 1,499 | 6.6 | 2,811 | 12.3 |
| None | 3,719 | 16.4 | 3,496 | 15.2 |
| Unknown | 1,828 | 8.1 | 2,225 | 9.7 |
| Total | 22,663 | 100.0 | 22,935 | 100.0 |
Source: Correctional Service Canada.
Note:
Religious identification is self-declared by offenders while they are incarcerated, and the categories are not comprehensive; therefore, the reader should interpret these data with caution.
Catholic includes offenders who are Catholic, Roman-Catholic, Greek-Catholic, Native-Catholic and Ukrainian-Catholic.
Orthodox includes offenders who are Greek Orthodox, Russian Orthodox and Ukrainian Orthodox.
Protestant includes offenders who are Anglican, Baptist, Christian Missionary, Christian Reform, Hutterite, Lutheran, Mennonite, Moravian, Native Spirit, Nazarene Christ, Pentecostal, Philad. Church God, Presbyterian, Protestant, Salvation Army, Seventh Day Adventist, United Church, Christ Methodist, Christ Wesleyan and Worldwide Church.
Buddhist includes offenders who are Buddhist, Mahayana Buddhist and Theravadan Buddhist.
Other includes other declared identifications such as Agnostic, Asatruar Pagan, Atheist, Baha'i, Christian non spec., Christian Science, Church of Science, Church of Christ Scientist, Druidry Pagan, Hindu, Independant Spirit, Jehovah's Witness, Krishna, Mormon, Pagan, Quaker (Society of Friends), Rastafarian, Scientology, Sufiism, Taoism, Unitarian, Wicca and Zoroastrian.
The data reflect the total offender population which includes all active offenders who are incarcerated in a CSC facility, offenders on a temporary absence from a CSC facility, offenders who are temporarily detained, offenders who are actively supervised, and offenders who are unlawfully at large for less than 90 days.
The data reflect the number of offenders active at the end of each fiscal year. A fiscal year runs from April 1 to March 31 of the following year.
Due to rounding, percentages may not add to 100 percent.
The proportion of Aboriginal offenders in custody is higher than for non-Aboriginal offenders
Figure C11
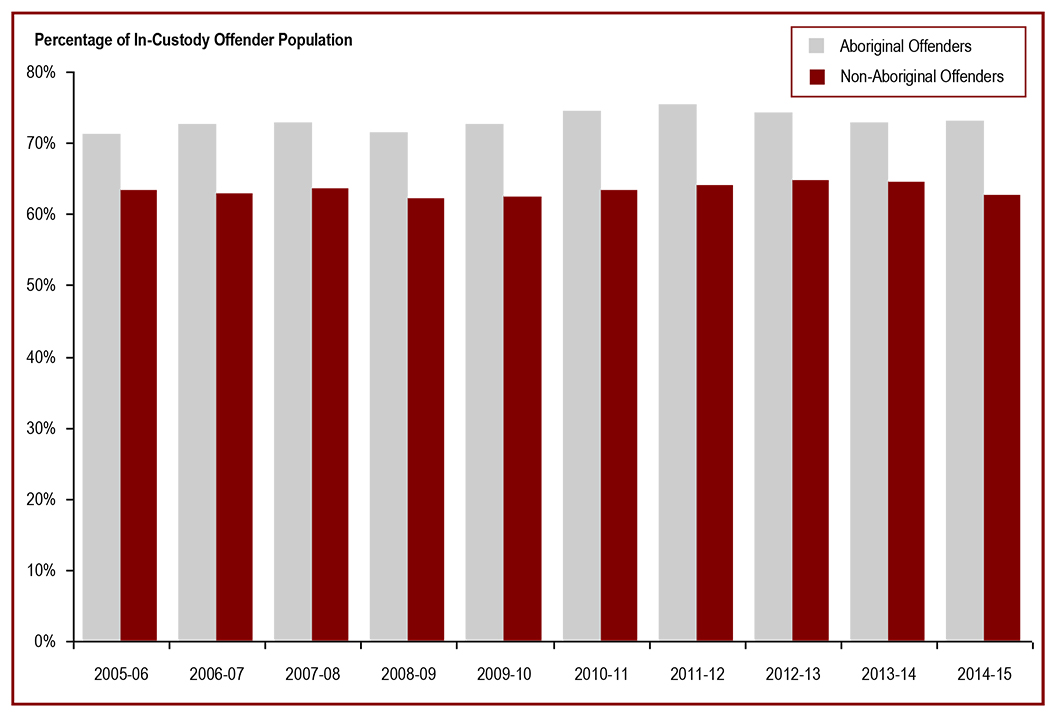
Source: Correctional Service Canada.
- As of end of fiscal year 2014-15, the proportion of offenders in custody was about 10.5% greater for Aboriginal offenders (73.0%) than for non-Aboriginal offenders (62.5%).
- Aboriginal women in custody represent 35.5% of all in-custody women while Aboriginal men in custody represent 24.1% of all men in custody.
- In 2014-15, Aboriginal offenders represented 21.9% of the total offender population.
- Aboriginal offenders accounted for 24.6% of the in-custody population and 16.8% of the community population in 2014-15.
Note:
Offender Population includes all active offenders, who are incarcerated in a CSC facility, offenders on temporary absence from a CSC facility, offenders who are temporarily detained, offenders who are actively supervised, and offenders who are unlawfully at large for less than 90 days.
In Custody includes all active offenders incarcerated in a CSC facility, offenders on temporary absence from a CSC facility,and offenders who are temporarily detained in a CSC facility.
In Community Under Supervision includes all active offenders on day parole, full parole, statutory release, or in the communi ty supervised on a long term supervision order, offenders who are temporarily detained in a non-CSC facility, and offenders who are unlawfully at large for less than 90 days.
The data reflect the number of offenders active at the end of each fiscal year. A fiscal year runs from April 1 to March 31 of the following year.
| In Custody Population | In Community Under Supervision |
Total | ||||
|---|---|---|---|---|---|---|
| # | % | # | % | |||
| Men | ||||||
| 2011-12 | Aboriginal | 3,163 | 75.9 | 1,006 | 24.1 | 4,169 |
| Non-Aboriginal | 11,344 | 64.5 | 6,247 | 35.5 | 17,591 | |
| Total | 14,507 | 66.7 | 7,253 | 33.3 | 21,760 | |
| 2012-13 | Aboriginal | 3,361 | 74.8 | 1,135 | 25.2 | 4,496 |
| Non-Aboriginal | 11,336 | 65.2 | 6,046 | 34.8 | 17,382 | |
| Total | 14,697 | 67.2 | 7,181 | 32.8 | 21,878 | |
| 2013-14 | Aboriginal | 3,324 | 73.5 | 1,200 | 26.5 | 4,524 |
| Non-Aboriginal | 11,372 | 65.0 | 6,135 | 35.0 | 17,507 | |
| Total | 14,696 | 66.7 | 7,335 | 33.3 | 22,031 | |
| 2014-15 | Aboriginal | 3,420 | 73.4 | 1,241 | 26.6 | 4,661 |
| Non-Aboriginal | 10,769 | 63.0 | 6,317 | 37.0 | 17,086 | |
| Total | 14,189 | 65.2 | 7,558 | 34.8 | 21,747 | |
| Women | ||||||
| 2011-12 | Aboriginal | 216 | 67.7 | 103 | 32.3 | 319 |
| Non-Aboriginal | 413 | 50.2 | 409 | 49.8 | 822 | |
| Total | 629 | 55.1 | 512 | 44.9 | 1,141 | |
| 2012-13 | Aboriginal | 205 | 66.3 | 104 | 33.7 | 309 |
| Non-Aboriginal | 411 | 52.0 | 380 | 48.0 | 791 | |
| Total | 616 | 56.0 | 484 | 44.0 | 1,100 | |
| 2013-14 | Aboriginal | 218 | 64.9 | 118 | 35.1 | 336 |
| Non-Aboriginal | 413 | 52.5 | 374 | 47.5 | 787 | |
| Total | 631 | 56.2 | 492 | 43.8 | 1,123 | |
| 2014-15 | Aboriginal | 240 | 67.6 | 115 | 32.4 | 355 |
| Non-Aboriginal | 436 | 52.3 | 397 | 47.7 | 833 | |
| Total | 676 | 56.9 | 512 | 43.1 | 1,188 | |
Source: Correctional Service Canada.
Note:
Total Offender Population includes all active offenders who are incarcerated in a CSC facility, offenders on a temporary absence from a CSC facility, offenders who are temporarily detained, offenders who are actively supervised, and offenders who are unlawfully at large for less than 90 days.
In Custody includes all active offenders incarcerated in a CSC facility, offenders on temporary absence from a CSC facility, and offenders who are temporarily detained in a CSC facility.
In Community Under Supervision includes all active offenders on day parole, full parole, statutory release, or in the community supervised on a long term supervision order, offenders who are temporarily detained in a non-CSC facility, and offenders who are unlawfully at large for less than 90 days.
The data reflect the number of offenders active at the end of each fiscal year. A fiscal year runs from April 1 to March 31 of the following year.
The majority of in-custody offenders are classified as medium security risk
Figure C12
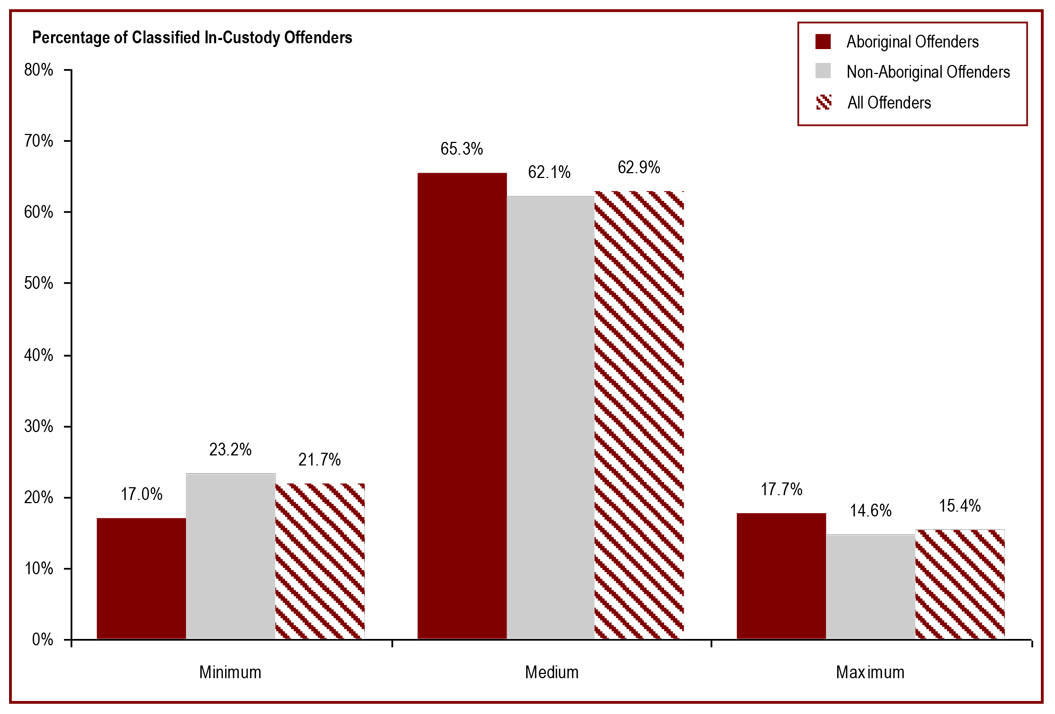
Source: Correctional Service Canada.
- Approximately two-thirds (62.9%) of offenders are classified as medium security risk.
- Aboriginal offenders are more likely to be classified to a medium or maximum security institution compared to non-Aboriginal offenders.
- Compared to non-Aboriginal offenders, a lower percentage of Aboriginal offenders are classified as minimum security risk (17.0% vs. 23.2%) and a higher percentage were classified as medium (65.3% vs. 62.1%) and maximum (17.7% vs. 14.6%) security risk.
Note:
The data represent the offender security level decision as of end of fiscal year 2014-15.
In Custody includes all active offenders incarcerated in a CSC facility, offenders on temporary absence from a CSC facility, and offenders who are temporarily detained in a CSC facility.
| Security Risk Level | Aboriginal | Non-Aboriginal | Total | |||
|---|---|---|---|---|---|---|
| # | % | # | % | # | % | |
| Minimum | 590 | 17.0 | 2,410 | 23.2 | 3,000 | 21.7 |
| Medium | 2,270 | 65.3 | 6,449 | 62.1 | 8,719 | 62.9 |
| Maximum | 616 | 17.7 | 1,520 | 14.6 | 2,136 | 15.4 |
| Total | 3,476 | 100.0 | 10,379 | 100.0 | 13,855 | 100.0 |
| Not Yet Determined* | 184 | 826 | 1,010 | |||
| Total | 3,660 | 11,205 | 14,865 | |||
Source: Correctional Service Canada.
Note:
*The “Not Yet Determined” category includes offenders who have not yet been classified.
The data represent the offender security level decision, as of end of fiscal year 2014-15.
In Custody includes all active offenders incarcerated in a CSC facility, offenders on temporary absence from a CSC facility, and offenders who are temporarily detained in a CSC facility.
Admissions with a life or indeterminate sentence decreased in 2014-15
Figure C13
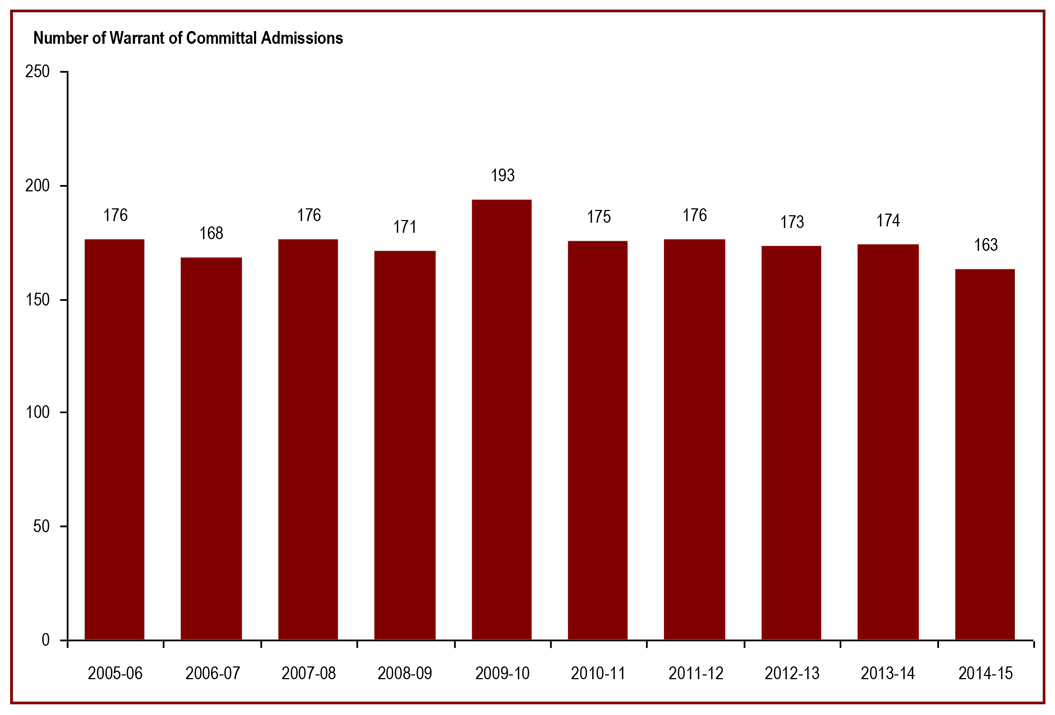
Source: Correctional Service Canada.
- From 2005-06 to 2014-15, the number of admissions to federal jurisdiction with a life/indeterminate* sentence has remained relatively stable, ranging from 163 to 193.
- At the end of fiscal year 2014-15, there were a total of 3,553 offenders in custody with a life/ indeterminate sentence. Of these, 3,430 (96.5%) were men and 123 (3.5%) were women; 847 (23.8%) were Aboriginal and 2,706 (76.2%) were non-Aboriginal.
- At the end of fiscal year 2014-15, 23.2% of the total population was serving a life/indeterminate sentence. Of these offenders, 66.8% were in custody and 33.2% were in the community under supervision.
Note:
*Although life sentences and indeterminate sentences both may result in imprisonment for life, they are different. A life sentence is a sentence of life imprisonment, imposed by a judge at the time of sentence, for example, for murder. An indeterminate sentence is a result of a designation, where an application is made to the court to declare an offender a Dangerous Offender, and the consequence of this designation is imprisonment for an indeterminate period. This table combines offenders serving life sentences and offenders serving indeterminate sentences.
A warrant of committal is a new admission to federal jurisdiction from the courts.
This table combines offenders serving life sentences and offenders serving indeterminate sentences.
| Year | Aboriginal Offenders | Non-Aboriginal Offenders | Total | ||||||
|---|---|---|---|---|---|---|---|---|---|
| Women | Men | Total | Women | Men | Total | Women | Men | Total | |
| 2005-06 | 4 | 41 | 45 | 9 | 122 | 131 | 13 | 163 | 176 |
| 2006-07 | 4 | 34 | 38 | 10 | 120 | 130 | 14 | 154 | 168 |
| 2007-08 | 4 | 35 | 39 | 4 | 133 | 137 | 8 | 168 | 176 |
| 2008-09 | 4 | 35 | 39 | 2 | 130 | 132 | 6 | 165 | 171 |
| 2009-10 | 7 | 44 | 51 | 6 | 136 | 142 | 13 | 180 | 193 |
| 2010-11 | 3 | 34 | 37 | 6 | 132 | 138 | 9 | 166 | 175 |
| 2011-12 | 8 | 43 | 51 | 9 | 116 | 125 | 17 | 159 | 176 |
| 2012-13 | 6 | 46 | 52 | 1 | 120 | 121 | 7 | 166 | 173 |
| 2013-14 | 7 | 37 | 44 | 7 | 123 | 130 | 14 | 160 | 174 |
| 2014-15 | 1 | 38 | 39 | 8 | 116 | 124 | 9 | 154 | 163 |
Source: Correctional Service Canada.
Note:
This table combines offenders serving life sentences and offenders serving indeterminate sentences.
Although life sentences and indeterminate sentences both may result in imprisonment for life, they are different. A life sentence is a sentence of life imprisonment, imposed by a judge at the time of sentence, for example, for murder. An indeterminate sentence is a result of a designation, where an application is made to the court to declare an offender a Dangerous Offender, and the consequence of this designation is imprisonment for an indeterminate period. A warrant of committal is a new admission to federal jurisdiction from the courts.
Offenders with Life or Indeterminate sentences represent 23% of the total offender population
Figure C14
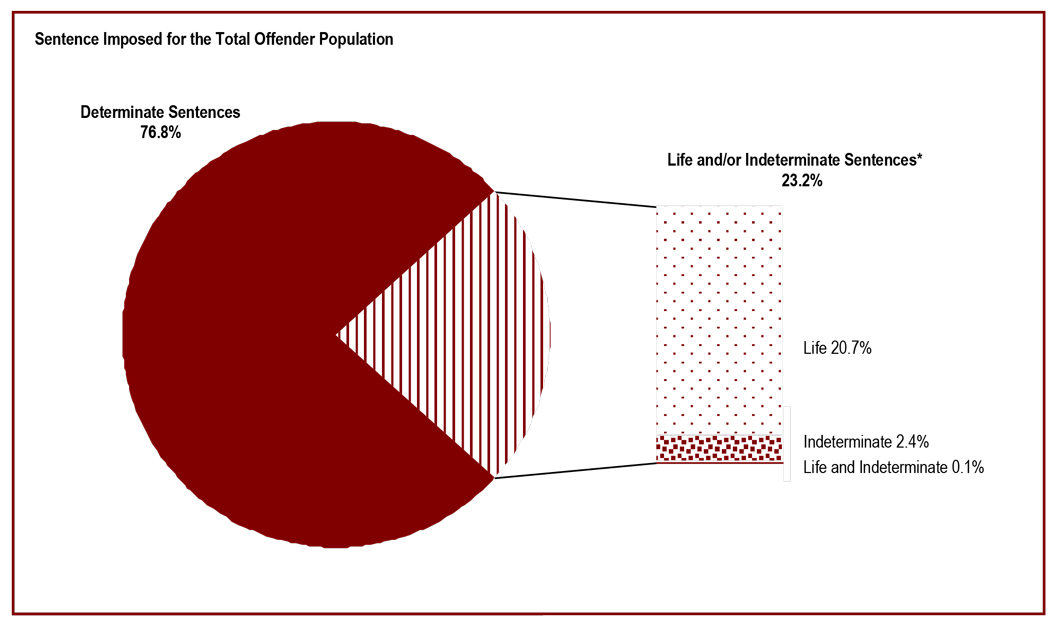
Source: Correctional Service Canada.
- At the end of fiscal year 2014-15, there were 5,321 offenders serving a life sentence and/or an indeterminate sentence. This represents 23.2% of the total offender population. The majority (66.8%) of these offenders were in custody. Of the 1,768 offenders who were in the community under supervision, the majority (82.2%) were serving a life sentence for 2nd Degree Murder.
- There were 21 offenders who were serving both a life sentence and an indeterminate sentence.
- There were 555 offenders who were serving an indeterminate sentence as a result of a special designation. The remaining 4,745 offenders did not receive a special designation, but were serving a life sentence.
- 96.1% of the 532 Dangerous Offenders with indeterminate sentences were in custody and 3.9% were in the community under supervision.
- In contrast, 60.0% of the 20 Dangerous Sexual Offenders were in custody and all (3) of the Habitual Offenders were in the community under supervision. There is one Habitual Offender included in the Designation and Life grouping, this offender was in the community under supervision as well.
Note:
*Although life sentences and indeterminate sentences may both result in imprisonment for life, they are different. A life sentence is a sentence of life imprisonment, imposed by a judge at the time of sentence, for example, for murder. An indeterminate sentence is a result of a designation, where an application is made to the court to declare an offender a Dangerous Offender, and the consequence of this designation is imprisonment for an indeterminate period. The Dangerous Sexual Offender and Habitual Offender designations were replaced with Dangerous Offender Legislation in 1977.
The data reflect the total offender population which includes all active offenders, who are incarcerated in a CSC facility, offenders on temporary absence from a CSC facility, offenders who are temporarily detained, offenders who are actively supervised, and offenders who are unlawfully at large for less than 90 days.
In-Custody includes all active offenders incarcerated in a CSC facility, offenders on temporary absence from a CSC facility, and offenders who are temporarily detained in a CSC facility. In Community Under Supervision includes all active offenders on day parole, full parole, statutory release, or in the community supervised on a long term supervision order, offenders who are temporarily detained in a non-CSC facility, and offenders who are unlawfully at large for less than 90 days.
| Total Offender Population |
Current Status | |||||
|---|---|---|---|---|---|---|
| In Custody in a CSC Facility |
In Community Under Supervision | |||||
| Incarcerated | Day Parole | Full Parole | Other*** | |||
| # | % | |||||
| Offenders with a life sentence for: | ||||||
| 1st Degree Murder | 1,139 | 5.0 | 935 | 43 | 161 | 0 |
| 2nd Degree Murder | 3,400 | 14.8 | 1,947 | 203 | 1,250 | 0 |
| Other Offences* | 206 | 0.9 | 129 | 8 | 69 | 0 |
| Total | 4,745 | 20.7 | 3,011 | 254 | 1,480 | 0 |
| Offenders with indeterminate sentences resulting from the special designation of: | ||||||
| Dangerous Offender | 532 | 2.3 | 511 | 12 | 9 | 0 |
| Dangerous Sexual Offender | 20 | 0.1 | 12 | 0 | 8 | 0 |
| Habitual Offenders | 3 | 0.0 | 0 | 0 | 3 | 0 |
| Total | 555 | 2.4 | 523 | 12 | 20 | 0 |
| Offenders serving an indeterminate sentence (due to a special designation) and a life sentence (due to an offence): | ||||||
| 21 | 0.1 | 19 | 0 | 2 | 0 | |
| Total offenders with Life and/or Indeterminate sentence | 5,321 | 23.2 | 3,553 | 266 | 1,502 | 0 |
| Offenders Serving Determinate sentences** | 17,614 | 76.8 | 11,321 | 1,083 | 1,799 | 3,420 |
| Total | 22,935 | 100.0 | 14,865 | 1,349 | 3,301 | 3,420 |
Source: Correctional Service Canada.
Note:
*“Other offences” include Schedule 1, Schedule 2 and Non-Schedule types of offences.
**This includes 70 offenders designated as Dangerous Offenders who are serving determinate sentences.
***“Other” in the Community Under Supervision includes offenders on statutory release or on a long term supervision order.
Among the 21 offenders serving an indeterminate sentence (due to a special designation) and a life sentence (due to an offence), there was one Habitual Offender.
Although life sentences and indeterminate sentences both may result in imprisonment for life, they are different. A life sentence is a sentence of life imprisonment, imposed by a judge at the time of sentence, for example for murder. An indeterminate sentence is a result of a designation, where an application is made to the court to declare an offender a Dangerous Offender, and the consequence of this designation is imprisonment for an indeterminate period. The Dangerous Sexual Offender and Habitual Offender designations were replaced with Dangerous Offender legislation in 1977.
The data reflect the total offender population which includes all active offenders, who are incarcerated in a CSC facility, offenders on temporary absence from a CSC facility, offenders who are temporarily detained, offenders who are actively supervised, and offenders who are unlawfully at large for less than 90 days. In-Custody includes all active offenders incarcerated in a CSC facility, offenders on temporary absence from a CSC facility, and offenders who are temporarily detained in a CSC facility. In Community Under Supervision includes all act ive offenders on day parole, full parole, statutory release, or in the community supervised on a long term supervision order, offenders who are temporarily detained in a non-CSC facility, and offenders who are unlawfully at large for less than 90 days.
69% of offenders are serving a sentence for a violent offence*
Figure C15

Source: Correctional Service Canada.
- At the end fiscal year 2014-15, Aboriginal offenders were more likely to be serving a sentence for a violent offence (78.6% for Aboriginal versus 66.1% for non-Aboriginal).
- 73.5% of Aboriginal women offenders were serving a sentence for a violent offence compared to 47.2% of non-Aboriginal women offenders.
- Of those offenders serving a sentence for Murder, 4.5% were women and 19.8% were Aboriginal.
- A greater proportion of Aboriginal offenders than non-Aboriginal offenders were serving a sentence for a Schedule I offence (60.5% versus 45.6%, respectively).
- 9.3% of Aboriginal offenders were serving a sentence for a Schedule II offence compared to 19.4% of non-Aboriginal offenders.
- 26.9% of women were serving a sentence for a Schedule II offence compared to 16.7% for men.
Note:
*Violent offences include Murder I, Murder II and Schedule I offences.
Schedule I is comprised of sexual offences and other violent crimes excluding first and second degree murder (see the Corrections and Conditional Release Act).
Schedule II is comprised of serious drug offences or conspiracy to commit serious drug offences (see the Corrections and Conditional Release Act).
In cases where the offender is serving a sentence for more than one offence, the data reflect the most serious offence.
The data reflect the total offender population which includes all active offenders, who are incarcerated in a CSC facility, offenders on temporary absence from a CSC facility, offenders who are temporarily detained, offenders who are actively supervised, and offenders who are unlawfully at large for less than 90 days.
| Offence Category | Aboriginal | Non-Aboriginal | Total | ||||||
|---|---|---|---|---|---|---|---|---|---|
| Women | Men | Total | Women | Men | Total | Women | Men | Total | |
| Murder I | 10 | 205 | 215 | 34 | 908 | 942 | 44 | 1,113 | 1,157 |
| Percent | 2.8 | 4.4 | 4.3 | 41 | 5.3 | 5.3 | 3.7 | 5.1 | 5.0 |
| Murder II | 54 | 637 | 691 | 108 | 2,616 | 2,724 | 162 | 3,253 | 3,415 |
| Percent | 15.2 | 13.7 | 13.8 | 13.0 | 15.3 | 15.2 | 13.6 | 15.0 | 14.9 |
| Schedule I | 197 | 2,840 | 3,037 | 251 | 7,920 | 8,171 | 448 | 10,760 | 11,208 |
| Percent | 55.5 | 60.9 | 60.5 | 30.1 | 46.4 | 45.6 | 37.7 | 49.5 | 48.9 |
| Schedule II | 53 | 413 | 466 | 267 | 3,210 | 3,477 | 320 | 3,623 | 3,943 |
| Percent | 14.9 | 8.9 | 9.3 | 32.1 | 18.8 | 19.4 | 26.9 | 16.7 | 17.2 |
| Non-Schedule | 41 | 566 | 607 | 173 | 2,432 | 2,605 | 214 | 2,998 | 3,212 |
| Percent | 11.5 | 12.1 | 12.1 | 20.8 | 14.2 | 14.5 | 18.0 | 13.8 | 14.0 |
| 355 | 4,661 | 833 | 17,086 | 1,188 | 21,747 | ||||
| Total | 5,016 | 17,919 | 22,935 | ||||||
Source: Correctional Service Canada.
Note:
*Violent offences include Murder I, Murder II and Schedule I offences.
Schedule I is comprised of sexual offences and other violent crimes excluding first and second degree murder (see the Corrections and Conditional Release Act).
Schedule II is comprised of serious drug offences or conspiracy to commit serious drug offences (see the Corrections and Conditional Release Act).
In cases where the offender is serving a sentence for more than one offence, the data reflect the most serious offence.
The data reflect the total offender population, which includes all active offenders who are incarcerated in a CSC facility, offenders on temporary absence from a CSC facility, offenders who are temporarily detained, offenders who are actively supervised, and offenders who are unlawfully at large for less than 90 days.
The number of Aboriginal offenders has increased
Figure C16
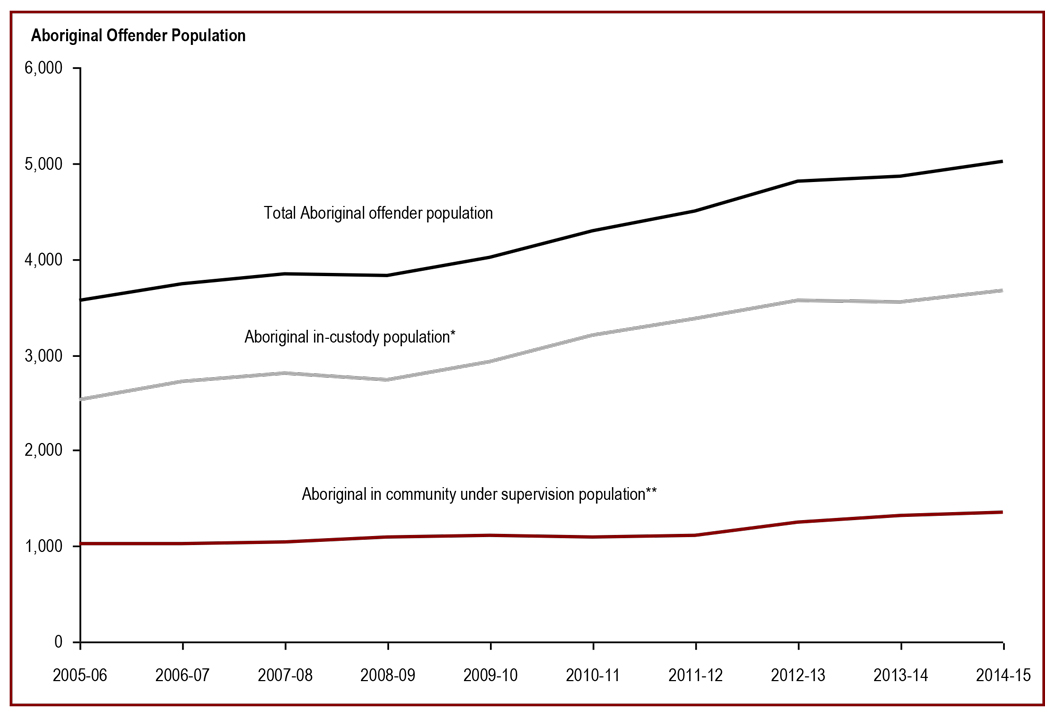
Source: Correctional Service Canada.
- From 2005-06 to 2014-15, the in-custody Aboriginal offender population increased by 44.8%, while the total Aboriginal offender population increased 41.1% over the same time period.
- The number of in-custody Aboriginal women offenders increased steadily from 141 in 2005-06 to 240 in 2014-15, an increase of 70.2% in the last ten years. The increase for in-custody Aboriginal men offenders was 43.3% for the same period, increasing from 2,387 to 3,420.
- From 2005-06 to 2014-15, the number of Aboriginal offenders on community supervision increased 32.2%, from 1,026 to 1,356. The Aboriginal community population accounted for 16.8% of the total community population in 2014-15.
Note:
In-Custody Population includes all active offenders incarcerated in a CSC facility, offenders on temporary absence from a CSC facility, and offenders who are temporarily detained in a CSC facility.
In Community Under Supervision Population includes all active offenders on day parole, full parole, statutory release, or in the community supervised on a long term supervision order, offenders who are temporarily detained in a non-CSC facility, and offenders who are unlawfully at large for less than 90 days.
Regional statistics for Correctional Service Canada account for data relating to the northern territories in the following manner: data for Nunavut are reported in the Ontario Region, data for the Northwest Territories are reported in the Prairies Region, and data for the Yukon Territories are reported in the Pacific Region.
| Aboriginal Offenders | Fiscal Year | |||||
|---|---|---|---|---|---|---|
| 2010-11 | 2011-12 | 2012-13 | 2013-14 | 2014-15 | ||
| In Custody | ||||||
| Atlantic Region | Men | 117 | 131 | 153 | 181 | 174 |
| Women | 10 | 17 | 15 | 14 | 11 | |
| Quebec Region | Men | 329 | 375 | 382 | 419 | 441 |
| Women | 11 | 12 | 13 | 17 | 21 | |
| Ontario Region | Men | 439 | 488 | 494 | 440 | 441 |
| Women | 41 | 37 | 35 | 36 | 33 | |
| Prairie Region | Men | 1,633 | 1,665 | 1,778 | 1,682 | 1,759 |
| Women | 104 | 118 | 109 | 113 | 138 | |
| Pacific Region | Men | 480 | 504 | 554 | 602 | 605 |
| Women | 30 | 32 | 33 | 38 | 37 | |
| National Total | Men | 2,998 | 3,163 | 3,361 | 3,324 | 3,420 |
| Women | 196 | 216 | 205 | 218 | 240 | |
| Total | 3,194 | 3,379 | 3,566 | 3,542 | 3,660 | |
| In Community Under Supervision | ||||||
| Atlantic Region | Men | 44 | 32 | 42 | 50 | 60 |
| Women | 9 | 8 | 12 | 11 | 12 | |
| Quebec Region | Men | 87 | 116 | 121 | 134 | 158 |
| Women | 5 | 2 | 2 | 7 | 12 | |
| Ontario Region | Men | 154 | 138 | 157 | 181 | 180 |
| Women | 20 | 24 | 20 | 20 | 21 | |
| Prairie Region | Men | 501 | 492 | 582 | 584 | 574 |
| Women | 50 | 52 | 55 | 63 | 53 | |
| Pacific Region | Men | 207 | 228 | 233 | 251 | 269 |
| Women | 14 | 17 | 15 | 17 | 17 | |
| National Total | Men | 993 | 1,006 | 1,135 | 1,200 | 1,241 |
| Women | 98 | 103 | 104 | 118 | 115 | |
| Total | 1,091 | 1,109 | 1,239 | 1,318 | 1,356 | |
| Total In Custody & In Community Under Supervision | 4,285 | 4,488 | 4,805 | 4,860 | 5,016 | |
Source: Correctional Service Canada.
Note:
In Custody includes all active offenders incarcerated in a CSC facility, offenders on temporary absence from a CSC facility, and offenders who are temporarily detained in a CSC facility.
In Community Under Supervision includes all active offenders on day parole, full parole, statutory release, or in the community supervised on a long term supervision order, offenders who are temporarily detained in a non-CSC facility, and offenders who are unlawfully at large for less than 90 days.
Regional statistics for the Correctional Service of Canada account for data relating to the northern territories in the following manner: data for Nunavut are reported in the Ontario Region, data for the Northwest Territories are reported in the Prairies region, and data for the Yukon Territories are reported in the Pacific Region.
The total number of admissions to administrative segregation has fluctuated
Figure C17
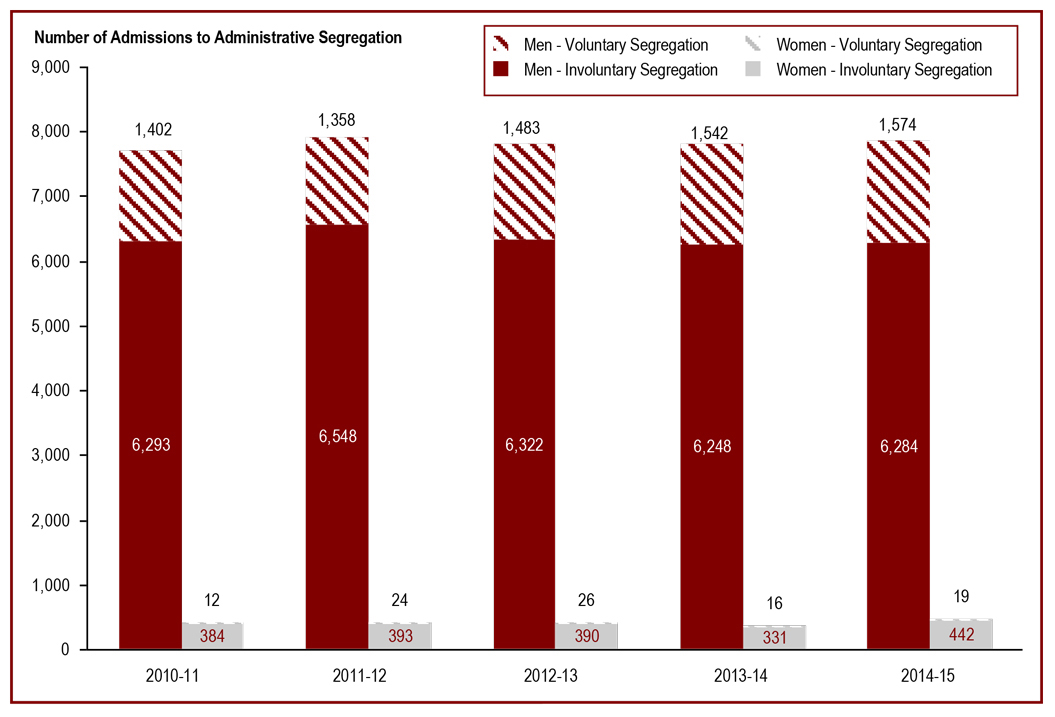
Source: Correctional Service Canada.
- Over the past five years, the total number of admissions to administrative segregation has fluctuated between 8,091 and 8,323. In 2014-15, 94.5% of the total admissions were men, and admissions of Aboriginal offenders accounted for 30.5%.
- At the end of fiscal year 2014-15, there were 660 offenders in administrative segregation. Of these, 651 were men and 9 were women. A total of 195 Aboriginal offenders were in administrative segregation.
Note:
These reports count admissions, not offenders. Offenders admitted multiple times to segregation are counted once for each admission. Offenders segregated under paragraph (f), subsection 44(1) of the Corrections and Conditional Release Act (Disciplinary Segregation) are not included.
Administrative segregation is the involuntary or voluntary separation, when specific legal requirements are met, of an inmate from the general population, other than pursuant to a disciplinary decision.
Voluntary administrative segregation is when the inmate requests placement in administrative segregation, and the Institutional Head believes, on reasonable grounds, that the continued presence of the inmate in the general population would jeopardize the inmate's own safety and that there is no reasonable alternative to placement in administrative segregation.
Involuntary administrative segregation is when the placement meets the requirements of subsection 31(3) of the Corrections and Conditional Release Act and the placement in administrative segregation is not voluntary.
| Year and Type of Administrative Segregation | By Gender | By Race | ||||
|---|---|---|---|---|---|---|
| Women | Men | Total | Aboriginal | Non-Aboriginal | Total | |
| 2010-11 | ||||||
| Involuntary | 384 | 6,293 | 6,677 | 1,846 | 4,831 | 6,677 |
| Voluntary | 12 | 1,402 | 1,414 | 457 | 957 | 1,414 |
| Total | 396 | 7,695 | 8,091 | 2,303 | 5,788 | 8,091 |
| 2011-12 | ||||||
| Involuntary | 393 | 6,548 | 6,941 | 1,844 | 5,097 | 6,941 |
| Voluntary | 24 | 1,358 | 1,382 | 443 | 939 | 1,382 |
| Total | 417 | 7,906 | 8,323 | 2,287 | 6,036 | 8,323 |
| 2012-13 | ||||||
| Involuntary | 390 | 6,322 | 6,712 | 1,957 | 4,755 | 6,712 |
| Voluntary | 26 | 1,483 | 1,509 | 522 | 987 | 1,509 |
| Total | 416 | 7,805 | 8,221 | 2,479 | 5,742 | 8,221 |
| 2013-14 | ||||||
| Involuntary | 331 | 6,248 | 6,579 | 1,891 | 4,688 | 6,579 |
| Voluntary | 16 | 1,542 | 1,558 | 552 | 1,006 | 1,558 |
| Total | 347 | 7,790 | 8,137 | 2,443 | 5,694 | 8,137 |
| 2014-15 | ||||||
| Involuntary | 442 | 6,284 | 6,726 | 1,962 | 4,764 | 6,726 |
| Voluntary | 19 | 1,574 | 1,593 | 573 | 1,020 | 1,593 |
| Total | 461 | 7,858 | 8,319 | 1,535 | 5,784 | 8,319 |
Source: Correctional Service Canada.
Note:
These reports count admissions, not offenders. Offenders admitted multiple times to segregation are counted once for each admission. Offenders segregated under paragraph (f), subsection 44(1) of the Corrections and Conditional Release Act (Disciplinary Segregation) are not included.
Administrative segregation is the involuntary or voluntary separation, when specific legal requirements are met, of an inmate from the general population, other than pursuant to a disciplinary decision.
Voluntary administrative segregation is when the inmate requests placement in administrative segregation, and the Institutional Head believes, on reasonable grounds, that the continued presence of the inmate in the general population would jeopardize the inmate's own safety and that there is no reasonable alternative to placement in administrative segregation.
Involuntary administrative segregation is when the placement meets the requirements of subsection 31(3) of the Corrections and Conditional Release Act and the placement in administrative segregation is not voluntary.
67% of admissions to administrative segregation stay for less than 30 days
Figure C18
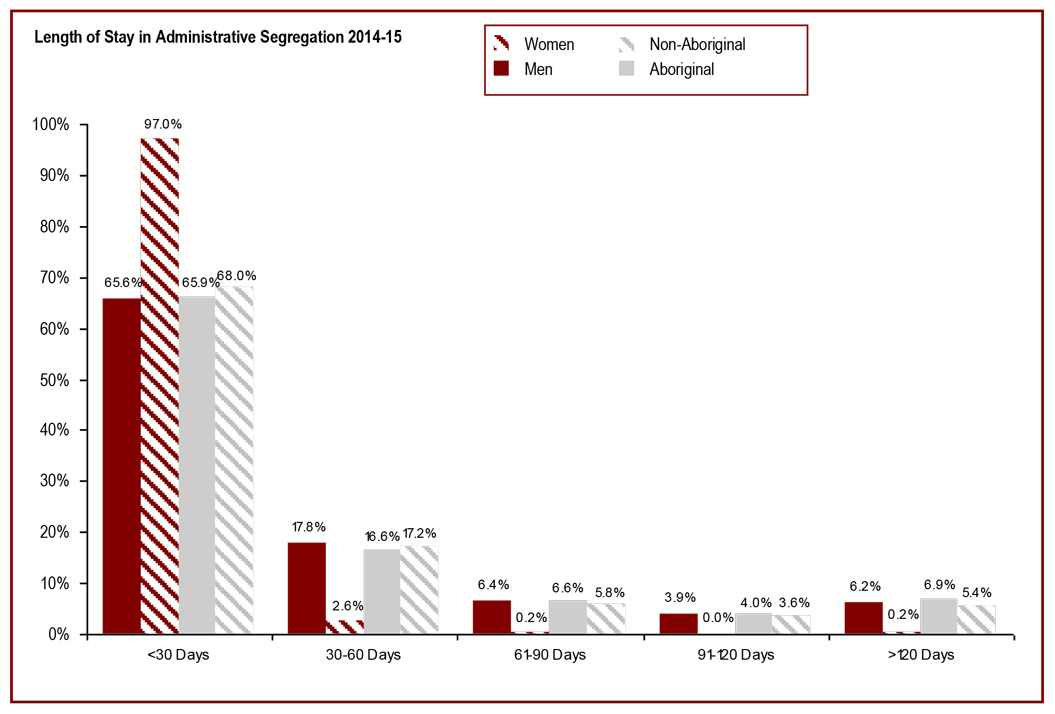
Source: Correctional Service Canada.
- Most (67.3%) placements in administrative segregation ended in 30 days or less, and 17.0% lasted between 30 and 60 days. 5.9% of placements to administrative segregation lasted more than 120 days.
- 97.0% of placements of women stayed in administrative segregation for less than 30 days.
- The number of admissions to administrative segregation that resulted in placements lasting more than 120 days in administrative segregation was slightly higher for Aboriginal (6.9%) than for non-Aboriginal offenders (5.4%).
Note:
These reports count admissions, not offenders. Offenders admitted multiple times to segregation are counted once for each admission. Offenders segregated under paragraph (f), subsection 44(1) of the Corrections and Conditional Release Act (Disciplinary Segregation) are not included.
Administrative segregation is the involuntary or voluntary separation, when specific legal requirements are met, of an inmate from the general population, other than pursuant to a disciplinary decision.
| Length of Stay in Administrative Segregation | By Gender | By Race | ||||||||
|---|---|---|---|---|---|---|---|---|---|---|
| Women | Men | Aboriginal | Non-Aboriginal | Total | ||||||
| # | % | # | % | # | % | # | % | # | % | |
| 2014-15 | ||||||||||
| < 30 days | 446 | 97.0 | 5,221 | 65.6 | 1,706 | 65.9 | 3,961 | 68.0 | 5,667 | 67.3 |
| 30-60 days | 12 | 2.6 | 1,419 | 17.8 | 430 | 16.6 | 1,001 | 17.2 | 1,431 | 17.0 |
| 61-90 days | 1 | 0.2 | 508 | 6.4 | 171 | 6.6 | 338 | 5.8 | 509 | 6.0 |
| 91-120 days | 0 | 0.0 | 311 | 3.9 | 103 | 4.0 | 208 | 3.6 | 311 | 3.7 |
| > 120 days | 1 | 0.2 | 496 | 6.2 | 180 | 6.9 | 317 | 5.4 | 497 | 5.9 |
| Total | 460 | 100.0 | 7,955 | 100.0 | 2,590 | 100.0 | 5,825 | 100.0 | 8,415 | 100.0 |
Source: Correctional Service Canada.
Note:
These reports count admissions, not offenders. Offenders admitted multiple times to segregation are counted once for each admission. Offenders segregated under paragraph (f), subsection 44(1) of the Corrections and Conditional Release Act (Disciplinary Segregation) are not included.
Administrative segregation is the involuntary or voluntary separation, when specific legal requirements are met, of an inmate from the general population, other than pursuant to a disciplinary decision.
The number of offender deaths while in custody has fluctuated
Figure C19
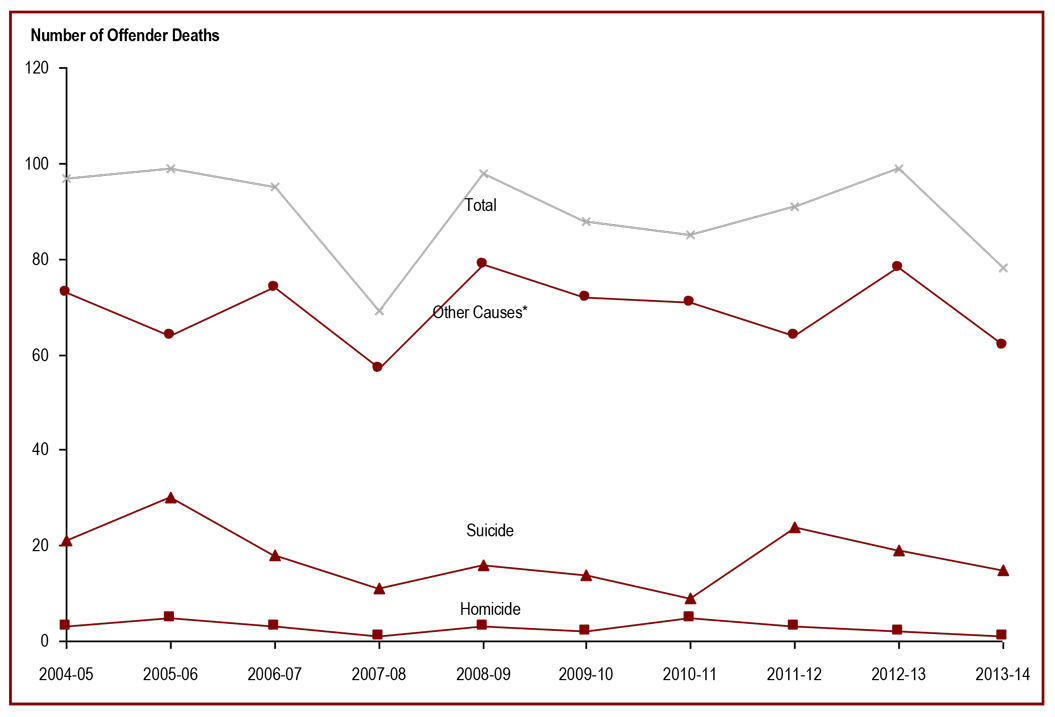
Source: Adult Correctional Services Survey, Canadian Centre for Justice Statistics, Statistics Canada
- In the ten-year period from 2004-05 to 2013-14, 519 federal offenders and 380 provincial offenders have died while in custody.
- During this time period, suicides accounted for 16.2% of federal offender deaths and 24.5% of provincial offender deaths. The suicide rate was approximately 68 per 100,000 for incarcerated federal offenders, and approximately 40 per 100,000 for incarcerated provincial offenders**. These rates are significantly higher than Canada's 2007 rate of 10.2 suicides per 100,000 people.
- Between 2004-05 and 2013-14, 4.4% of the federal offender deaths were due to homicide, whereas homicide accounted for 1.3% of provincial offender deaths. The homicide rate for incarcerated federal offenders was approximately 21 per 100,000 and 2.2 per 100,000 for incarcerated provincial offenders**. These rates are significantly higher than the national homicide rate of 1.6 per 100,000 people in 2007.
Note:
*Other causes of death include: natural causes, accidental deaths, death as a result of a legal intervention, other causes of death and where cause of death was not stated.
**For the calculation of rates, the total actual in-count numbers between 2004-05 and 2013-14 was used as the denominator.
The data on cause of death are subject to change following an official review or investigation, and should be used/interpreted with caution. The data presented were provided by the Canadian Centre for Justice Statistics at Statistics Canada, and may not reflect the outcome of recent reviews or investigations on cause of death.
| Year | Type of Death | ||||||
|---|---|---|---|---|---|---|---|
| Homicide | Suicide | Other* | Total | ||||
| # | % | # | % | # | % | # | |
| Federal | |||||||
| 2004-05 | 3 | 6.1 | 9 | 28.4 | 37 | 75.5 | 49 |
| 2005-06 | 3 | 6.1 | 10 | 20.4 | 36 | 73.5 | 49 |
| 2006-07 | 3 | 4.9 | 10 | 16.4 | 48 | 78.7 | 61 |
| 2007-08 | 1 | 2.5 | 5 | 12.5 | 34 | 85.0 | 40 |
| 2008-09 | 2 | 3.1 | 9 | 13.8 | 54 | 83.1 | 65 |
| 2009-10 | 1 | 2.0 | 9 | 18.4 | 39 | 79.6 | 49 |
| 2010-11 | 5 | 10.0 | 4 | 8.0 | 41 | 82.0 | 50 |
| 2011-12 | 3 | 5.7 | 8 | 15.1 | 42 | 79.2 | 53 |
| 2012-13 | 1 | 1.8 | 11 | 20.0 | 43 | 78.2 | 55 |
| 2013-14 | 1 | 2.1 | 9 | 18.8 | 38 | 79.2 | 48 |
| Total | 29 | 4.4 | 84 | 16.2 | 412 | 79.4 | 519 |
| Provincial | |||||||
| 2004-05 | 0 | 0.0 | 12 | 25.0 | 36 | 75.0 | 48 |
| 2005-06 | 2 | 4.0 | 20 | 40.0 | 28 | 56.0 | 50 |
| 2006-07 | 0 | 0.0 | 8 | 23.5 | 26 | 76.5 | 34 |
| 2007-08 | 0 | 0.0 | 6 | 20.7 | 23 | 79.3 | 29 |
| 2008-09 | 1 | 3.0 | 7 | 21.2 | 25 | 75.8 | 33 |
| 2009-10 | 1 | 2.6 | 5 | 12.8 | 33 | 84.6 | 39 |
| 2010-11 | 0 | 0.0 | 5 | 14.3 | 30 | 85.7 | 35 |
| 2011-12 | 0 | 0.0 | 16 | 42.1 | 22 | 57.9 | 38 |
| 2012-13 | 1 | 2.3 | 8 | 18.2 | 35 | 79.5 | 44 |
| 2013-14 | 0 | 0.0 | 6 | 20.0 | 24 | 80.0 | 30 |
| Total | 5 | 1.3 | 93 | 24.5 | 282 | 74.2 | 380 |
| Total Federal and Provincial Offender Deaths | 28 | 3.1 | 177 | 19.7 | 694 | 77.2 | 899 |
Source: Adult Correctional Services Survey, Canadian Centre for Justice Statistics, Statistics Canada
Note:
*Other causes of death include: natural causes, accidental deaths, death as a result of a legal intervention, other causes of death and where cause of death was not stated.
Percent calculation include deaths where the cause was unknown. Between 2001-02 and 2013-14, there were 54 deaths in federal custody and 129 deaths in provincial custody where the cause was unknown.
The data on cause of death are subject to change following an official review or investigation, and should be used/interpreted with caution. The data presented were provided by the Canadian Centre for Justice Statistics at Statistics Canada, and may not reflect the outcome of recent reviews or investigations on cause of death.
The number of escapes was stable in 2014-15
Figure C20
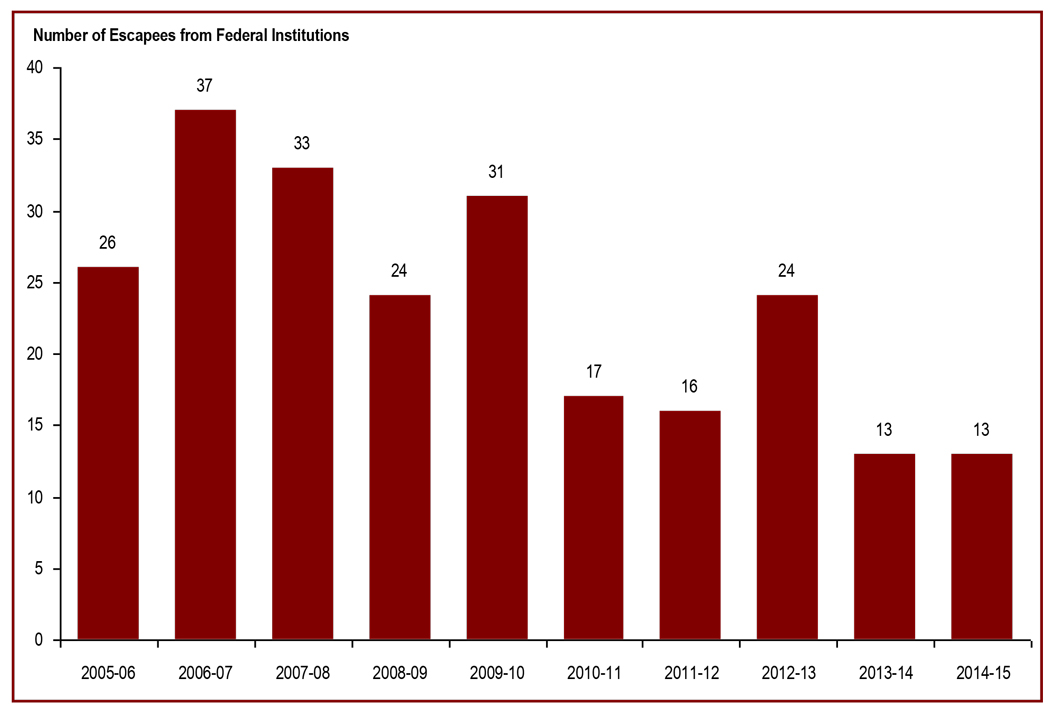
Source: Security, Correctional Service Canada.
- In 2014-15, there were 13 escape incidents involving a total of 13 offenders. Ten of the 13 offenders were recaptured. The last two years have represented the lowest number of escape incidents in the past 10 years.
- In 2014-15, all of the escapees were from minimum security facilities.
- Offenders who escaped from federal institutions in 2014-15 represented less than 0.1% of the incustody population.
Note:
The data represent the number of escape incidents from federal facilities during each fiscal year. A fiscal year runs from April 1 to March 31 of the following year.
A fiscal year runs from April 1 to March 31 of the following year.
| Type of Escapes | 2010-11 | 2011-12 | 2012-13 | 2013-14 | 2014-15 |
|---|---|---|---|---|---|
| Escapes from Multi-level Security | 0 | 0 | 0 | 0 | 0 |
| Number of Escapees | 0 | 0 | 0 | 0 | 0 |
| Escapes from Maximum Security | 0 | 0 | 0 | 0 | 0 |
| Number of Escapees | 0 | 0 | 0 | 0 | 0 |
| Escapes from Medium Security | 0 | 0 | 0 | 1 | 0 |
| Number of Escapees | 0 | 0 | 0 | 1 | 0 |
| Escapes from Minimum Security | 14 | 15 | 18 | 10 | 13 |
| Number of Escapees | 17 | 16 | 24 | 12 | 13 |
| Total Number of Escape Incidents | 14 | 15 | 18 | 11 | 13 |
| Total Number of Escapees | 17 | 16 | 24 | 13 | 13 |
Source: Security, Correctional Service Canada.
Note:
The data represents the number of escape incidents from federal facilities during each fiscal year. An escape can involve more than one offender.
A fiscal year runs from April 1 to March 31 of the following year.
The population of offenders in the community under supervision has increased in the past 2 years
Figure C21
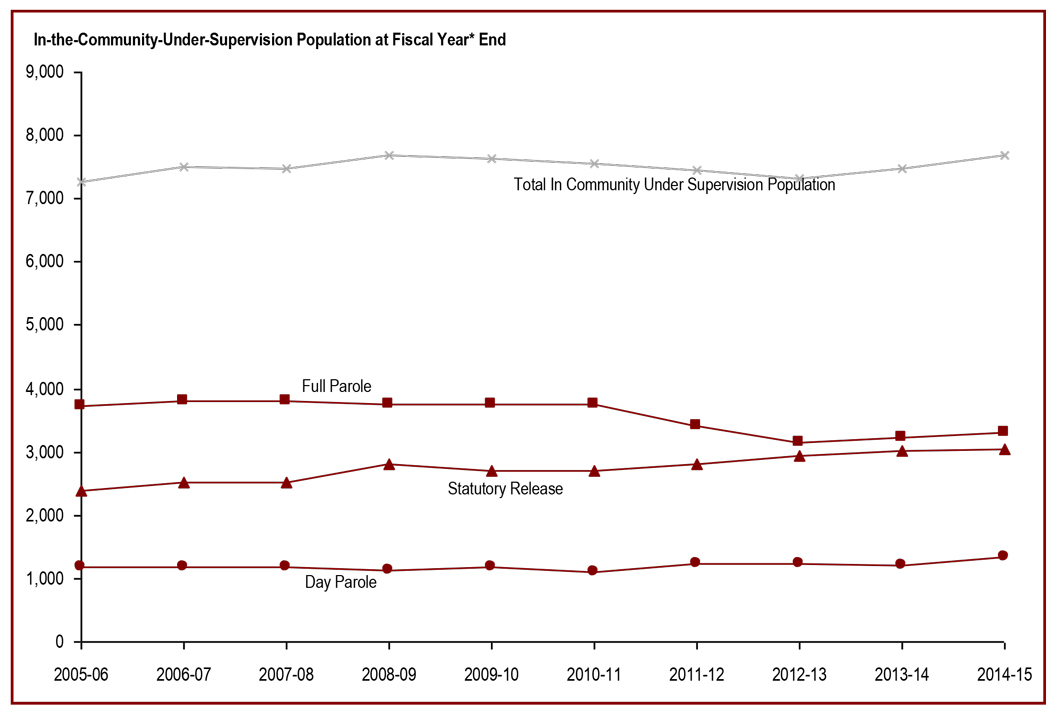
Source: Correctional Service Canada.
- Over the past five years, the total offender population supervised in the community increased by 1.8%. For the same period, the total number of offenders on full parole fell by 12.1% while the proportion of offenders on statutory release increased by 12.5%.
- At the end of fiscal year 2014-2015, there were 7,195 men and 505 women on active community supervision.
Note:
*These cases reflect the number of offenders on active supervision at fiscal year end. A fiscal year runs from April 1 to March 31 of the following year.
The data reflect the offender population in the community under supervision which includes all active offenders on day parole, full parole, statutory release, offenders who are temporarily detained in a non-CSC facility, and offenders who are unlawfully at large for less than 90 days.
The data presented above do not include offenders who were on long term supervision orders (See Figure/Table E4).
Day parole is a type of conditional release granted by the Parole Board of Canada whereby offenders are permitted to participate in community-based activities in preparation for full parole or statutory release. The conditions require offenders to return nightly to an institution or half-way house unless otherwise authorized by the Parole Board of Canada.
Full parole is a type of conditional release granted by the Parole Board of Canada whereby the remainder of the sentence is served under supervision in the community.
Statutory release refers to a conditional release that is subject to supervision after the offender has served two-thirds of the sentence.
| Year | Supervision Type of Offenders | |||||||||
|---|---|---|---|---|---|---|---|---|---|---|
| Day Parole | Full Parole | Statutory Release | Totals | % change* | ||||||
| Women | Men | Women | Men | Women | Men | Women | Men | Both | Both | |
| 2005-06 | 85 | 1,096 | 306 | 3,407 | 79 | 2,298 | 470 | 6,801 | 7,271 | 0.4 |
| 2006-07 | 108 | 1,071 | 319 | 3,493 | 80 | 2,426 | 507 | 6,990 | 7,497 | 3.1 |
| 2007-08 | 114 | 1,062 | 326 | 3,477 | 112 | 2,395 | 552 | 6,934 | 7,486 | -0.1 |
| 2008-09 | 106 | 1,017 | 343 | 3,421 | 113 | 2,682 | 562 | 7,120 | 7,682 | 2.6 |
| 2009-10 | 108 | 1,084 | 329 | 3,419 | 94 | 2,612 | 531 | 7,115 | 7,646 | -0.5 |
| 2010-11 | 79 | 1,017 | 314 | 3,443 | 109 | 2,601 | 502 | 7,061 | 7,563 | -1.1 |
| 2011-12 | 123 | 1,123 | 257 | 3,155 | 127 | 2,668 | 507 | 6,946 | 7,453 | -1.5 |
| 2012-13 | 116 | 1,108 | 225 | 2,932 | 137 | 2,805 | 478 | 6,845 | 7,323 | -1.7 |
| 2013-14 | 106 | 1,105 | 225 | 3,014 | 153 | 2,874 | 484 | 6,993 | 7,477 | 2.1 |
| 2014-15 | 115 | 1,234 | 239 | 3,062 | 151 | 2,899 | 505 | 7,195 | 7,700 | 3.0 |
Source: Correctional Service Canada.
Note:
The data reflect the offender population in the community under supervision which includes all active offenders on day parole, full parole, statutory release, offenders who are temporarily detained in a non-CSC facility, and offenders who are unlawfully at large for less than 90 days.
The data presented above do not include offenders who were on long term supervision orders (See Figure/Table E4).
Day parole is a type of conditional release granted by the Parole Board of Canada whereby offenders are permitted to participate in community-based activities in preparation for full parole or statutory release. The conditions require offenders to return nightly to an institution or half-way house unless otherwise authorized by the Parole Board of Canada.
Full parole is a type of conditional release granted by the Parole Board of Canada whereby the remainder of the sentence is served under supervision in the community.
Statutory release refers to a conditional release that is subject to supervision after the offender has served two-thirds of the sentence.
*Percent change is measured from the previous year.
These cases reflect the number of offenders on active supervision at fiscal year end. A fiscal year runs from April 1 to March 31 of the following year.
Provincial/territorial community corrections population decreased in 2013-14
Figure C22
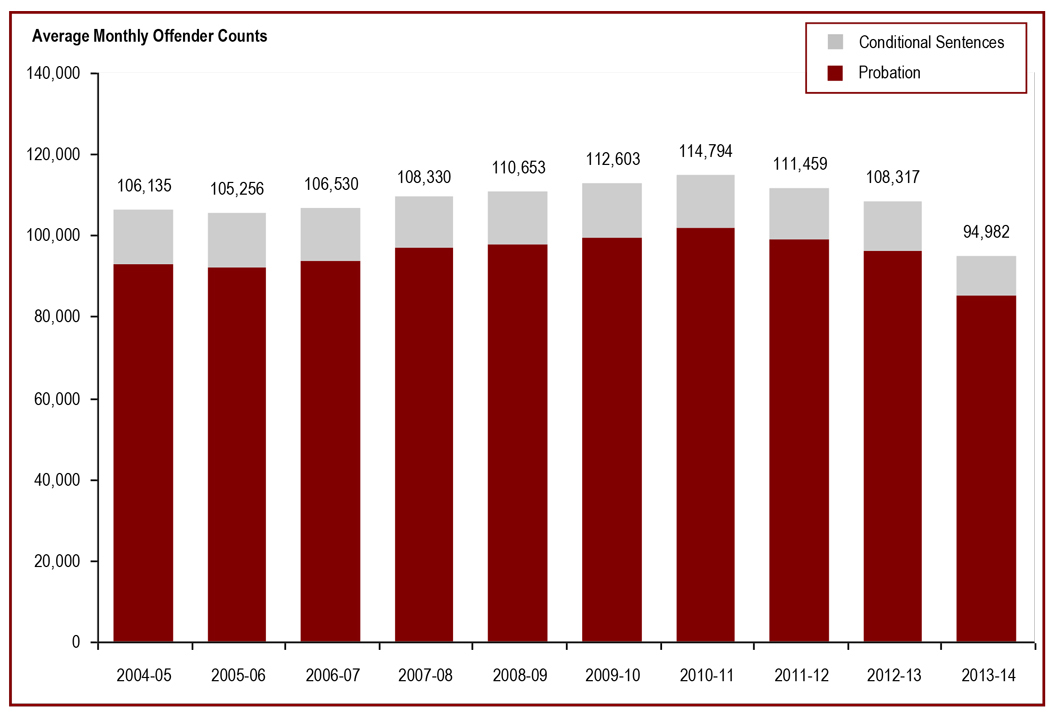
Source: Corrections Key Indicator Report for Adults and Youth, Canadian Centre for Justice Statistics, Statistics Canada.
- The provincial/territorial community corrections population decreased in the last three years. Since 2010-11, it has decreased 17.3% from 114,794 in 2010-11 to 94,982 in 2013-14.
- Since the introduction of the conditional sentence as a sentencing option in September 1996, the number of offenders serving a conditional sentence had increased steadily until 2002-03. In the years since, the number of offenders serving a conditional sentence has fluctuated.
- In 2013-14, the total number of offenders on probation was 84,905, the lowest is has been in the past decade.
Note:
A conditional sentence is a disposition of the court where the offender serves a term of imprisonment in the community under specified conditions. This type of sentence can only be imposed in cases where the term of imprisonment would be less than two years. Conditional sentences have been a provincial and territorial sentencing option since September 1996.
| Year | Average Monthly Offender Counts on Probation |
Average Monthly Offender Counts on Conditional Sentence |
Total |
|---|---|---|---|
| 2004-05 | 92,922 | 13,213 | 106,135 |
| 2005-06 | 92,004 | 13,252 | 105,256 |
| 2006-07 | 93,754 | 12,776 | 106,530 |
| 2007-08 | 96,795 | 12,535 | 108,330 |
| 2008-09 | 97,529 | 13,124 | 110,653 |
| 2009-10 | 99,498 | 13,105 | 112,603 |
| 2010-11 | 101,825 | 12,969 | 114,794 |
| 2011-12 | 98,843 | 12,616 | 111,459 |
| 2012-13 | 96,115 | 12,202 | 108,317 |
| 2013-14 | 84,905 | 10,077 | 94,982 |
Source: Corrections Key Indicator Report for Adults and Youth, Canadian Centre for Justice Statistics, Statistics Canada.
Note:
A conditional sentence is a disposition of the court where the offender serves a term of imprisonment in the community under specified conditions. This type of sentence can only be imposed in cases where the term of imprisonment would be less than two years. Conditional sentences have been a provincial and territorial sentencing option since September 1996.
The number of offenders on provincial parole increased in 2013-14
Figure C23
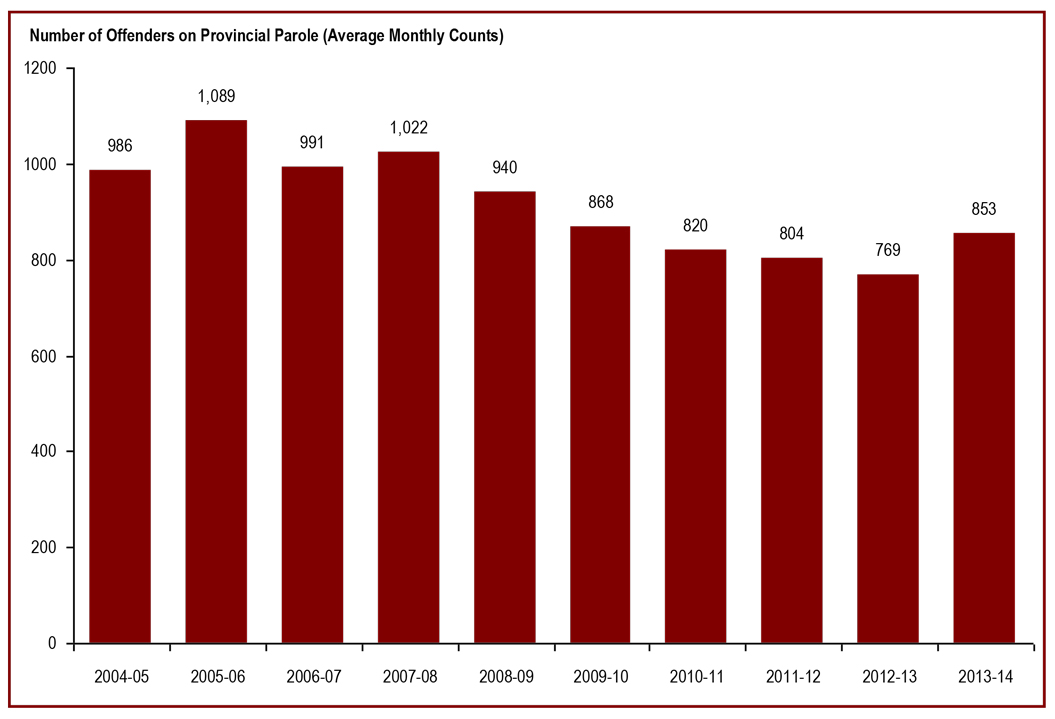
Source: Corrections Key Indicator Report for Adults and Youth, Canadian Centre for Justice Statistics, Statistics Canada.
- The number of offenders on provincial parole increased 11.0% from 769 offenders in 2012-13 to 853 in 2013-14.
- Over the past ten years, there has been a 13.5% decrease in the number of offenders on provincial parole, from 986 in 2004-05 to 853 in 2013-14.
Note:
Provincial parole boards operate in Quebec and Ontario. On April 1, 2007, the Parole Board of Canada assumed responsibility for parole decisions relating to offenders serving sentences in British Columbia's provincial correctional facilities. The Parole Board of Canada has jurisdiction over granting parole to provincial offenders in the Atlantic and Prairie provinces, British Columbia, and to territorial offenders in the Yukon, Nunavut and Northwest Territories.
| Year | Average Monthly Counts on Provincial Parole | ||||||
|---|---|---|---|---|---|---|---|
| Provincial Boards | Parole Board of Canada** | Total | Percent Change | ||||
| Quebec | Ontario | British Columbia* | Total | ||||
| 2004-05 | 517 | 127 | 166 | 810 | 176 | 986 | -8,3 |
| 2005-06 | 628 | 152 | 147 | 926 | 163 | 1,089 | 10.4 |
| 2006-07 | 593 | 142 | 120 | 855 | 136 | 991 | -9.0 |
| 2007-08 | 581 | 205 | n/a | 785 | 237 | 1,022 | 3.1 |
| 2008-09 | 533 | 217 | n/a | 750 | 190 | 940 | -8.0 |
| 2009-10 | 506 | 194 | n/a | 700 | 168 | 868 | -7.7 |
| 2010-11 | 482 | 171 | n/a | 653 | 167 | 820 | -5.6 |
| 2011-12 | 481 | 179 | n/a | 660 | 144 | 804 | -2.0 |
| 2012-13 | 462 | 164 | n/a | 626 | 143 | 769 | -4.4 |
| 2013-14 | 527 | 172 | n/a | 699 | 154 | 853 | 11.0 |
Source: Corrections Key Indicator Report for Adults and Youth, Canadian Centre for Justice Statistics, Statistics Canada.
Note:
*On April 1, 2007, the Parole Board of Canada assumed responsibility for parole decisions relating to offenders serving sentences in British Columbia's provincial correctional facilities.
**The data represent the number of provincial offenders who are released from custody on the authority of the Parole Board of Canada and supervised by the Correctional Service of Canada.
Provincial parole boards operate in Quebec and Ontario. The Parole Board of Canada has jurisdiction over granting parole to provincial offenders in the Atlantic and Prairie provinces, British Columbia, and to territorial offenders in the Yukon, Nunavut and Northwest Territories.
Section D: Conditional Release
The percentage of offenders released from federal penitentiaries at statutory release decreased in the past two years
Figure D1
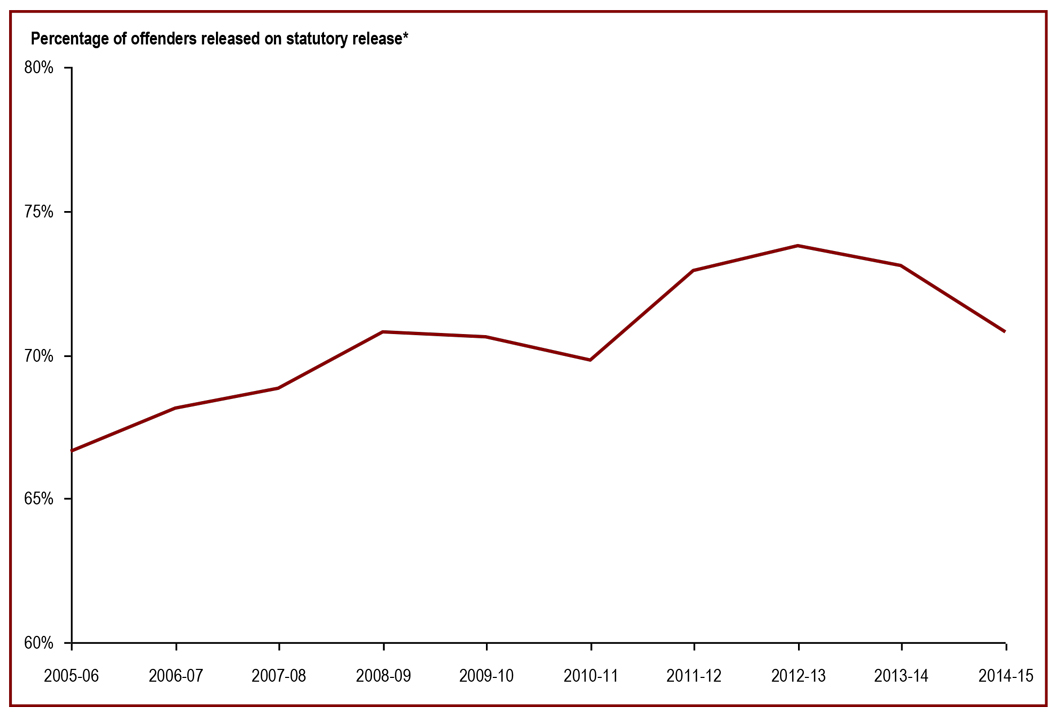
Source: Correctional Service of Canada.
- In fiscal year 2014-15, 70.8% of all releases from federal institutions were at statutory release.
- In fiscal year 2014-15, 84.0% of releases for Aboriginal offenders were at statutory release compared to 66.0% of releases for Non-Aboriginal offenders.
- Over the past ten years, the percentage of releases at statutory release increased from 66.6% to 70.8%.
Note:
*Percentage is calculated based on the number of statutory releases compared to the total releases for each offender group.
The data includes all releases from federal penitentiaries in a given fiscal year excluding offenders with quashed sentences, offenders who died in custody LTSO releases, offenders released at warrant expiry and offenders transferred to foreign countries. An offender may be released more than once a year in cases where a previous release was subject to revocation, suspension, temporary detention, or interruption.
Statutory release refers to a conditional release that is subject to supervision after the offender has served two-thirds of the sentence.
A fiscal year runs from April 1 to March 31 of the following year.
| Aboriginal | Non-Aboriginal | Total Offender Population | |||||||
|---|---|---|---|---|---|---|---|---|---|
| Year | Statutory Release | Total Releases | Percent* | Statutory Release | Total Releases | Percent* | Statutory Release | Total Releases | Percent* |
| 2005-06 | 1,209 | 1,602 | 75.5% | 4,008 | 6,232 | 64.3% | 5,217 | 7,834 | 66.6% |
| 2006-07 | 1,215 | 1,556 | 78.1% | 4,035 | 6,149 | 65.6% | 5,250 | 7,705 | 68.1% |
| 2007-08 | 1,370 | 1,704 | 80.4% | 4,116 | 6,275 | 65.6% | 5,486 | 7,979 | 68.8% |
| 2008-09 | 1,427 | 1,710 | 83.5% | 4,338 | 6,429 | 67.5% | 5,765 | 8,139 | 70.8% |
| 2009-10 | 1,380 | 1,692 | 81.6% | 4,172 | 6,175 | 67.6% | 5,552 | 7,867 | 70.6% |
| 2010-11 | 1,283 | 1,544 | 83.1% | 3,811 | 5,759 | 66.2% | 5,094 | 7,303 | 69.8% |
| 2011-12 | 1,405 | 1,699 | 82.7% | 3,922 | 5,605 | 70.0% | 5,327 | 7,304 | 72.9% |
| 2012-13 | 1,531 | 1,848 | 82.8% | 4,022 | 5,678 | 70.8% | 5,553 | 7,526 | 73.8% |
| 2013-14 | 1,630 | 1,936 | 84.2% | 4,005 | 5,775 | 69.4% | 5,635 | 7,711 | 73.1% |
| 2014-15 | 1,665 | 1,981 | 84.0% | 3,671 | 5,558 | 66.0% | 5,336 | 7,539 | 70.8% |
Source: Correctional Service of Canada.
Note:
*Percentage is calculated based on the number of statutory releases compared to the total releases for each offender group.
The data includes all releases from federal penitentiaries in a given fiscal year excluding offenders with quashed sentences, offenders who died in custody LTSO releases, offenders released at warrant expiry and offenders transferred to foreign countries. An offender may be released more than once a year in cases where a previous release was subject to revocation, suspension, temporary detention , or interruption.
Statutory release refers to a conditional release that is subject to supervision after the offender has served two-thirds of the sentence.
A fiscal year runs from April 1 to March 31 of the following year.
The percentage of offenders released from federal penitentiaries on day and full parole increased in the past two years
Figure D2
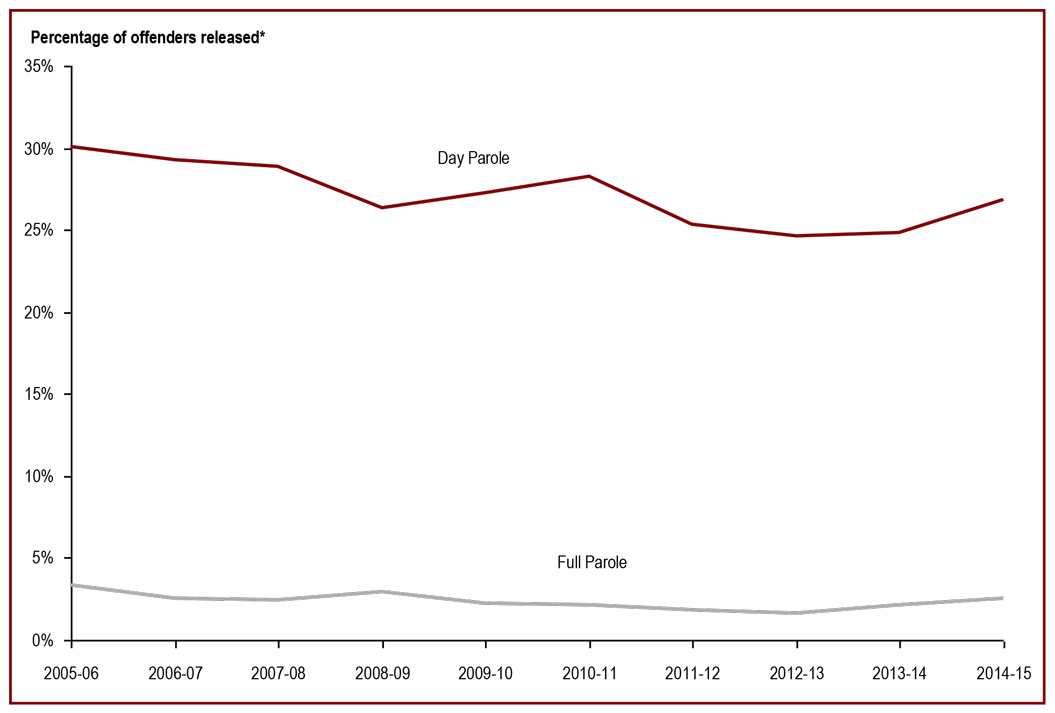
Source: Correctional Service of Canada.
- In fiscal year 2014-15, 26.8% of all releases from federal institutions were on day parole and 2.5% were on full parole.
- In fiscal year 2014-15, 15.4% of releases for Aboriginal offenders were on day parole and 0.5% were on full parole compared to 30.8% and 3.2%, respectively for Non-Aboriginal offenders.
- Over the past ten years, the percentage of releases on day parole decreased from 30.1% to 26.8% and the percentage of releases on full parole decreased from 3.3% to 2.5%.
Note:
Percentage is calculated based on the number of day and full paroles compared to the total releases for each offender group.
The data includes all releases from federal penitentiaries in a given fiscal year excluding offenders with quashed sentences, offenders who died in custody LTSO releases, offenders released at warrant expiry and offenders transferred to foreign countries. An offender may be released more than once a year in cases where a previous release was subject to revocation, suspension, temporary detention, or interruption.
Day parole is a type of conditional release granted by the Parole Board of Canada whereby offenders are permitted to participate in community-based activities in preparation for full parole or statutory release. The conditions require offenders to return nightly to an institution or half-way house unless otherwise authorized by the Parole Board of Canada.
Full parole is a type of conditional release granted by the Parole Board of Canada whereby the remainder of the sentence is served under supervision in the community.
A fiscal year runs from April 1 to March 31 of the following year.
| Aboriginal | Non-Aboriginal | Total Offender Population | ||||||||
|---|---|---|---|---|---|---|---|---|---|---|
| Year | Day Parole | Full Parole | Total Releases | Day Parole | Full Parole | Total Releases | Day Parole | Full Parole | Total Releases | |
| 2005-06 | # | 370 | 23 | 1,602 | 1,990 | 234 | 6,232 | 2,360 | 257 | 7,834 |
| % | 23.1% | 1.4% | 31.9% | 3.8% | 30.1% | 3.3% | ||||
| 2006-07 | # | 326 | 15 | 1,556 | 1,933 | 181 | 6,149 | 2,259 | 196 | 7,705 |
| % | 21.0% | 1.0% | 31.4% | 2.9% | 29.3% | 2.5% | ||||
| 2007-08 | # | 316 | 18 | 1,704 | 1,984 | 175 | 6,275 | 2,300 | 193 | 7,979 |
| % | 18.5% | 1.1% | 31.6% | 2.8% | 28.8% | 2.4% | ||||
| 2008-09 | # | 267 | 16 | 1,710 | 1,873 | 218 | 6,429 | 2,140 | 234 | 8,139 |
| % | 15.6% | 0.9% | 29.1% | 3.4% | 26.3% | 2.9% | ||||
| 2009-10 | # | 299 | 13 | 1,692 | 1,839 | 164 | 6,175 | 2,138 | 177 | 7,867 |
| % | 17.7% | 0.8% | 29.8% | 2.7% | 27.2% | 2.2% | ||||
| 2010-11 | # | 249 | 12 | 1,544 | 1,810 | 138 | 5,759 | 2,059 | 150 | 7,303 |
| % | 16.1% | 0.8% | 31.4% | 2.4% | 28.2% | 2.1% | ||||
| 2011-12 | # | 281 | 13 | 1,699 | 1,567 | 116 | 5,605 | 1,848 | 129 | 7,304 |
| % | 16.5% | 0.8% | 28.0% | 2.1% | 25.3% | 1.8% | ||||
| 2012-13 | # | 308 | 9 | 1,848 | 1,564 | 110 | 5,678 | 1,854 | 119 | 7,526 |
| % | 16.7% | 0.5% | 27.2% | 1.9% | 24.6% | 1.6% | ||||
| 2013-14 | # | 288 | 18 | 1,936 | 1,624 | 146 | 5,775 | 1,912 | 164 | 7,711 |
| % | 14.9% | 0.9% | 28.1% | 2.5% | 24.8% | 2.1% | ||||
| 2014-15 | # | 306 | 10 | 1,981 | 1,711 | 176 | 5,558 | 2,017 | 186 | 7,539 |
| % | 15.4% | 0.5% | 30.8% | 3.2% | 26.8% | 2.5% | ||||
Source: Correctional Service of Canada.
Note:
Percentage is calculated based on the number of day and full paroles compared to the total releases for each offender group.
The data includes all releases from federal penitentiaries in a given fiscal year excluding offenders with quashed sentences, offenders who died in custody LTSO releases, offenders released at warrant expiry and offenders transferred to foreign countries. An offender may be released more than once a year in cases where a previous release was subject to revocation, suspension, temporary detention , or interruption.
Day parole is a type of conditional release granted by the Parole Board of Canada whereby offenders are permitted to participate in community-based activities in preparation for full parole or statutory release. The conditions require offenders to return nightly to an institution or half-way house unless otherwise authorized by the Parole Board of Canada.
Full parole is a type of conditional release granted by the Parole Board of Canada whereby the remainder of the sentence is served under supervision in the community.
A fiscal year runs from April 1 to March 31 of the following year.
The federal day and full parole grant rates increased in 2014-15
Figure D3
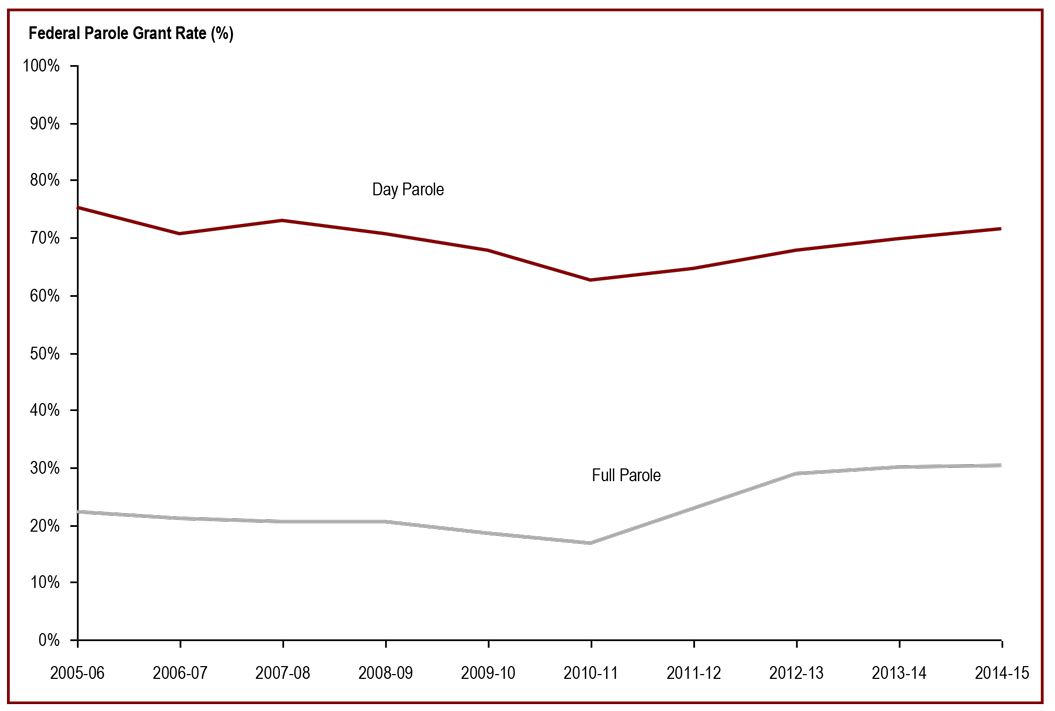
Source: Parole Board of Canada.
- Compared to the grant rates in 2010-11, the lowest in the last decade, the federal day and full parole grant rates increased (8.8% and 13.8%, respectively) in 2014-15.
- Over the last 10 years, women offenders were more likely to be granted day and full parole than men offenders.
Note:
The grant rate represents the percentage of pre-release reviews resulting in a grant by the Parole Board of Canada.
Day parole is a type of conditional release granted by the Parole Board of Canada in which offenders are permitted to participate in community-based activities in preparation for full parole or statutory release. The conditions require offenders to return nightly to an institution or half-way house unless otherwise authorized by the Parole Board of Canada. Not all offenders apply for day parole, and some apply more than once before being granted day parole.
Full parole is a type of conditional release granted by the Parole Board of Canada in which the remainder of the sentence is served under supervision in the community. The Parole Board of Canada must review the cases of all offenders for full parole at the time prescribed by legislation, unless the offender advises the Parole Board of Canada in writing that he/she does not wish to be considered for full parole.
On March 28, 2011, Bill C-59 (Abolition of Early Parole Act) eliminated the accelerated parole review (APR) process, affecting first-time non-violent offenders serving sentences for schedule II and non-scheduled offences, who in 2011-12 were no longer eligible for an APR review. These offenders are now assessed on general reoffending as compared to the APR risk assessment, which considered the risk of committing a violent offence only. To better illustrate historical trends, APR decisions were excluded.
Grant rates should be read with caution. Even though comparisons were made between federal regular day parole and full parole grant rates only, they nevertheless contain an APR residual effect between 2011-12 and 2014-15. A sufficiently large proportion of APR-affected population were granted regular federal day parole and full parole, perhaps inflating the grant rates.
| Type of Release | Year | Granted | Denied | Grant Rate (%) | APR* | |||||
|---|---|---|---|---|---|---|---|---|---|---|
| Women | Men | Women | Men | Women | Men | Total | Directed | Total | ||
| Day Parole | 2005-06 | 128 | 2,111 | 25 | 719 | 83.7 | 74.6 | 75.1 | 970 | 1,345 |
| 2006-07 | 143 | 2,039 | 31 | 876 | 82.2 | 69.9 | 70.6 | 984 | 1,428 | |
| 2007-08 | 162 | 2,001 | 22 | 776 | 88.0 | 72.1 | 73.0 | 977 | 1,482 | |
| 2008-09 | 135 | 1,908 | 24 | 825 | 84.9 | 69.8 | 70.6 | 1,000 | 1,525 | |
| 2009-10 | 151 | 1,959 | 40 | 967 | 79.1 | 67.0 | 67.7 | 947 | 1,491 | |
| 2010-11 | 134 | 1,856 | 40 | 1,151 | 77.0 | 61.7 | 62.6 | 970 | 1,591 | |
| 2011-12 | 248 | 2,492 | 64 | 1,443 | 79.5 | 63.3 | 64.5 | 0 | 0 | |
| 2012-13 | 287 | 2,823 | 71 | 1,417 | 80.2 | 66.6 | 67.6 | 14 | 21 | |
| 2013-14 | 244 | 2,828 | 52 | 1,274 | 82.4 | 69.8 | 69.8 | 39 | 47 | |
| 2014-15 | 293 | 3,026 | 51 | 1,281 | 85.2 | 70.3 | 71.4 | 38 | 45 | |
| Full Parole | 2005-06 | 38 | 533 | 67 | 1,924 | 36.2 | 21.7 | 22.3 | 1,057 | 1,066 |
| 2006-07 | 41 | 523 | 81 | 2,035 | 33.6 | 20.4 | 21.0 | 1,038 | 1,042 | |
| 2007-08 | 40 | 490 | 70 | 1,990 | 36.4 | 19.8 | 20.5 | 1,030 | 1,036 | |
| 2008-09 | 43 | 495 | 61 | 2,017 | 41.3 | 19.7 | 20.6 | 1,097 | 1,100 | |
| 2009-10 | 32 | 459 | 89 | 2,077 | 26.4 | 18.1 | 18.5 | 1,004 | 1,010 | |
| 2010-11 | 20 | 435 | 85 | 2,206 | 19.0 | 16.5 | 16.6 | 1,046 | 1,059 | |
| 2011-12 | 76 | 643 | 126 | 2,317 | 37.6 | 21.7 | 22.7 | 0 | 0 | |
| 2012-13 | 90 | 913 | 141 | 2,329 | 39.0 | 28.2 | 28.9 | 26 | 26 | |
| 2013-14 | 84 | 901 | 103 | 2,201 | 44.9 | 29.0 | 29.9 | 126 | 142 | |
| 2014-15 | 87 | 965 | 106 | 2,305 | 45.1 | 29.5 | 30.4 | 119 | 137 | |
Source: Parole Board of Canada.
Note:
The grant rate represents the percentage of pre-release reviews resulting in a grant by the Parole Board of Canada.
Day parole is a type of conditional release granted by the Parole Board of Canada in which offenders are permitted to participate in community-based activities in preparation for full parole or statutory release. The conditions require offenders to return nightly to an institution or half-way house unless otherwise authorized by the Parole Board of Canada. Not all offenders apply for day parole, and some apply more than once before being granted day parole.
Full parole is a type of conditional release granted by the Parole Board of Canada in which the remainder of the sentence is served under supervision in the community. The Parole Board of Canada must review the cases of all offenders for full parole at the time prescribed by legislation, unless the offender advises the Parole Board of Canada in writing that he/she does not wish to be considered for full parole.
*On March 28, 2011, Bill C-59 (Abolition of Early Parole Act) eliminated the accelerated parole review (APR) process, affecting first-time non-violent offenders serving sentences for schedule II and non-scheduled offences, who in 2011-12 were no longer eligible for an APR review. These offenders are now assessed on general reoffending as compared to the APR risk assessment, which considered the risk of committing a violent offence only. To better illustrate historical trends, APR decisions were excluded from grant rates. However information on APR (those who were directed and total eligible) is included separately in the table for the reader. Grant rates should be read with caution. Even though comparisons were made between federal regular day parole and full parole grant rates only, they nevertheless contain an APR residual effect between 2011-12 and 2014-15. A sufficiently large proportion of APR-affected population were granted regular federal day parole and full parole, perhaps inflating the grant rates.
The federal day parole grant rate for Aboriginal offenders increased in 2014-15
Figure D4
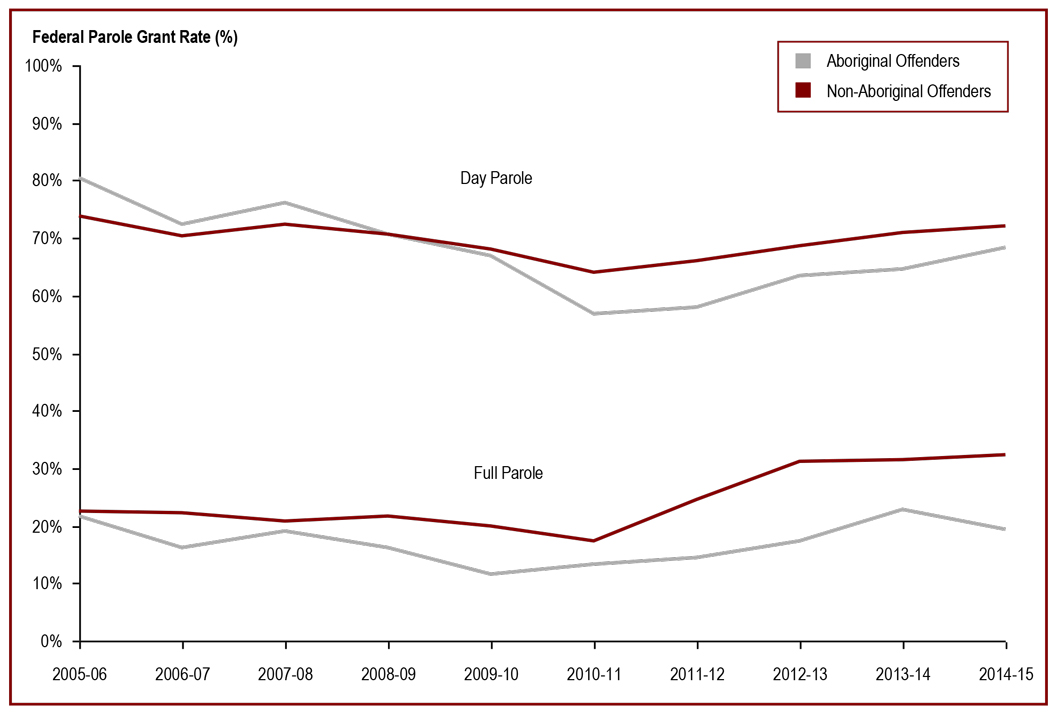
Source: Parole Board of Canada.
- In 2014-15, the federal day parole grant rates increased for Aboriginal offenders; however, the federal full parole grant rates decreased.
- In 2014-15, the federal full parole and day parole grant rates for non-Aboriginal offenders slightly increased from 2013-14.
- In 2014-15, the grant rates for Aboriginal offenders continue to be lower compared to non-Aboriginal offenders for federal day parole (68.2% versus 72.0%, respectively) and full parole (19.4% versus 32.4%, respectively).
Note:
The grant rate represents the percentage of pre-release reviews resulting in a grant by the Parole Board of Canada.
Day parole is a type of conditional release granted by the Parole Board of Canada in which offenders are permitted to participate in community-based activities in preparation for full parole or statutory release. The conditions require offenders to return nightly to an institution or half-way house unless otherwise authorized by the Parole Board of Canada. Not all offenders apply for day parole, and some apply more than once before being granted day parole.
Full parole is a type of conditional release granted by the Parole Board of Canada in which the remainder of the sentence is served under supervision in the community. The Parole Board of Canada must review the cases of all offenders for full parole at the time prescribed by legislation, unless the offender advises the Parole Board of Canada in writing that he/she does not wish to be considered for full parole.
On March 28, 2011, Bill C-59 (Abolition of Early Parole Act) eliminated the accelerated parole review (APR) process, affecting first-time non-violent offenders serving sentences for schedule II and non-scheduled offences, who in 2011-12 were no longer eligible for an APR review. These offenders are now assessed on general reoffending as compared to the APR risk assessment, which considered the risk of committing a violent offence only. To better illustrate historical trends, APR decisions were excluded. Grant rates should be read with caution. Even though comparisons were made between federal regular day parole and full parole grant rates only, they nevertheless contain an APR residual effect between 2011-12 and 2014-15. A sufficiently large proportion of APR-affected population were granted regular federal day parole and full parole, perhaps inflating the grant rates.
| Type of Release | Year | Aboriginal | Non-Aboriginal | Total Number Granted/Denied | ||||
|---|---|---|---|---|---|---|---|---|
| Number Granted | Number Denied | Grant Rate (%) | Number Granted | Number Denied | Grant Rate (%) | |||
| Day Parole | 2005-06 | 490 | 122 | 80.1 | 1,749 | 622 | 73.8 | 2,983 |
| 2006-07 | 447 | 169 | 72.6 | 1,735 | 738 | 70.2 | 3,089 | |
| 2007-08 | 403 | 126 | 76.2 | 1,760 | 672 | 72.4 | 2,961 | |
| 2008-09 | 380 | 156 | 70.9 | 1,663 | 693 | 70.6 | 2,892 | |
| 2009-10 | 398 | 200 | 66.6 | 1,712 | 807 | 68.0 | 3,117 | |
| 2010-11 | 367 | 282 | 56.5 | 1,623 | 909 | 64.1 | 3,181 | |
| 2011-12 | 449 | 335 | 57.3 | 2,291 | 1,172 | 66.2 | 4,247 | |
| 2012-13 | 541 | 312 | 63.4 | 2,569 | 1,176 | 68.6 | 4,598 | |
| 2013-14 | 512 | 290 | 63.8 | 2,560 | 1,036 | 71.2 | 4,398 | |
| 2014-15 | 550 | 256 | 68.2 | 2,769 | 1,076 | 72.0 | 4,651 | |
| Full Parole | 2005-06 | 105 | 389 | 21.3 | 466 | 1,602 | 22.5 | 2,562 |
| 2006-07 | 76 | 400 | 16.0 | 488 | 1,716 | 22.1 | 2,680 | |
| 2007-08 | 82 | 349 | 19.0 | 448 | 1,711 | 20.8 | 2,590 | |
| 2008-09 | 73 | 385 | 15.9 | 465 | 1,693 | 21.5 | 2,616 | |
| 2009-10 | 50 | 396 | 11.2 | 441 | 1,770 | 19.9 | 2,657 | |
| 2010-11 | 71 | 470 | 13.1 | 384 | 1,821 | 17.4 | 2,746 | |
| 2011-12 | 74 | 453 | 14.0 | 645 | 1,990 | 24.5 | 3,162 | |
| 2012-13 | 99 | 464 | 17.6 | 904 | 2,006 | 31.1 | 3,473 | |
| 2013-14 | 118 | 417 | 22.1 | 867 | 1,887 | 31.5 | 3,289 | |
| 2014-15 | 105 | 435 | 19.4 | 947 | 1,976 | 32.4 | 3,463 | |
Source: Parole Board of Canada.
Note:
The grant rate represents the percentage of pre-release reviews resulting in a grant by the Parole Board of Canada.
Day parole is a type of conditional release granted by the Parole Board of Canada in which offenders are permitted to participate in community-based activities in preparation for full parole or statutory release. The conditions require offenders to return nightly to an institution or half-way house unless otherwise authorized by the Parole Board of Canada. Not all offenders apply for day parole, and some apply more than once before being granted day parole.
Full parole is a type of conditional release granted by the Parole Board of Canada in which the remainder of the sentence is served under supervision in the community. The Parole Board of Canada must review the cases of all offenders for full parole at the time prescribed by legislation, unless the offender advises the Parole Board of Canada in writing that he/she does not wish to be considered for full parole.
On March 28, 2011, Bill C-59 (Abolition of Early Parole Act) eliminated the accelerated parole review (APR) process, affecting first-time non-violent offenders serving sentences for schedule II and non-scheduled offences, who in 2011-12 were no longer eligible for an APR review. These offenders are now assessed on general reoffending as compared to the APR risk assessment, which considered the risk of committing a violent offence only. To better illustrate historical trends, APR decisions were excluded. Grant rates should be read with caution. Even though comparisons were made between federal regular day parole and full parole grant rates only, they nevertheless contain an APR residual effect between 2011-12 and 2014-15. A sufficiently large proportion of APR-affected population were granted regular federal day parole and full parole, perhaps inflating the grant rates.
Federal parole hearings involving an Aboriginal Cultural Advisor decreased
Figure D5
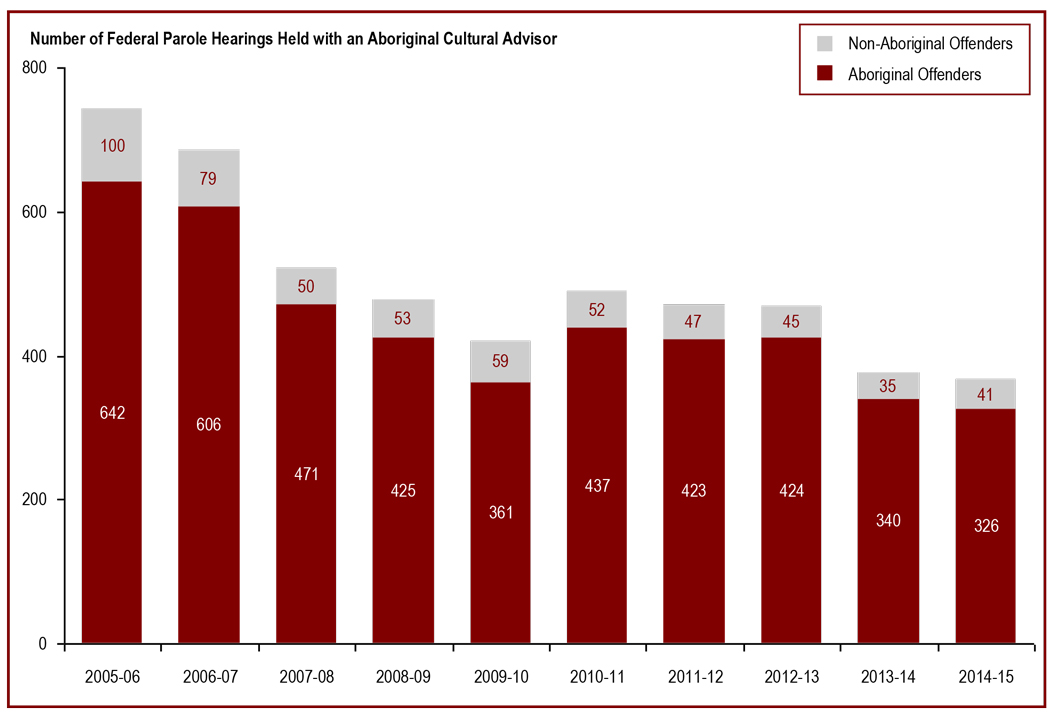
Source: Parole Board of Canada.
- In 2014-15, the number of federal hearings involving an Aboriginal Cultural Advisor decreased to 367 (-2%) compared to 2013-14, and was the lowest of the last 10 years.
- In 2014-15, 37.8% (326) of all federal hearings for Aboriginal offenders were held with an Aboriginal Cultural Advisor.
- In 2014-15, 1.1% (41) of all federal hearings for offenders who did not self-identify as Aboriginal were held with an Aboriginal Cultural Advisor.
Note:
The presence of an Aboriginal Cultural Advisor is an alternative approach to the traditional parole hearing, and was introduced by the Parole Board of Canada to ensure that conditional release hearings were sensitive to Aboriginal cultural values and traditions. This type of hearing is available to both Aboriginal and non-Aboriginal offenders.
| Year | Hearings held with an Aboriginal Cultural Advisor | ||||||||
|---|---|---|---|---|---|---|---|---|---|
| Aboriginal Offenders | Non-Aboriginal Offenders | All Offenders | |||||||
| Total Hearings | With Cultural Advisor | Total Hearings | With Cultural Advisor | Total Hearings | With Cultural Advisor | ||||
| # | # | % | # | # | % | # | # | % | |
| 2005-06 | 1,410 | 642 | 45.5 | 5,169 | 100 | 1.9 | 6,579 | 742 | 11.3 |
| 2006-07 | 1,367 | 606 | 44.3 | 5,269 | 79 | 1.5 | 6,636 | 685 | 10.3 |
| 2007-08 | 1,252 | 471 | 37.6 | 4,749 | 50 | 1.1 | 6,001 | 521 | 8.7 |
| 2008-09 | 1,204 | 425 | 35.3 | 4,416 | 53 | 1.2 | 5,620 | 478 | 8.5 |
| 2009-10 | 1,160 | 361 | 31.1 | 4,520 | 59 | 1.3 | 5,680 | 420 | 7.4 |
| 2010-11 | 1,193 | 437 | 36.6 | 4,387 | 52 | 1.2 | 5,580 | 489 | 8.8 |
| 2011-12 | 1,209 | 423 | 35.0 | 4,702 | 47 | 1.0 | 5,911 | 470 | 8.0 |
| 2012-13 | 1,275 | 424 | 33.3 | 4,685 | 45 | 1.0 | 5,960 | 469 | 7.9 |
| 2013-14 | 878 | 340 | 38.7 | 3,724 | 35 | 0.9 | 4,602 | 375 | 8.1 |
| 2014-15 | 863 | 326 | 37.8 | 3,873 | 41 | 1.1 | 4,736 | 367 | 7.7 |
Source: Parole Board of Canada.
Note:
The presence of an Aboriginal Cultural Advisor is an alternative approach to the traditional parole hearing, and was introduced by the Parole Board of Canada to ensure that conditional release hearings were sensitive to Aboriginal cultural values and traditions. This type of hearing is available to both Aboriginal and non-Aboriginal offenders.
Proportion of sentence served prior to being released on parole decreased
Figure D6
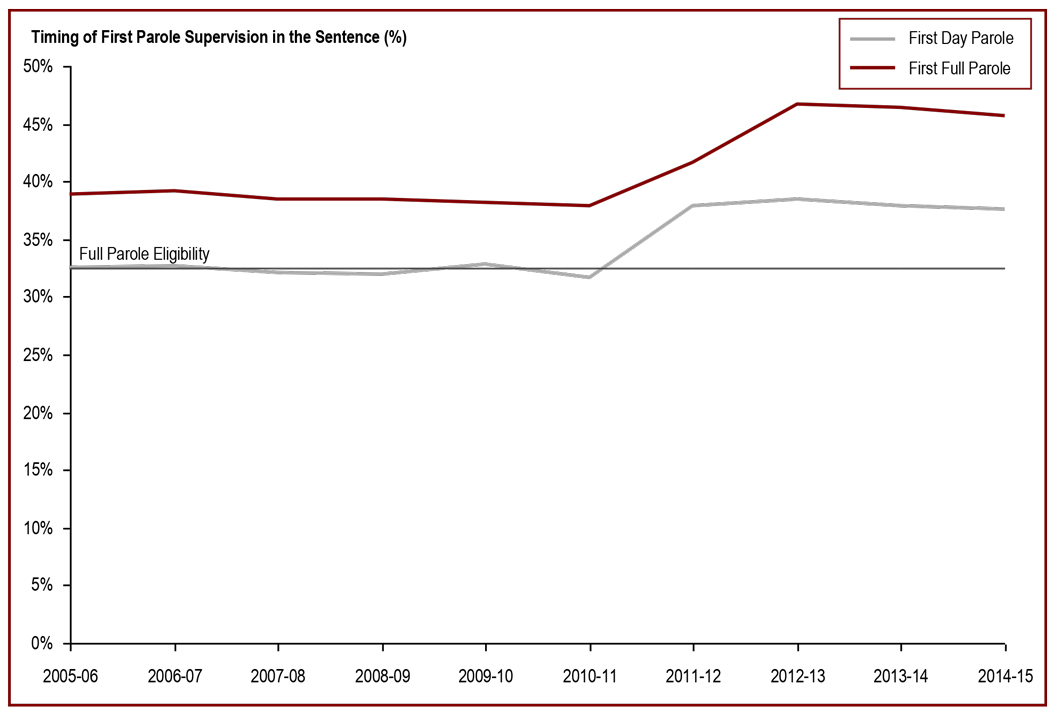
Source: Parole Board of Canada.
- In 2014-15, the average proportion of sentence served before the first parole release for offenders serving determinate sentences decreased to 37.6% (-0.4%) for day parole and to 45.6% (-0.9%) for full parole, compared to the previous year.
- In 2014-15, female offenders served an average of 1.3% less of their sentences before the first federal full parole supervision than male offenders compared to 2.8% in 2013-14.
- In 2014-15, female offenders and male offenders served an average of 6.7% and 5.0% more of their sentences before the first federal day parole supervision and 8.3% and 6.4% more of their sentences before the first federal full parole supervision, compared to 2005-06.
Note:
Timing of parole in the sentence refers to the percentage of the sentence served at the time the first day parole or full parole starts during the sentence. In most cases a full parole is preceded by a day parole.
These calculations are based on sentences under federal jurisdiction, excluding life sentences and indeterminate sentences.
Offenders (other than those serving life or indeterminate sentences or subject to judicial determination) normally become eligible for full parole after serving 1/3 of their sentence or seven years, whichever is less. Eligibility for day parole is normally at 6 months before full parole eligibility.
The increases in the average proportion of time served after 2010-11 are in part due to the effect of Bill C-59 and were driven primarily by offenders serving sentences for schedule II and non-scheduled offences (some of whom were former APR-eligible offenders).
| Year | Type of Supervision | |||||
|---|---|---|---|---|---|---|
| First Day Parole | First Full Parole | |||||
| Women | Men | Total | Women | Men | Total | |
| Percentage of sentence incarcerated | ||||||
| 2005-06 | 28.5 | 32.9 | 32.5 | 36.1 | 39.3 | 38.9 |
| 2006-07 | 27.4 | 33.2 | 32.6 | 37.2 | 39.3 | 39.1 |
| 2007-08 | 30.3 | 32.3 | 32.1 | 37.9 | 38.4 | 38.4 |
| 2008-09 | 28.2 | 32.4 | 31.9 | 36.6 | 38.7 | 38.5 |
| 2009-10 | 29.5 | 33.2 | 32.8 | 36.1 | 38.5 | 38.2 |
| 2010-11 | 29.2 | 31.8 | 31.5 | 36.6 | 38.1 | 37.9 |
| 2011-12 | 35.0 | 38.1 | 37.8 | 40.3 | 41.7 | 41.6 |
| 2012-13 | 38.9 | 38.3 | 38.4 | 45.6 | 46.8 | 46.7 |
| 2013-14 | 34.9 | 38.3 | 38.0 | 44.0 | 46.8 | 46.5 |
| 2013-14 | 35.2 | 37.9 | 37.6 | 44.4 | 45.7 | 45.6 |
Source: Parole Board of Canada.
Note:
Timing of parole in the sentence refers to the percentage of the sentence served at the time the first day parole or full parole starts during the sentence. In most cases a full parole is preceded by a day parole.
These calculations are based on sentences under federal jurisdiction, excluding life sentences and indeterminate sentences.
Offenders (other than those serving life or indeterminate sentences or subject to judicial determination) normally become eligible for full parole after serving 1/3 of their sentence or seven years, whichever is less. Eligibility for day parole is normally at 6 months before full parole eligibility.
The increases in the average proportion of time served after 2010-11 are in part due to the effect of Bill C-59 and were driven primarily by offenders serving sentences for schedule II and non-scheduled offences (some of whom were former APR-eligible offenders).
Aboriginal offenders serve a higher proportion of their sentences before being released on parole
Figure D7

Source: Parole Board of Canada.
- In 2014-15, the average proportions of time served before the first federal day parole supervision period and the first federal full parole supervision period were lower for non-Aboriginal offenders than for Aboriginal offenders (37.1% versus 40.9%, and 45.5% versus 47.2%, respectively).
Note:
Timing of parole in the sentence refers to the percentage of the sentence served at the time the first day parole or full parole starts during the sentence. In most cases a full parole is preceded by a day parole.
These calculations are based on sentences under federal jurisdiction, excluding life sentences and indeterminate sentences.
Offenders (other than those serving life or indeterminate sentences or subject to judicial determination) normally become eligible for full parole after serving 1/3 of their sentence or seven years, whichever is less. Eligibility for day parole is normally at 6 months before full parole eligibility.
The increases in the average proportion of time served after 2010-11 are in part due to the effect of Bill C-59 and were driven primarily by offenders serving sentences for schedule II and non-scheduled offences (some of whom were former APR-eligible offenders).
| Year | Type of Supervision | |||||
|---|---|---|---|---|---|---|
| First Day Parole | First Full Parole | |||||
| Aboriginal | Non-Aboriginal | Total | Aboriginal | Non-Aboriginal | Total | |
| Percentage of sentence incarcerated | ||||||
| 2005-06 | 36.6 | 31.8 | 32.5 | 42.3 | 38.5 | 38.9 |
| 2006-07 | 37.4 | 31.9 | 32.6 | 41.1 | 38.9 | 39.1 |
| 2007-08 | 38.4 | 31.1 | 32.1 | 41.2 | 38.1 | 38.4 |
| 2008-09 | 38.3 | 31.0 | 31.9 | 41.0 | 38.2 | 38.5 |
| 2009-10 | 38.9 | 31.8 | 32.8 | 41.2 | 37.9 | 38.2 |
| 2010-11 | 37.2 | 30.8 | 31.5 | 41.8 | 37.5 | 37.9 |
| 2011-12 | 41.8 | 37.1 | 37.8 | 44.0 | 41.4 | 41.6 |
| 2012-13 | 42.1 | 37.7 | 38.4 | 48.8 | 46.5 | 46.7 |
| 2013-14 | 43.0 | 37.1 | 38.0 | 49.0 | 46.2 | 46.5 |
| 2014-15 | 40.9 | 37.1 | 37.6 | 47.2 | 45.5 | 45.6 |
Source: Parole Board of Canada.
Note:
Timing of parole in the sentence refers to the percentage of the sentence served at the time the first day parole or full parole starts during the sentence. In most cases a full parole is preceded by a day parole.
These calculations are based on sentences under federal jurisdiction, excluding life sentences and indeterminate sentences.
Offenders (other than those serving life or indeterminate sentences or subject to judicial determination) normally become eligible for full parole after serving 1/3 of their sentence or seven years, whichever is less. Eligibility for day parole is normally at 6 months before full parole eligibility.
The increases in the average proportion of time served after 2010-11 are in part due to the effect of Bill C-59 and were driven primarily by offenders serving sentences for schedule II and non-scheduled offences (some of whom were former APR-eligible offenders).
The majority of federal day paroles are successfully completed
Figure D8
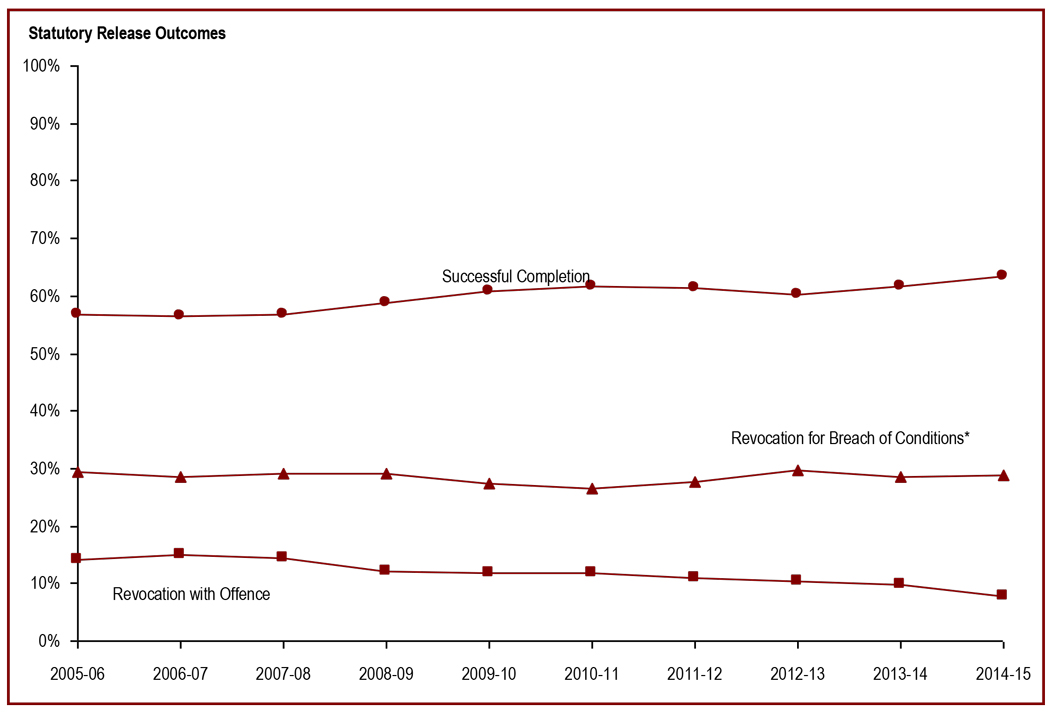
Source: Parole Board of Canada.
- Since 2005-06, over 80% of federal day paroles have been successfully completed.
- In 2014-15, the successful completion rate of federal day parole was 90.9%, the highest of the last 10 years and 1.6% higher than in 2013-14.
- During the five-year period between 2010-11 and 2014-15, the successful completion rate for offenders released on APR day parole was higher (90.4%) than for offenders released on regular day parole (88.8%).
- In 2014-15, 0.9% of federal day paroles ended with a non-violent offence, none ended with a violent offence.
- In 2014-15, the successful completion rate of federal day parole was higher for male offenders than for female offenders (91.1% versus 89.4%, respectively).
Note:
*Revocation for Breach of Conditions includes revocation with outstanding charges.
A day parole is considered successful if it was completed without a return to prison for a breach of conditions or for a new offence.
| Federal Full Parole Outcomes* | 2010-11 | 2011-12 | 2012-13 | 2013-14 | 2014-15 | |||||
|---|---|---|---|---|---|---|---|---|---|---|
| # | % | # | % | # | % | # | % | # | % | |
| Successful Completion | ||||||||||
| Regular | 1,750 | 86.8 | 1,912 | 87.4 | 2,737 | 88.6 | 2,765 | 89.3 | 2,770 | 90.8 |
| Accelerated | 871 | 90.2 | 364 | 89.2 | 21 | 95.5 | 27 | 100.0 | 36 | 100.0 |
| Total | 2,621 | 87.9 | 2,276 | 87.7 | 2,758 | 88.6 | 2,792 | 89.3 | 2,806 | 90.9 |
| Revocation for Breach of Conditions** | ||||||||||
| Regular | 214 | 10.6 | 232 | 10.6 | 288 | 9.3 | 293 | 9.5 | 253 | 8.3 |
| Accelerated | 72 | 7.5 | 35 | 8.6 | 1 | 4.5 | 0 | 0.0 | 0 | 0.0 |
| Total | 286 | 9.6 | 267 | 10.3 | 289 | 9.3 | 293 | 9.4 | 253 | 8.2 |
| Revocation with Non-Violent Offence | ||||||||||
| Regular | 41 | 2.0 | 37 | 1.7 | 59 | 1.9 | 34 | 1.1 | 27 | 0.9 |
| Accelerated | 23 | 2.4 | 8 | 2.0 | 0 | 0.0 | 0 | 0.0 | 0 | 0.0 |
| Total | 64 | 2.1 | 45 | 1.7 | 59 | 1.9 | 34 | 1.1 | 27 | 0.9 |
| Revocation with Violent Offence*** | ||||||||||
| Regular | 10 | 0.5 | 7 | 0.3 | 6 | 0.2 | 6 | 0.2 | 0 | 0.0 |
| Accelerated | 0 | 0.0 | 1 | 0.2 | 0 | 0.0 | 0 | 0.0 | 0 | 0.0 |
| Total | 10 | 0.3 | 8 | 0.3 | 6 | 0.2 | 6 | 0.2 | 0 | 0.0 |
| Total | ||||||||||
| Regular | 2,015 | 67.6 | 2,188 | 84.3 | 3,090 | 99.3 | 3,098 | 99.1 | 3,050 | 98.8 |
| Accelerated | 966 | 32.4 | 408 | 15.7 | 22 | 0.7 | 27 | 0.9 | 36 | 1.2 |
| Total | 2,981 | 100.0 | 2,596 | 100.0 | 3,112 | 100.0 | 3,125 | 100.0 | 3,086 | 100.0 |
Source: Parole Board of Canada.
Note:
*Revocation for Breach of Conditions includes revocation with outstanding charges.
**Violent offences include murder and Schedule I offences (listed in the Corrections and Conditional Release Act) such as assaults, sexual offences, arson, abduction, robbery and some weapon offences.
A day parole is considered successful if it was completed without a return to prison for a breach of conditions or for a new offence.
The majority of federal full paroles are successfully completed
Figure D9
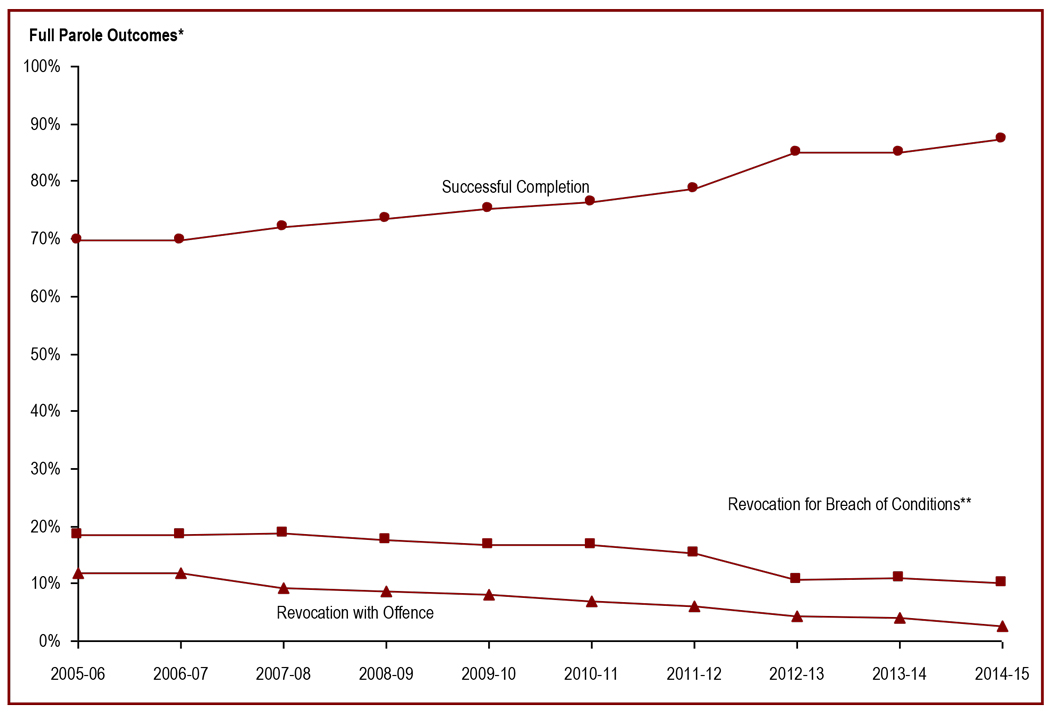
Source: Parole Board of Canada.
- In 2014-15, the successful completion rate of federal full parole was 87.2%, an increase of 10.9% compared to 2010-11.
- In the last five years, the successful completion rate on regular full parole was on average 2.1% higher (82.9% compared to 80.8%) than the rate on APR full parole.
- In 2014-15, 2.7% of federal full paroles ended with a non-violent offence and none with a violent offence. That represents a decrease of 0.8% and 0.5% compared to 2013-14.
- In 2014-15, the successful completion rate of federal full parole was higher for female offenders than for male offenders (93.1% versus 86.8%, respectively).
Note:
*Excludes offenders serving indeterminate sentences because they do not have a warrant expiry date and can only successfully complete full parole upon [their] death.
**Revocation for Breach of Conditions includes revocation with outstanding charges.
A full parole is considered successful if it was completed without a return to prison for a breach of conditions or for a new offence.
| Federal Full Parole Outcomes* | 2010-11 | 2011-12 | 2012-13 | 2013-14 | 2014-15 | |||||
|---|---|---|---|---|---|---|---|---|---|---|
| # | % | # | % | # | % | # | % | # | % | |
| Successful Completion | ||||||||||
| Regular | 360 | 80.2 | 335 | 82.5 | 425 | 80.0 | 578 | 81.9 | 731 | 87.2 |
| Accelerated | 663 | 74.4 | 668 | 76.8 | 589 | 89.0 | 246 | 93.2 | 96 | 87.3 |
| Total | 1,023 | 76.3 | 1,023 | 78.6 | 1,014 | 85.0 | 824 | 84.9 | 827 | 87.2 |
| Revocation for Breach of Conditions** | ||||||||||
| Regular | 55 | 12.2 | 54 | 13.3 | 78 | 14.7 | 93 | 13.2 | 83 | 9.9 |
| Accelerated | 168 | 18.9 | 146 | 16.3 | 50 | 7.6 | 14 | 5.3 | 12 | 10.9 |
| Total | 223 | 16.6 | 200 | 15.4 | 128 | 10.7 | 107 | 11.0 | 95 | 10.0 |
| Revocation with Non-Violent Offence | ||||||||||
| Regular | 26 | 5.8 | 15 | 3.7 | 22 | 4.1 | 30 | 4.2 | 24 | 2.9 |
| Accelerated | 54 | 6.1 | 57 | 6.4 | 22 | 3.3 | 4 | 1.5 | 2 | 1.8 |
| Total | 80 | 6.0 | 72 | 5.5 | 44 | 3.7 | 34 | 3.5 | 26 | 2.7 |
| Revocation with Violent Offence*** | ||||||||||
| Regular | 8 | 1.8 | 2 | 0.5 | 6 | 1.1 | 5 | 0.7 | 0 | 0.0 |
| Accelerated | 6 | 0.7 | 5 | 0.6 | 1 | 0.2 | 0 | 0.0 | 0 | 0.0 |
| Total | 14 | 1.0 | 7 | 0.5 | 7 | 0.6 | 5 | 0.5 | 0 | 0.0 |
| Total | ||||||||||
| Regular | 449 | 33.5 | 406 | 31.2 | 531 | 44.5 | 706 | 72.8 | 838 | 88.4 |
| Accelerated | 891 | 66.5 | 896 | 68.8 | 662 | 55.5 | 264 | 27.2 | 100 | 11.6 |
| Total | 1,340 | 100.0 | 1,302 | 100.0 | 1,193 | 100.0 | 970 | 100.0 | 948 | 100.0 |
Source: Parole Board of Canada.
Note:
*Excludes offenders serving indeterminate sentences because they do not have a warrant expiry date and can only successfully complete full parole upon [their] death.
**Revocation for Breach of Conditions includes revocation with outstanding charges.
***Violent offences include murder and Schedule I offences (listed in the Corrections and Conditional Release Act) such as assaults, sexual offences, arson, abduction, robbery and some weapon offences.
A full parole is considered successful if it was completed without a return to prison for a breach of conditions or for a new offence.
Statutory releases have the lowest rate of successful completion
Figure D10
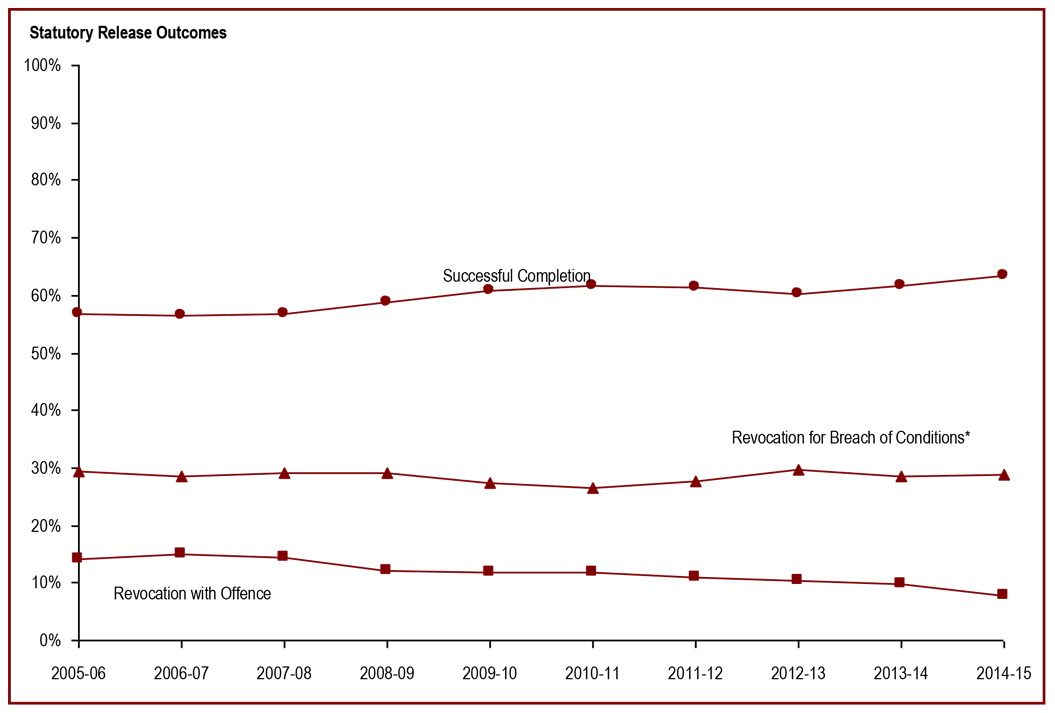
Source: Parole Board of Canada.
- Over the past ten years, the successful completion rate for offenders on statutory release increased from 56.7% to 63.4%.
- In 2014-15, 6.9% of statutory releases ended with a non-violent offence and 0.9% with a violent offence. This represents a decrease of 2.7% and 1.3% compared to 2010-/11.
- Over the last five years, the successful completion rates of statutory releases were higher for female offenders than for male offenders. In 2014-15, female offenders registered a success rate 2.1% higher than male offenders (65.4% versus 63.3%). When compared with the year 2010-11, the successful completion rate of statutory releases for female offenders decreased by 2.0% (from 67.4% to 65.4%). Male offenders, however, have been more successful in their completion of statutory release compared to 2010-11, increasing their success rate by 1.8% (from 61.5% to 63.3%).
Note:
*Revocation for Breach of Conditions includes revocation with outstanding charges.
A statutory release is considered successful if it was completed without a return to prison for a breach of conditions or for a new offence.
An offender serving a determinate sentence, if he/she is not detained, will be subject to statutory release after serving 2/3 of his/her sentence if he/she is not on full parole at that time. On statutory release, an offender is subject to supervision until the end of his/her sentence.
| Statutory Release Outcomes | 2010-11 | 2011-12 | 2012-13 | 2013-14 | 2014-15 | |||||
|---|---|---|---|---|---|---|---|---|---|---|
| # | % | # | % | # | % | # | % | # | % | |
| Successful Completion | 3,453 | 61.8 | 3,429 | 61.3 | 3,738 | 60.1 | 3,819 | 61.6 | 3,744 | 63.4 |
| Revocation for Breach of Conditions* | 1,474 | 26.4 | 1,548 | 27.7 | 1,848 | 29.7 | 1,767 | 28.5 | 1,697 | 28.8 |
| Revocation with Non-Violent Offence | 534 | 9.6 | 487 | 8.7 | 509 | 8.2 | 514 | 8.3 | 410 | 6.9 |
| Revocation with Violent Offence** | 124 | 2.2 | 128 | 2.3 | 129 | 2.1 | 95 | 1.5 | 51 | 0.9 |
| Total | 5,585 | 100 | 5,592 | 100 | 6,224 | 100 | 6,195 | 100 | 5,902 | 100 |
Source: Parole Board of Canada.
Note:
*Revocation for Breach of Conditions includes revocation with outstanding charges.
**Violent offences include murder and Schedule I offences (listed in the Corrections and Conditional Release Act) such as assaults, sexual offences, arson, abduction, robbery and some weapon offences.
A statutory release is considered successful if it was completed without a return to prison for a breach of conditions or for a new offence.
An offender serving a determinate sentence, if he/she is not detained, will be subject to statutory release after serving 2/3 of his/her sentence if he/she is not on full parole at that time. On statutory release, an offender is subject to supervision until the end of his/her sentence.
Over the past decade, the rate of violent convictions for offenders while under supervision has declined
Figure D11
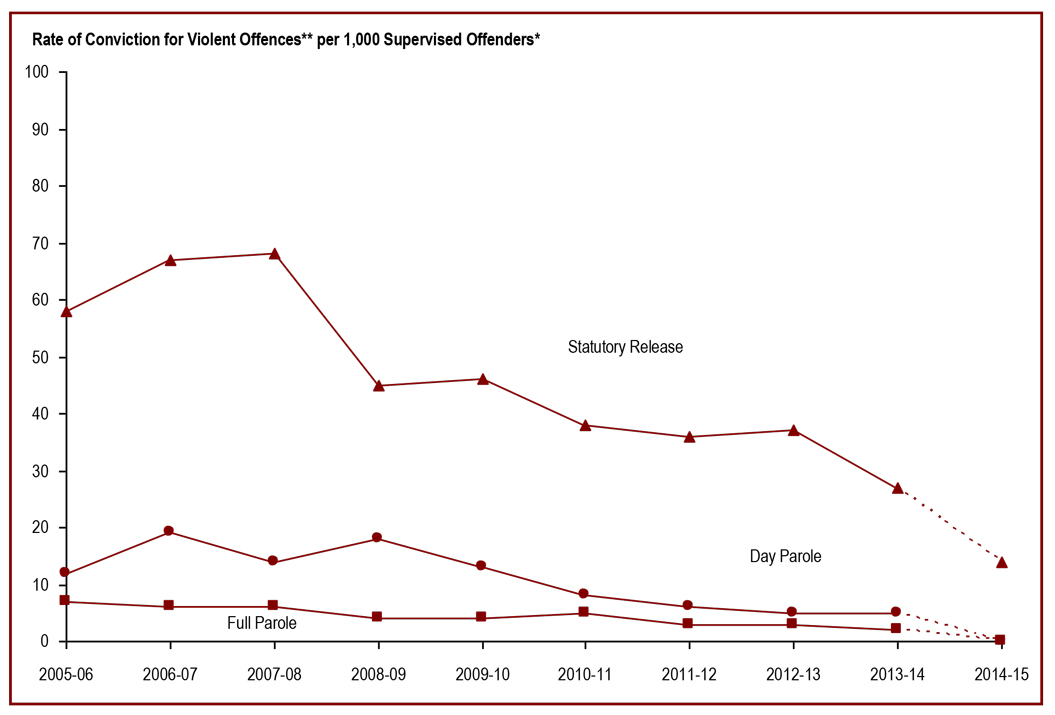
Source: Parole Board of Canada.
- The rates of convictions per 1,000 supervised offenders for violent offences** in 2013-14 decreased by 7 for day parole, by 5 for full parole and by 31 for statutory release, compared to 2005-06.
- Those offenders under discretionary release (day and full parole) are less likely to be convicted of a violent offence while under supervision than those on statutory release.
Note:
*Supervised offenders include offenders who are on parole, statutory release, those temporarily detained in federal institutions, and those who are unlawfully at large.
**Violent offences include murder and Schedule I offences (listed in the Corrections and Conditional Release Act) such as assaults, sexual offences, arson, abduction, robbery and some weapon offences.
Day and full parole include those offenders serving determinate and indeterminate sentences.
The dotted line between 2013-14 and 2014-15 is intended to signify that due to delays in the court process, these numbers under-represent the actual number of convictions, as verdicts may not have been reached by year-end.
| Year | # of Offenders Convicted for Violent Offences | Rate per 1,000 Supervised Offenders* | |||||
|---|---|---|---|---|---|---|---|
| Day Parole | Full Parole | Statutory Release | Total | Day Parole | Full Parole | Statutory Release | |
| 2005-06 | 16 | 28 | 178 | 222 | 12 | 7 | 58 |
| 2006-07 | 25 | 21 | 213 | 259 | 19 | 6 | 67 |
| 2007-08 | 18 | 22 | 213 | 253 | 14 | 6 | 68 |
| 2008-09 | 22 | 17 | 152 | 191 | 18 | 4 | 45 |
| 2009-10 | 17 | 16 | 149 | 182 | 13 | 4 | 46 |
| 2010-11 | 10 | 19 | 124 | 153 | 8 | 5 | 38 |
| 2011-12 | 8 | 10 | 128 | 146 | 6 | 3 | 36 |
| 2012-13 | 6 | 11 | 129 | 146 | 5 | 3 | 37 |
| 2013-14 | 6 | 6 | 95 | 107 | 5 | 2 | 27 |
| 2014-15** | 0 | 1 | 51 | 52 | 0 | 0 | 14 |
Source: Parole Board of Canada.
Note:
*Supervised offenders include offenders who are on parole, statutory release, those temporarily detained in federal institutions, and those who are unlawfully at large.
**Due to delays in the court processes, the numbers under-represent the actual number of convictions, as verdicts may not have been reached by year-end.
Day and full parole include those offenders serving determinate and indeterminate sentences.
***Violent offences include murder and Schedule I offences (listed in the Corrections and Conditional Release Act) such as assaults, sexual offences, arson, abduction, robbery and some weapon offences.
The number of offenders granted temporary absences decreased in 2014-15
Figure D12
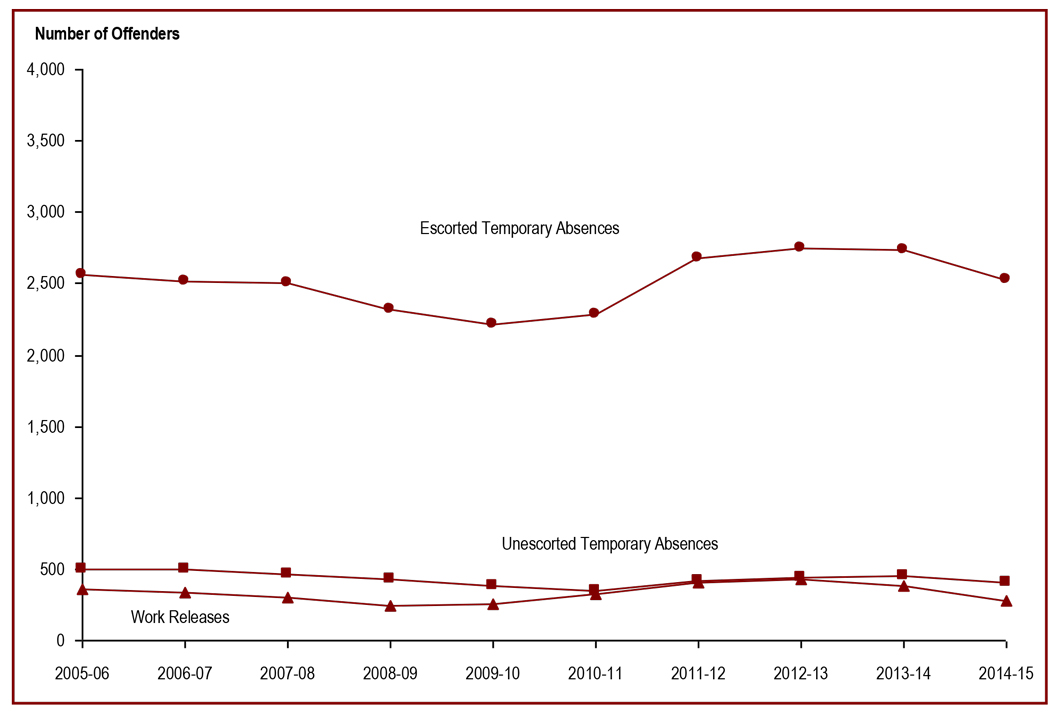
Source: Correctional Service Canada.
- The number of offenders receiving escorted temporary absences has decreased by 7.7%, from 2,734 in 2013-14 to 2,524 in 2014-15. The number of offenders receiving unescorted temporary absences decreased by 9.6%, from 447 in 2013-14 to 404 in 2014-15.
- The number of offenders receiving work releases has decreased by 28.6%, from 385 in 2013-14 to 275 in 2014-15.
- For the past 10 years, the average successful completion rates for escorted and unescorted temporary absences was 99% and 95% for work releases.
Note:
A temporary absence is permission given to an eligible offender to be away from the normal place of confinement for medical, administrative, community service, family contact, personal development for rehabilitative purposes, or compassionate reasons, including parental responsibilities.
A work release is a structured program of release of specified duration for work or community service outside the penitentiary, under the supervision of a staff member or other authorized person or organization.
These numbers depict the number of offenders who received at least one temporary absence permit (excluding those for medical purposes) or at least one work release. An offender may be granted more than one temporary absence permit or work release over a period of time.
| Year | Temporary Absences | Work Releases | ||||
|---|---|---|---|---|---|---|
| Escorted | Unescorted | |||||
| # of Offenders | # of Permits | # of Offenders | # of Permits | # of Offenders | # of Permits | |
| 2005-06 | 2,558 | 36,959 | 498 | 2,939 | 355 | 997 |
| 2006-07 | 2,519 | 39,422 | 499 | 4,122 | 340 | 729 |
| 2007-08 | 2,500 | 41,460 | 464 | 3,679 | 301 | 616 |
| 2008-09 | 2,321 | 36,116 | 431 | 3,649 | 239 | 654 |
| 2009-10 | 2,210 | 35,774 | 386 | 3,280 | 251 | 1,053 |
| 2010-11 | 2,289 | 40,035 | 351 | 3,095 | 321 | 1,303 |
| 2011-12 | 2,682 | 44,371 | 414 | 3,860 | 408 | 820 |
| 2012-13 | 2,746 | 47,798 | 443 | 3,693 | 432 | 766 |
| 2013-14 | 2,734 | 49,425 | 447 | 3,987 | 385 | 593 |
| 2014-15 | 2,524 | 49,332 | 404 | 3,522 | 275 | 370 |
Source: Correctional Service Canada.
Note:
A temporary absence is permission given to an eligible offender to be away from the normal place of confinement for medical, administrative, community service, family contact, personal development for rehabilitative purposes, or compassionate reasons, including parental responsibilities.
A work release is a structured program of release of specified duration for work or community service outside the penitentiary, under the supervision of a staff member or other authorized person or organization.
These numbers depict the number of offenders who received at least one temporary absence permit (excluding those for medical purposes) or at least one work release. An offender may be granted more than one temporary absence permit or work release over a period of time.
Section E: Statistics on Special Applications of Criminal Justice
The number of initial detention reviews decreased in 2014-15
Figure E1
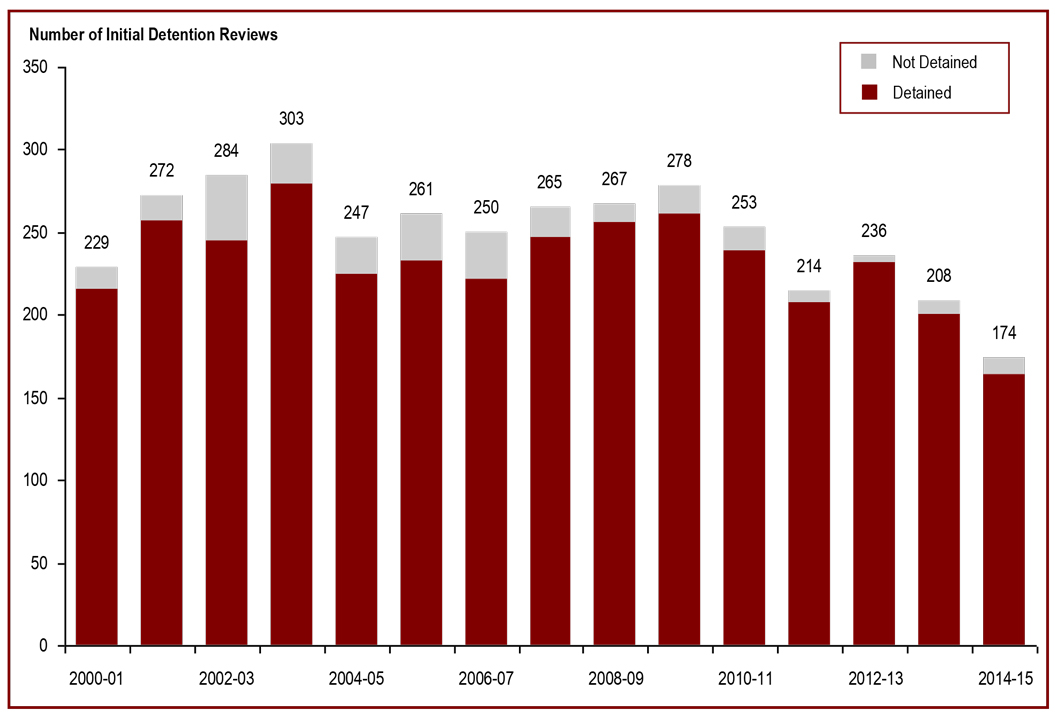
Source: Parole Board of Canada.
- The annual number of initial detention reviews has been fluctuating since 2000-01.
- Out of 3,741 initial detention reviews since 2000-01, 93.1% have resulted in a decision to detain.
- In 2014-15, the initial detention rate was 94.3%, a decrease of 1.9% compared to 2013-14.
- Since 2000-01, men accounted for 98.3% of all referrals for detention. During the same period, 64 women were referred for detention and 58 were detained.
- In 2014-15, Aboriginal offenders accounted for 24.6% of the Total In Custody Population serving determinate sentences while they accounted for 42.0% of offenders referred for detention and 39.1% of offenders detained.
Note:
According to the Corrections and Conditional Release Act, an offender entitled to statutory release after serving two-thirds of the sentence may be held in custody until warrant expiry if it is established that the offender is likely to commit, before the expiry of his/her sentence, an offence causing death or serious harm, a serious drug offence or a sex offence involving a child.
| Year | Outcome of Initial Detention Reviews | Total | |||||||||
|---|---|---|---|---|---|---|---|---|---|---|---|
| Detained | Statutory Release | Total | |||||||||
| Abor. | Non - Abor. | Total | % | Abor. | Non - Abor. | Total | % | Abor. | Non - Abor. | ||
| 2000-01 | 69 | 146 | 215 | 93.9 | 6 | 8 | 14 | 6.1 | 75 | 154 | 229 |
| 2001-02 | 75 | 182 | 257 | 94.5 | 2 | 13 | 15 | 5.5 | 77 | 195 | 272 |
| 2002-03 | 81 | 164 | 245 | 86.3 | 14 | 25 | 39 | 13.7 | 95 | 189 | 284 |
| 2003-04 | 72 | 207 | 279 | 92.1 | 8 | 16 | 24 | 7.9 | 80 | 223 | 303 |
| 2004-05 | 70 | 155 | 225 | 91.1 | 6 | 16 | 22 | 8.9 | 76 | 171 | 247 |
| 2005-06 | 75 | 158 | 233 | 89.3 | 11 | 17 | 28 | 10.7 | 86 | 175 | 261 |
| 2006-07 | 64 | 158 | 222 | 88.8 | 4 | 24 | 28 | 11.2 | 68 | 182 | 250 |
| 2007-08 | 87 | 160 | 247 | 93.2 | 7 | 11 | 18 | 6.8 | 94 | 171 | 265 |
| 2008-09 | 105 | 151 | 256 | 95.9 | 5 | 6 | 11 | 4.1 | 110 | 157 | 267 |
| 2009-10 | 97 | 164 | 261 | 93.9 | 2 | 15 | 17 | 6.1 | 99 | 179 | 278 |
| 2010-11 | 112 | 127 | 239 | 94.5 | 5 | 9 | 14 | 5.5 | 117 | 136 | 253 |
| 2011-12 | 88 | 119 | 207 | 96.7 | 3 | 4 | 7 | 3.3 | 91 | 123 | 214 |
| 2012-13 | 90 | 142 | 232 | 98.3 | 4 | 0 | 4 | 1.7 | 94 | 142 | 236 |
| 2013-14 | 85 | 115 | 200 | 96.2 | 4 | 4 | 8 | 3.8 | 89 | 119 | 208 |
| 2014-15 | 68 | 96 | 164 | 94.3 | 5 | 5 | 10 | 5.7 | 73 | 101 | 174 |
| Total | 1,238 | 2,244 | 3,482 | 93.1 | 83 | 173 | 259 | 6.9 | 1,324 | 2,417 | 3,741 |
Source: Parole Board of Canada.
Note:
According to the Corrections and Conditional Release Act, an offender entitled to statutory release after serving two-thirds of the sentence may be held in custody until warrant expiry if it is established that the offender is likely to commit, before the expiry of his/her sentence, an offence causing death or serious harm, a serious drug offence or a sex offence involving a child.
77% of judicial review hearings result in earlier parole eligibility
Figure E2
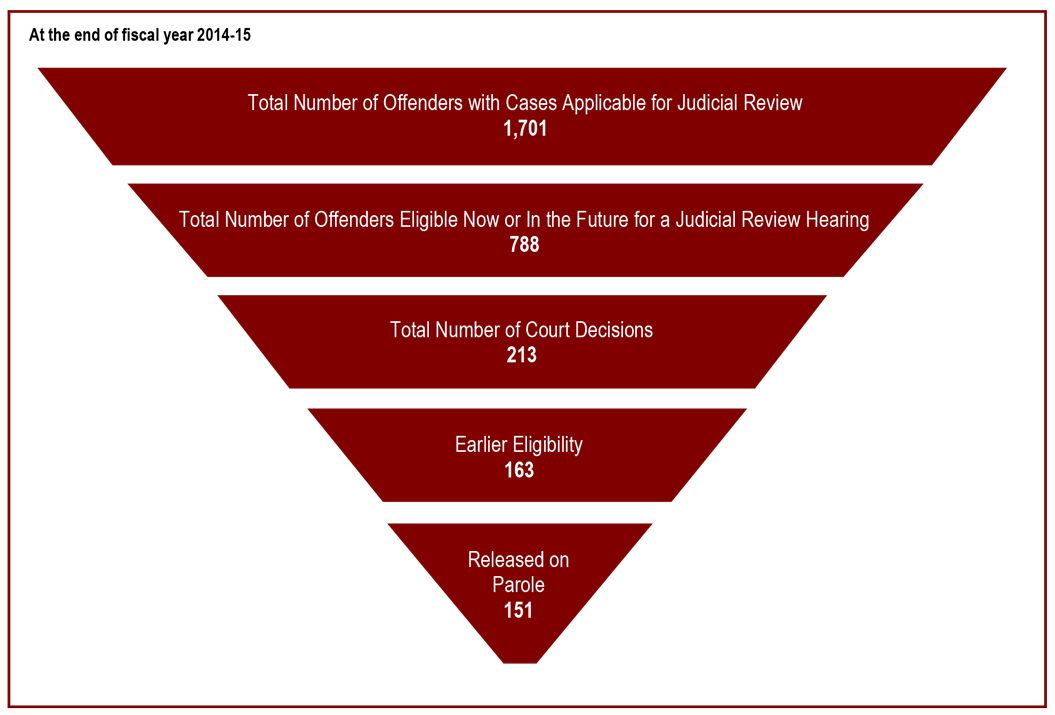
Source: Correctional Service Canada.
- Since the first judicial review hearing in 1987, there have been a total of 213 court decisions.
- Of these cases, 76.5% of the court decisions resulted in a reduction of the period that must be served before parole eligibility.
- Of the 788 offenders eligible to apply for a judicial review, 281 have already served 15 years of their sentence whereas 507 have not.
- Of the 163 offenders who have had their parole eligibility date moved closer, 160 have reached their revised Day Parole eligibility date. Of these offenders, 151 have been released on parole, and 102 were being actively supervised in the community*.
- A higher percentage of second degree (87.0%) than first degree (75.3%) murder cases have resulted in a reduction of the period required to be served before parole eligibility.
Note:
*Of the 49 offenders no longer under active supervision, 14 were in custody, 27 were deceased, six were deported, one was temporarily detained, and one was unlawfully at large.
Judicial review is an application to the court for a reduction in the time required to be served before being eligible for parole. Judicial review procedures apply to offenders who have been sentenced to imprisonment for life without eligibility for parole until more than fifteen years of their sentence has been served.
Offenders can apply when they have served at least 15 years of their sentence.
Judicial reviews are conducted in the province where the conviction took place.
| Province/Territory of Judicial Review | Parole Ineligibility Reduced by Court | Reduction Denied by Court | Total | |||
|---|---|---|---|---|---|---|
| 1st degree murder | 2nd degree murder | 1st degree murder | 2nd degree murder | 1st degree murder | 2nd degree murder | |
| Northwest Territories | 0 | 0 | 0 | 0 | 0 | 0 |
| Nunavut | 0 | 0 | 0 | 0 | 0 | 0 |
| Yukon | 0 | 0 | 0 | 0 | 0 | 0 |
| Newfoundland & Labrador | 0 | 0 | 0 | 0 | 0 | 0 |
| Prince Edward Island | 0 | 0 | 0 | 0 | 0 | 0 |
| Nova Scotia | 1 | 1 | 1 | 0 | 2 | 1 |
| New Brunswick | 1 | 0 | 0 | 0 | 1 | 0 |
| Quebec | 66 | 15 | 4 | 2 | 70 | 17 |
| Ontario | 22 | 0 | 25 | 1 | 47 | 1 |
| Manitoba | 8 | 3 | 1 | 0 | 9 | 3 |
| Saskatchewan | 6 | 0 | 3 | 0 | 9 | 0 |
| Alberta | 19 | 0 | 7 | 0 | 26 | 0 |
| British Columbia | 20 | 1 | 6 | 0 | 26 | 1 |
| Sub-total | 143 | 20 | 47 | 3 | 190 | 23 |
| Total | 163 | 50 | 213 | |||
Source: Correctional Service Canada.
Note:
These numbers represent total decisions as of end of fiscal year 2014-15.
Judicial reviews are conducted in the province where the conviction took place.
The number of dangerous offender designations
Figure E3
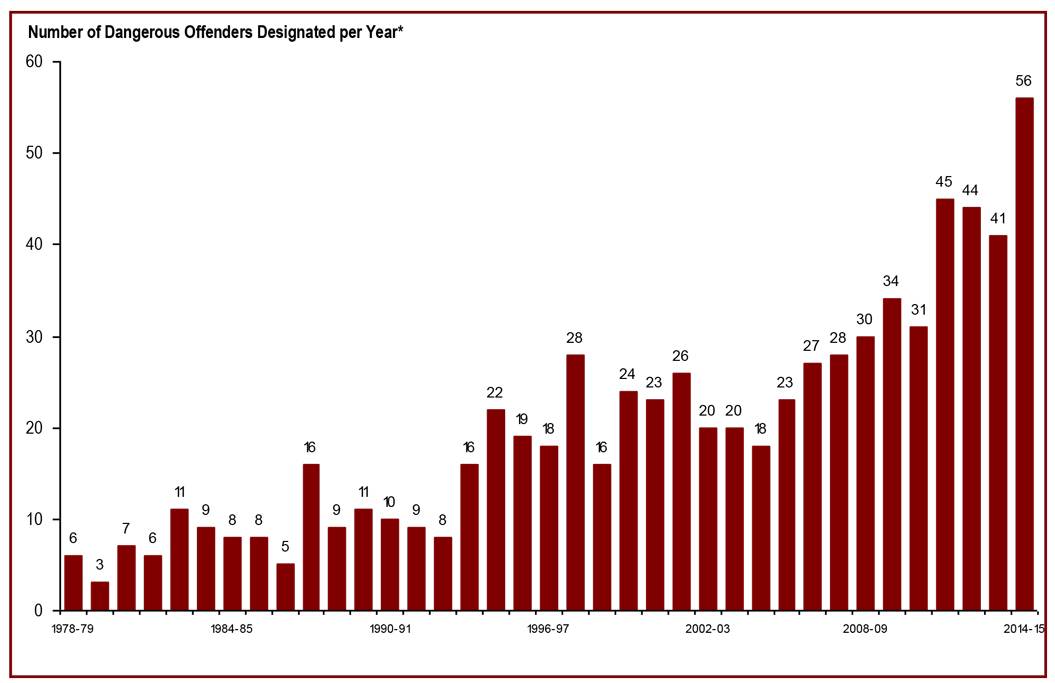
Source: Correctional Service Canada.
- At the end of fiscal year 2014-15, there have been 735 offenders designated as Dangerous Offenders (DOs) since 1978. 71.4% have at least one current conviction for a sexual offence.
- At the end of fiscal year 2014-15, there were 622 DOs under the responsibility of Correctional Service Canada, and of those 88.7% had indeterminate sentences.
- Of these 622 DOs, 586 were in custody (representing 3.9% of the In-Custody Population) and 36 were in the community under supervision.
- There were four women with a Dangerous Offender designation.
- Aboriginal offenders accounted for 31.5% of DOs and 21.9% of the Total Offender Population.
Note:
*The number of Dangerous Offenders designated per year does not include overturned decisions.
Offenders who have died since receiving designations are no longer classified as "active"; however, they are still represented in the above graph, which depicts the total number of offenders "designated".
Dangerous Offender legislation came into effect in Canada on October 15, 1977, replacing the Habitual Offender and Dangerous Sexual Offender provisions that were abolished. A Dangerous Offender (DO) is an individual given an indeterminate or determinate sentence on the basis of a particularly violent crime or pattern of serious violent offences where it is judged that the offender's behaviour is unlikely to be inhibited by normal standards of behavioural restraint (see section 753 of the Criminal Code of Canada). Determinate sentences for Dangerous Offenders must be a minimum punishment of imprisonment for a term of two years and have an order that the offender be subject to a long-term supervision period that does not exceed 10 years.
In addition to the DOs, there were 19 Dangerous Sexual Offenders and four Habitual Offenders.
| Province/Territory of Designation |
All Designations (# designated since 1978) | Active Dangerous Offenders | ||
|---|---|---|---|---|
| # of Indeterminate Offenders | # of Determinate Offenders | Total | ||
| Newfoundland & Labrador | 11 | 7 | 0 | 7 |
| Nova Scotia | 23 | 19 | 1 | 20 |
| Prince Edward Island | 0 | 0 | 0 | 0 |
| New Brunswick | 8 | 5 | 0 | 5 |
| Quebec | 90 | 71 | 11 | 82 |
| Ontario | 309 | 229 | 31 | 260 |
| Manitoba | 21 | 19 | 1 | 20 |
| Saskatchewan | 72 | 48 | 16 | 64 |
| Alberta | 58 | 48 | 2 | 50 |
| British Columbia | 129 | 95 | 5 | 100 |
| Yukon | 3 | 1 | 2 | 3 |
| Northwest Territories | 9 | 9 | 0 | 9 |
| Nunavut | 2 | 1 | 0 | 1 |
| Total | 735 | 552 | 70 | 622 |
Source: Correctional Service Canada.
Note:
Numbers presented are as of end of fiscal year 2014-15.
The number of Dangerous Offenders declared per year does not include overturned decisions.
Offenders who have died since receiving designations are no longer classified as "active"; however, they are still represented in the total number of offenders "designated".
Most long term supervision orders are for a 10-year period
Figure E4

Source: Correctional Service Canada.
- At the end of fiscal year 2014-15, the courts had imposed 980 long term supervision orders. Of these, 70.1% were for a period of 10 years.
- There were 781 offenders with long term supervision orders, and of these, 492 (63.0%) had at least one current conviction for a sexual offence.
- There were 14 women with long term supervision orders.
- There were 413 offenders being supervised in the community on their long term supervision order at the end of fiscal year 2014-15. Of these, 335 offenders were supervised in the community, 31 offenders were temporarily detained, 44 offenders were on remand, and three offenders were unlawfully at large for less than 90 days.
Note:
Long Term Supervision Order (LTSO) legislation, which came into effect in Canada on August 1, 1997, allows the court to impose a sentence of two years or more for the predicate offence and order that the offender be supervised in the community for a further period not exceeding 10 years.
Fifty-one offenders under these provisions have died and 113 offenders have completed their long term supervision period.
Remand is a temporary detention of a person while awaiting trial, sentencing, or the commencement of a custodial disposition.
| Province or Territory of Order | Length of Supervision Order (years) | Current Status | ||||||||||||||
|---|---|---|---|---|---|---|---|---|---|---|---|---|---|---|---|---|
| 1 | 2 | 3 | 4 | 5 | 6 | 7 | 8 | 9 | 10 | Total | Incarcerated | DP, FP or SR* | LTSO period | LTSO** interrupted | Total | |
| Newfoundland & Labrador | 0 | 0 | 0 | 0 | 0 | 0 | 0 | 0 | 0 | 7 | 7 | 0 | 1 | 3 | 1 | 6 |
| Nova Scotia | 0 | 0 | 0 | 0 | 5 | 0 | 0 | 1 | 0 | 13 | 19 | 4 | 0 | 8 | 2 | 14 |
| Prince Edward Island | 0 | 0 | 0 | 0 | 1 | 0 | 0 | 0 | 0 | 1 | 2 | 0 | 0 | 0 | 0 | 0 |
| New Brunswick | 0 | 0 | 1 | 0 | 1 | 0 | 0 | 1 | 0 | 7 | 10 | 1 | 2 | 2 | 2 | 7 |
| Quebec | 1 | 1 | 3 | 2 | 55 | 15 | 35 | 10 | 1 | 198 | 321 | 95 | 23 | 126 | 12 | 256 |
| Ontario | 0 | 0 | 0 | 5 | 14 | 8 | 18 | 18 | 0 | 208 | 271 | 65 | 14 | 129 | 9 | 217 |
| Manitoba | 0 | 0 | 0 | 0 | 1 | 1 | 2 | 1 | 0 | 30 | 35 | 10 | 1 | 15 | 1 | 27 |
| Saskatchewan | 0 | 1 | 1 | 1 | 12 | 8 | 10 | 11 | 1 | 48 | 93 | 42 | 9 | 28 | 1 | 80 |
| Alberta | 0 | 0 | 0 | 0 | 7 | 1 | 0 | 1 | 0 | 61 | 70 | 22 | 3 | 30 | 0 | 55 |
| British Columbia | 0 | 0 | 0 | 2 | 12 | 4 | 5 | 6 | 0 | 98 | 127 | 30 | 8 | 57 | 4 | 99 |
| Yukon | 0 | 0 | 0 | 0 | 1 | 0 | 3 | 0 | 0 | 11 | 15 | 4 | 0 | 9 | 0 | 13 |
| Northwest Territories | 0 | 0 | 0 | 0 | 1 | 0 | 0 | 0 | 0 | 2 | 3 | 0 | 0 | 2 | 0 | 2 |
| Nunavut | 0 | 0 | 0 | 0 | 2 | 1 | 0 | 1 | 0 | 3 | 7 | 1 | 0 | 4 | 0 | 5 |
| Total | 1 | 2 | 5 | 10 | 112 | 38 | 73 | 50 | 2 | 687 | 980 | 275 | 61 | 413 | 32 | 781 |
Source: Correctional Service Canada.
Note:
*This category includes offenders whose current status is either supervised on day parole (DP), full parole (FP) or statutory release (SR).
**This category includes offenders convicted of a new offence while on the supervision portion of an LTSO. When this occurs, the LTSO supervision period is interrupted until the offender has served the new sentence to its warrant expiry date. At that time, the LTSO supervision period resumes where it left off.
These numbers are as of end of fiscal year 2014-15.
Fifty-one offenders under these provisions have died and 113 offenders have completed their long term supervision period.
The number of record suspension applications received has decreased
Figure E5
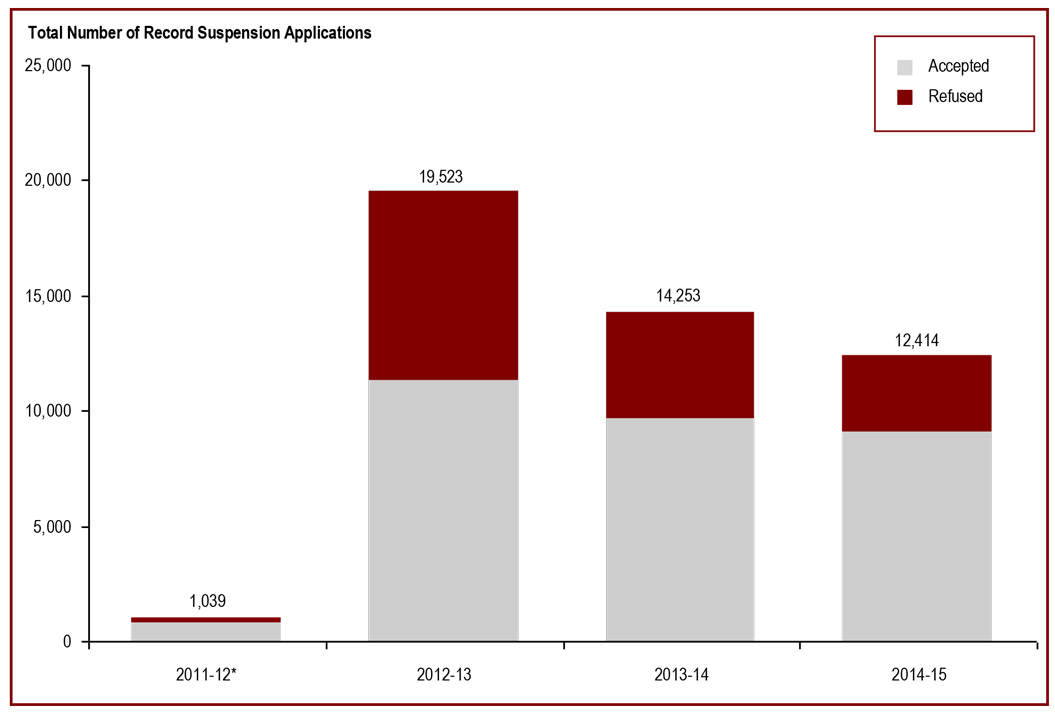
Source: Parole Board of Canada.
- The number of record suspension applications received decreased from 14,253 in 2013-14 to 12,414 in 2014-15. Of these 12,414 applications, 73.1% were accepted, an increase of 5.5% compared to 2013-14.
- Approximately 3.8 million Canadians have a criminal record**, but less than 11.0% of people convicted have received a pardon/record suspension. Since 1970, when the pardon process began, 494,103 pardons/record suspensions have been granted/issued or ordered.
Note:
*Refers to record suspension applications received between March 13 and March 31, 2012.
The number of record suspension applications received and accepted in 2012-13 should be considered with caution as the Record Suspension program, formerly the Pardon Program, underwent substantial changes between 2010-11 and 2012-13.
**Source: Royal Canadian Mounted Police Criminal Records Division, 2009.
On March 13, 2012, Bill C-10 amended the CRA by replacing the term "pardon" with the term "record suspension". The Record Suspension and Clemency program involves the review of record suspension applications, the ordering of record suspensions and the making of clemency recommendations. The amendments to the CRA increased the waiting periods for a record suspension to five years for all summary convictions and to ten years for all indictable offences. Individuals convicted of sexual offences against minors (with certain exceptions) and those who have been convicted of more than three indictable offences, each with a sentence of two or more years, became ineligible for a record suspension.
| Applications Processed | 2010-11 | 2011-12 | 2012-13 | 2013-14 | 2014-15 |
|---|---|---|---|---|---|
| Applications Received | 1,039* | 19,523 | 14,253 | 12,414 | |
| Applications Accepted | 793 | 11,291 | 9,632 | 9,074 | |
| Percentage Accepted | 76.3 | 57.8 | 67.6 | 73.1 | |
| Record Suspension | |||||
| Ordered | 6,030 | 8,515 | 8,438 | ||
| Refused | 208 | 777 | 731 | ||
| Total Record Suspension Applications Ordered/Refused | 6,238 | 9,292 | 9,169 | ||
| Percentage Ordered | 96.7 | 91.6 | 92.0 | ||
| Pardon | |||||
| Granted | 9,393 | 3,270 | 612 | 8,278 | 5,630 |
| Issued | 2,693 | – | – | – | – |
| Denied | 293 | 276 | 130 | 588 | 686 |
| Total Pardon Applications Granted/Issued/Denied | 12,379 | 3,546 | 742** | 8,866** | 6,316** |
| Percentage Granted/Issued | 97.6 | 92.2 | 82.5 | 93.4 | 89.1 |
| Pardon/Record Suspension Revocations/Cessations | |||||
| Revocations*** | 71 | 1,132 | 991 | 669 | 441 |
| Cessations | 1,055 | 907 | 706 | 588 | 580 |
| Total Revocations/Cessations | 1,126 | 2,039 | 1,697 | 1,257 | 1,021 |
| Cumulative Granted/Issued**** | 453,330 | 456,600 | 463,242 | 480,035 | 494,103 |
| Cumulative Revocations/Cessations**** | 17,339 | 19,378 | 21,075 | 22,332 | 23,353 |
Source: Parole Board of Canada.
Note:
*Refers to record suspension applications received between March 13 and March 31, 2012.
**Refers to pardon applications received on or before March 12, 2012.
The number of record suspension applications received and accepted in 2012-13 should be considered with caution as the Record Suspension program, formerly the Pardon Program, underwent substantial changes between 2010-11 and 2012-13. The grant/issued rate for pardon applications processed in 2012/13 should be considered with caution. The Record Suspension program, formerly the Pardon Program, underwent substantial changes between 2010/11 and 2012/13.
***Revocations fluctuate due to resource re-allocation to deal with backlogs.
****Cumulative data reflects activity since 1970, when the pardon process was established under the Criminal Records Act.
On June 29, 2010, Bill C-23A amended the CRA by extending the ineligibility periods for certain applications for pardon. Additionally, the bill resulted in significant changes to program operations. The process was modified to include additional inquiries and new, more exhaustive investigations by staff for some applications and required additional review time by Board members. New concepts of merit and disrepute to the administration of justice form part of the statute. As a result of these new changes, application processing time increased. On March 13, 2012, Bill C-10 amended the CRA by replacing the term "pardon" with the term "record suspension". The Record Suspension and Clemency program involves the review of record suspension applications, the ordering of record suspensions and the making of clemency recommendations. The amendments to the CRA increased the waiting periods for a record suspension to five years for all summary convictions and to ten years for all indictable offences. Individuals convicted of sexual offences against minors (with certain exceptions) and those who have been convicted of more than three indictable offences, each with a sentence of two or more years, became ineligible for a record suspension.
Section F: Victims of Crime
Victimization rates for theft of personal property have decreased
Figure F1
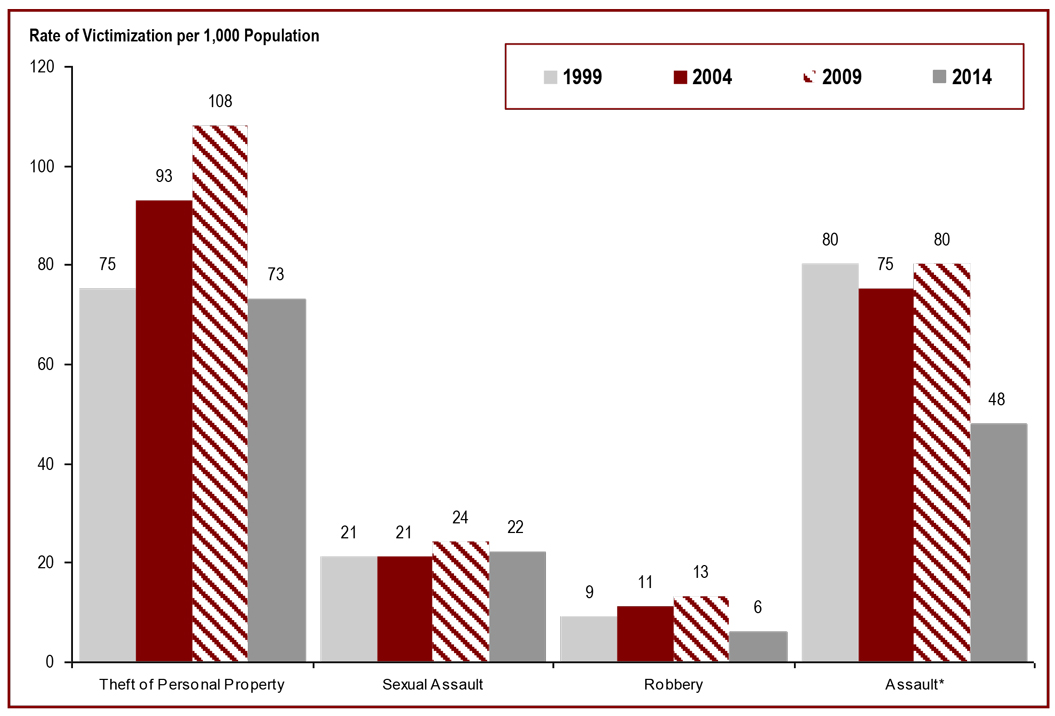
Source: General Social Survey, Statistics Canada, 1999, 2004, 2009 and 2014.
- Victimization rates for theft of personal property were lower in 2014 than in previous years.
- Victimization rates for assault were lower in 2014 than in previous years.
- Since 1999, the rates of victimization for sexual assault have remained stable.
Note:
*Assault data includes incidents of spousal violence. In previous editions of this document, the victimization data excluded incidents of spousal violence.
Rates are based on 1,000 population, 15 years of age and older, across the 10 provinces.
| Type of Incident | Year | |||
|---|---|---|---|---|
| 1999 | 2004 | 2009 | 2014 | |
| Theft of Personal Property | 75 | 93 | 108 | 73 |
| Sexual Assault | 21 | 21 | 24 | 22 |
| Robbery | 9 | 11 | 13 | 6 |
| Assault* | 80 | 75 | 80 | 48 |
Source: General Social Survey, Statistics Canada, 1999, 2004, 2009 and 2014.
Note:
*Assault data includes incidents of spousal violence. In previous editions of this document, the victimization data excluded incidents of spousal violence.
Rates are based on 1,000 population, 15 years of age and older, across the 10 provinces.
The majority of victims of violent crime are under 30
Figure F2
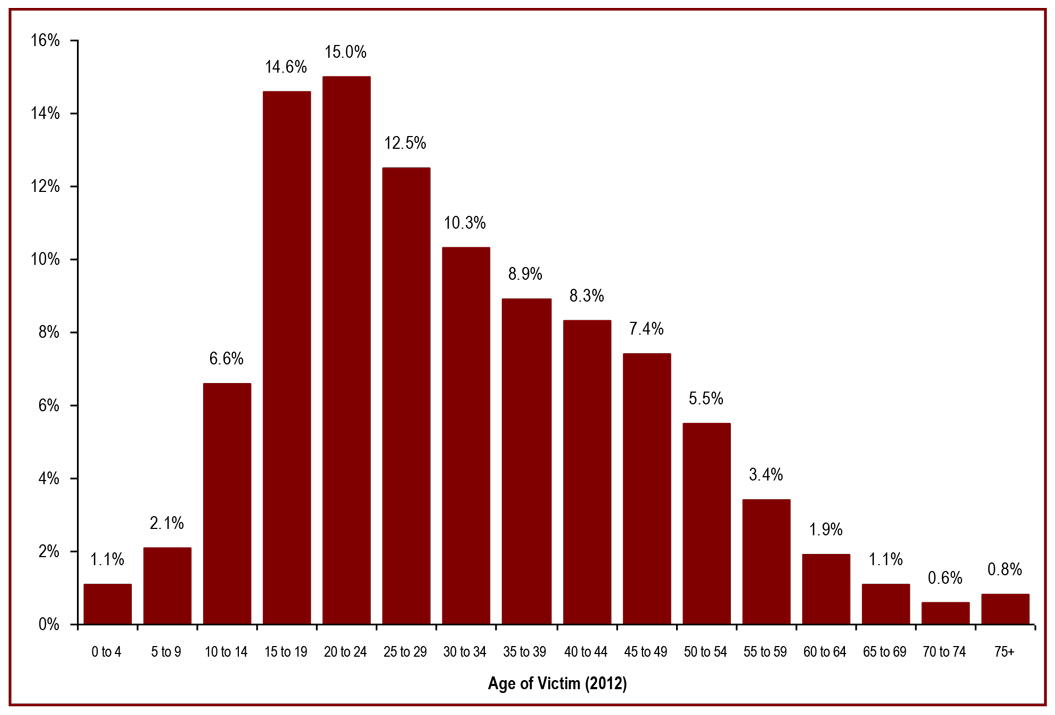
Source: Incident-based Uniform Crime Reporting Survey, Canadian Centre for Justice Statistics, Statistics Canada.
- More than half (51.9%) of all victims of violent crime reported in 2012 were under the age of 30, whereas 36.9% of the Canadian population is under the age of 30*.
- Women aged 15 to 39 years were more likely than men of that age to be victims of crime.
- Canadians aged 65 and older, who account for 14.1% of the general population*, represent 2.4% of victims of crime.
Note:
*Population estimates are as of July 1, 2010.
The data excludes traffic violations, victims whose age is above 89, victims whose age is unknown and victims whose gender is unknown.
Due to rounding, totals may not add to 100 percent.
| Age of Victim | Men | Women | Total | |||
|---|---|---|---|---|---|---|
| # | % | # | % | # | % | |
| 0 to 4 years | 1,761 | 1.0 | 2,053 | 1.1 | 3,814 | 1.1 |
| 5 to 9 years | 3,803 | 2.2 | 3,724 | 2.0 | 7,527 | 2.1 |
| 10 to 14 years | 11,716 | 6.7 | 12,109 | 6.5 | 23,825 | 6.6 |
| 15 to 19 years | 25,294 | 14.4 | 27,674 | 14.9 | 52,968 | 14.6 |
| 20 to 24 years | 24,712 | 14.1 | 29,380 | 15.8 | 54,092 | 15.0 |
| 25 to 29 years | 21,477 | 12.2 | 23,897 | 12.9 | 45,374 | 12.5 |
| 30 to 34 years | 17,282 | 9.8 | 20,001 | 10.8 | 37,283 | 10.3 |
| 35 to 39 years | 14,829 | 8.4 | 17,403 | 9.4 | 32,232 | 8.9 |
| 40 to 44 years | 14,607 | 8.3 | 15,456 | 8.3 | 30,063 | 8.3 |
| 45 to 49 years | 13,568 | 7.7 | 13,038 | 7.0 | 26,606 | 7.4 |
| 50 to 54 years | 10,965 | 6.2 | 9,051 | 4.9 | 20,016 | 5.5 |
| 55 to 59 years | 6,983 | 4.0 | 5,149 | 2.8 | 12,132 | 3.4 |
| 60 to 64 years | 4,081 | 2.3 | 2,792 | 1.5 | 6,873 | 1.9 |
| 65 to 69 years | 2,321 | 1.3 | 1,605 | 0.9 | 3,926 | 1.1 |
| 70 to 74 years | 1,128 | 0.6 | 977 | 0.5 | 2,105 | 0.6 |
| 75 and over | 1,228 | 0.7 | 1,507 | 0.8 | 2,735 | 0.8 |
| Total | 175,755 | 100.0 | 185,816 | 100.0 | 361,571 | 100.0 |
Source: Incident-based Uniform Crime Reporting Survey, Canadian Centre for Justice Statistics, Statistics Canada.
Note:
The data excludes traffic violations, victims whose age is above 89, victims whose age is unknown and victims whose gender is unknown.
Due to rounding, totals may not add to 100 percent.
The majority of victims receiving services are victims of violent crime
Figure F3
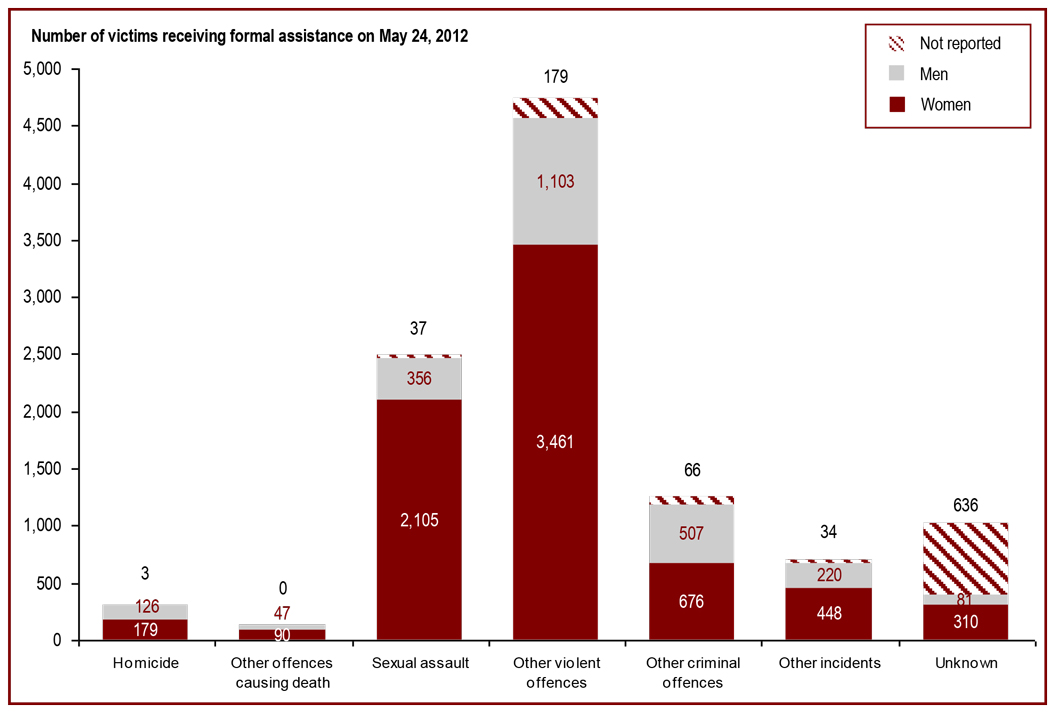
Source: Victim Services in Canada, 2011/2012; Canadian Centre for Justice Statistics, Statistics Canada.
- On May 24, 2012, the Victim Services Survey snapshot day, 10,664 victims received formal assistance from a victim service office. This represents an increase of 12.7% from 9,462 on May 27, 2010. Of the 9,637 where the crime was known, the majority, 79.8% were victims of a violent crime.
- Of the 9,709 cases in which gender of the victim was noted, women accounted for 74.9% of the victims who received formal assistance from a victim service office, and men represented 25.1%.
- Of the 6,959 women who received formal assistance where the type of crime was known, 83.8% were victims of violent crime. A total of 2,105 women (30.2%) were victims of sexual assault.
- Of the 2,359 men who received formal assistance where the type of crime was known, 69.2% were victims of violent crime. A total of 356 men (15.1%) were victims of sexual assault.
Note:
Victim services are defined as agencies that provide direct services to primary or secondary victims of crime, and that are funded in whole or in part by a ministry responsible for justice matters. Survey respondents included 684 victim service providers.
| Type of Crime | Gender of Victim | |||||||
|---|---|---|---|---|---|---|---|---|
| Women | Men | Not Reported | Total | |||||
| Snapshot on May 27, 2010 | # | % | # | % | # | % | # | % |
| Homicide | 154 | 2.4 | 70 | 3.3 | 3 | 0.5 | 227 | 2.5 |
| Other offences causing death | 95 | 1.5 | 77 | 32.7 | 8 | 1.4 | 180 | 2.0 |
| Sexual assault | 1,922 | 30.0 | 379 | 18.1 | 160 | 28.3 | 2,461 | 27.1 |
| Other violent offences | 3,323 | 51.8 | 917 | 43.8 | 262 | 46.4 | 4,502 | 49.6 |
| Other criminal offences* | 496 | 7.7 | 357 | 17.0 | 73 | 12.9 | 926 | 10.2 |
| Other Incidents** | 421 | 6.6 | 295 | 14.1 | 59 | 10.4 | 775 | 8.5 |
| Total without unknown | 6,411 | 100.0 | 2,095 | 100.0 | 565 | 100.0 | 9,071 | 100.0 |
| Unknown type of crime | 197 | — | 81 | — | 113 | — | 391 | — |
| Total | 6,608 | 2,176 | 678 | 9,462 | ||||
| Snapshot on May 24, 2012 | ||||||||
| Homicide | 179 | 2.6 | 126 | 5.3 | 3 | 0.9 | 308 | 3.2 |
| Other offences causing death | 90 | 1.3 | 47 | 2.0 | 0 | 0.0 | 137 | 1.4 |
| Sexual assault | 2,105 | 30.2 | 356 | 15.1 | 37 | 11.6 | 2,498 | 25.9 |
| Other violent offences | 3,461 | 49.7 | 1,103 | 46.8 | 179 | 56.1 | 4,743 | 49.2 |
| Other criminal offences* | 676 | 9.7 | 507 | 21.5 | 66 | 20.7 | 1,249 | 13.0 |
| Other Incidents** | 448 | 6.4 | 220 | 9.3 | 34 | 10.7 | 702 | 7.3 |
| Total without unknown | 6,959 | 100.0 | 2,359 | 100.0 | 319 | 100.0 | 9,637 | 100.0 |
| Unknown type of crime | 310 | — | 81 | — | 636 | — | 1,027 | — |
| Total | 7,269 | 2,440 | 955 | 10,664 | ||||
Source: Victim Services in Canada, 2009/2010; Victim Services in Canada 2011/2012; Canadian Centre for Justice Statistics, Statistics Canada.
Note:
*Other criminal offences include arson, property crimes, traffic offences, and other Criminal Code offences.
**Other incidents include those of a non-criminal nature as well as those that are still under investigation to determine if they are criminal offences.
Victim services are defined as agencies that provide direct services to primary or secondary victims of crime, and that are funded in whole or in part by a ministry responsible for justice matters. Survey respondents included 684 victim service providers.
The number of victims registered with the federal correctional system has increased
Figure F4
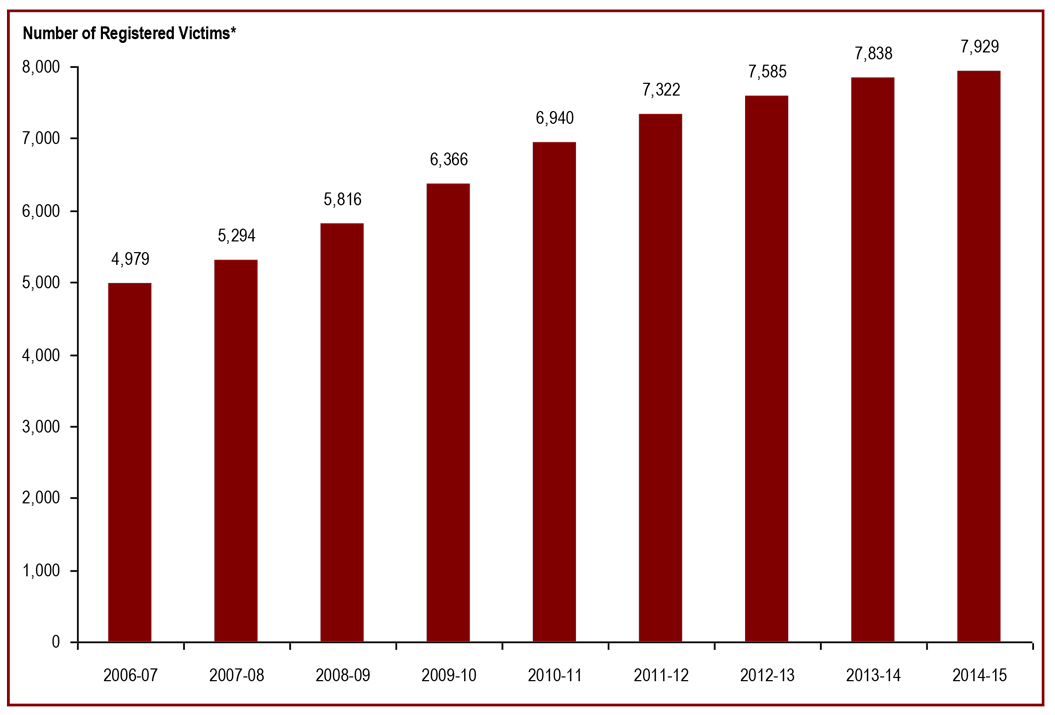
Source: Correctional Service Canada.
- Since 2006-07, there has been a 59.2% increase in the number of victims registered with the Correctional Service of Canada and the Parole Board of Canada combined, from 4,979 to 7,929.
- Of the 22,935 offenders under the responsibility of the Correctional Service Canada in 2014-15, 17.7% (4,053) have registered victims.
- In 2014-15, the Correctional Service of Canada provided 54,683 notifications** to registered victims.
Note:
*In order to register to receive information under sections 26 and 142 of the Corrections and Conditional Release Act, a person must meet the definition of a victim that appears in section 2, or subsections 26(3) or 142(3) of the Act. Victims can register with the Correctional Service of Canada or the Parole Board of Canada by completing a Victims Request for Information form, though a signed letter of request can be considered as meeting this requirement.
**A notification is a contact with a registered victim, by phone or mail, to provide information to which sections 26 and 142 of the Corrections and Conditional Release Act entitles them.
Data is reported by CSC's data warehouse using a snapshot of data as of April of each year.
| Year | Number of Offenders with Registered Victims | Number of Registered Victims* | Number of Notifications** to Registered Victims |
|---|---|---|---|
| 2006-07 | 3,147 | 4,979 | 13,829 |
| 2007-08 | 3,295 | 5,294 | 16,281 |
| 2008-09 | 3,412 | 5,816 | 28,069 |
| 2009-10 | 3,509 | 6,366 | 37,471 |
| 2010-11 | 3,726 | 6,940 | 41,986 |
| 2011-12 | 3,824 | 7,322 | 46,689 |
| 2012-13 | 3,935 | 7,585 | 51,379 |
| 2013-14 | 4,017 | 7,838 | 51,723 |
| 2014-15 | 4,053 | 7,929 | 54,683 |
Source: Correctional Service Canada.
Note:
*In order to register to receive information under sections 26 and 142 of the Corrections and Conditional Release Act, a person must meet the definition of a victim that appears in section 2, or subsections 26(3) or 142(3) of the Act. Victims can register with the Correctional Service of Canada or the Parole Board of Canada by completing a Victims Request for Information form, though a signed letter of request can be considered as meeting this requirement.
**A notification is a contact with a registered victim, by phone or mail, to provide information to which sections 26 and 142 of the Corrections and Conditional Release Act entitles them.
Data is reported by CSC's data warehouse using a snapshot of data as of April of each year.
Offences causing death are the most common type of offence** that harmed the victims registered* with Correctional Service Canada
Figure F5
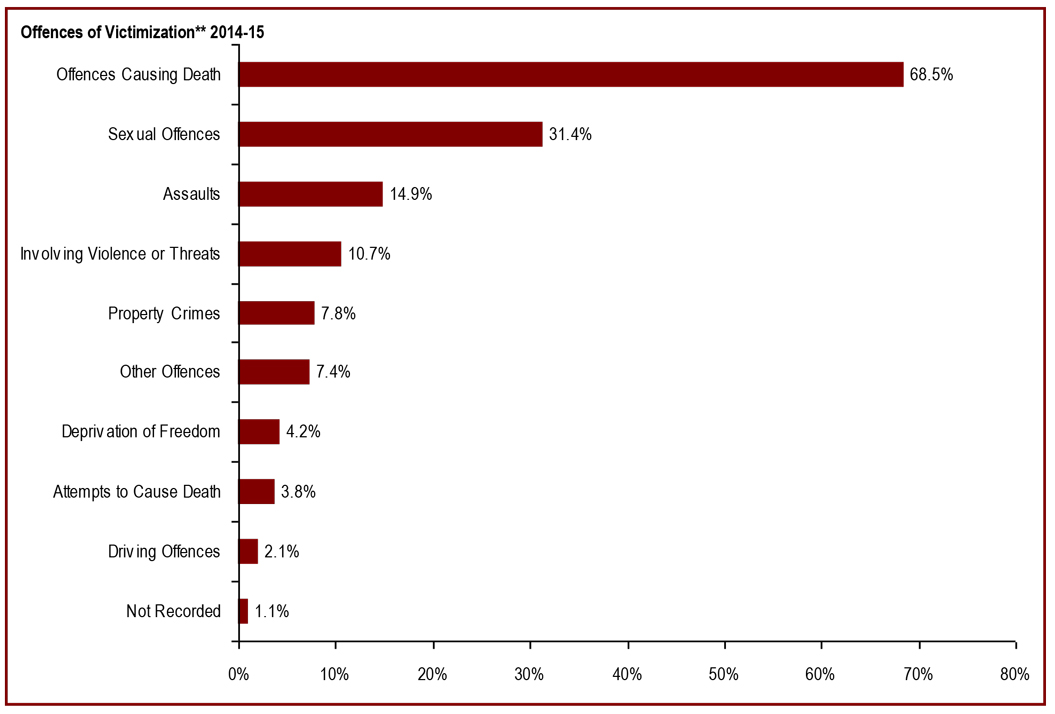
Source: Correctional Service Canada.
- Of the 7,929 registered victims, 68.5% (5,432) were victims of an offence that caused death.
- Victims of sexual offences (2,493) accounted for 31.4% of the registered victims.
- Victims of assault (1,178) and victims of offences involving violence or threats (849) accounted for 14.9% and 10.7% of the registered victims.
Note:
*In order to register to receive information under sections 26 and 142 of the Corrections and Conditional Release Act, a person must meet the definition of a victim that appears in section 2, or subsections 26(3) or 142(3) of the Act. Victims can register with the Correctional Service of Canada or the Parole Board of Canada by completing a Victims Request for Information form, though a signed letter of request can be considered as meeting this requirement.
**Some victims were harmed by more than one offence; therefore the number of Offences of Victimization are higher than the actual number of Registered Victims. The percentages represent the number of registered victims who were harmed by that offence.
| Type of Offence** That Harmed Victim* | 2010-11 | 2011-12 | 2012-13 | 2013-14 | 2014-15 | |||||
|---|---|---|---|---|---|---|---|---|---|---|
| # | % | # | % | # | % | # | % | # | % | |
| Offences Causing Death | 3,804 | 54.8 | 4,056 | 55.4 | 4,292 | 56.6 | 4,533 | 57.8 | 5,432 | 68.5 |
| Sexual Offences | 2,098 | 30.2 | 2,114 | 28.9 | 2,169 | 28.6 | 2,237 | 28.5 | 2,493 | 31.4 |
| Assaults | 998 | 14.4 | 998 | 13.6 | 965 | 12.7 | 941 | 12.0 | 1,178 | 14.9 |
| Involving Violence or Threats | 680 | 9.8 | 707 | 9.7 | 710 | 9.4 | 720 | 9.2 | 849 | 10.7 |
| Property Crimes | 509 | 7.3 | 534 | 7.3 | 551 | 7.3 | 541 | 6.9 | 617 | 7.8 |
| Other Offences | 396 | 5.7 | 452 | 6.2 | 441 | 5.8 | 475 | 6.1 | 583 | 7.4 |
| Attempts to Cause Death | 251 | 2.6 | 272 | 3.7 | 281 | 3.7 | 249 | 3.2 | 330 | 4.2 |
| Deprivation of Freedom | 233 | 3.4 | 241 | 3.3 | 246 | 3.2 | 283 | 3.6 | 299 | 3.8 |
| Driving Offences | 123 | 1.8 | 125 | 1.7 | 152 | 2.0 | 153 | 2.0 | 163 | 2.1 |
| Offence Not Recorded | 55 | 0.8 | 6 | 0.1 | 4 | 0.1 | 9 | 0.1 | 85 | 1.1 |
| Total Number of Victims** | 6,940 | 7,322 | 7,585 | 7,838 | 7,929 | |||||
Source: Correctional Service Canada.
Note:
*In order to register to receive information under sections 26 and 142 of the Corrections and Conditional Release Act, a person must meet the definition of a victim that appears in section 2, or subsections 26(3) or 142(3) of the Act. Victims can register with the Correctional Service of Canada or the Parole Board of Canada by completing a Victims Request for Information form, though a signed letter of request can be considered as meeting this requirement.
**Some victims were harmed by more than one offence, therefore the number of Offences of Victimization are higher than the number of Registered Victims.
The percentages in the table represent the number of registered victims who were harmed by that offence and do not add up to 100%.
Temporary Absence information is the most common type of information provided during a notification to registered victims* with Correcional Service Canada
Figure F6
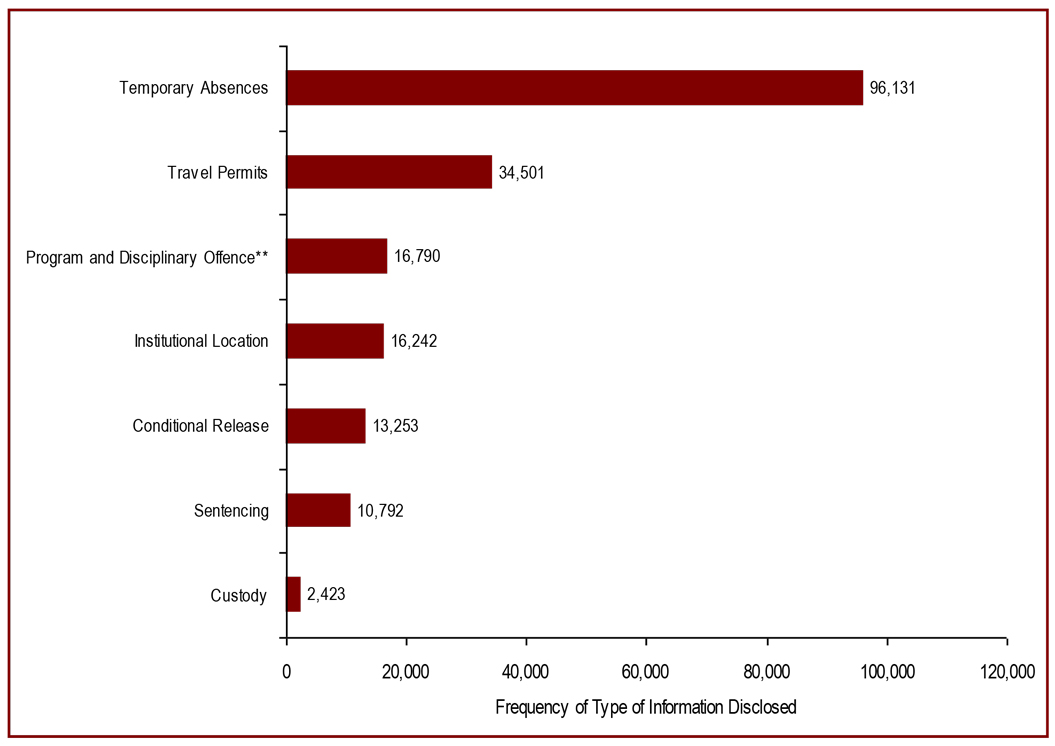
Source: Correctional Service Canada.
- In 2014-15, information on Temporary Absences (50.6%) and Travel Permits (18.1%) were the most frequent pieces of information about offenders that were provided during a notification to registered victims*.
- There has been a 79.1% increase in the number of pieces of information provided to registered victims* during notifications from 106,146 in 2010-11 to 190,132 in 2014-15.
Note:
Temporary Absence information includes information on unescorted and escorted temporary absences and work release. Conditional Release information includes information regarding day and full parole, statutory release, suspensions, detention, and long-term supervision orders. Sentencing information includes information on the offender's sentence, offender information, warrant expiry date, judicial review, and public domain.
Disclosure means a type of information identified in section 26 of the CCRA that has been disclosed to a registered victim during a notification.
As of December 2, 2011 as per Bill S6, Correctional Services Canada now provides information to some victims who are not registered which requires providing information to family members of murdered victims where the offender is still eligible to apply for Judicial Review including when the offender does not apply for a Judicial Review within the allotted time period, as well as the next date the offender can apply. Notification to unregistered victims are excluded for the data.
*In order to register to receive information under section 26 and 142 of the Corrections and Conditional Release Act, a person must meet the definition of a victim that appears in section 2 or subsection 26(3) or 142(3) of the Act. Victims can register with the Correctional Service of Canada or the Parole Board of Canada by completing a Victims Request for Information form, though a signed letter of request can be considered as meeting this requirement.
**In 2012, Bill C10 expanded the types of information that could be disclosed to victims. These types now include information on reintegration programs taken by offenders and disciplinary offences committed by offenders.
| Information | 2010-11 | 2011-12 | 2012-13 | 2013-14 | 2014-15 |
|---|---|---|---|---|---|
| Temporary Absences | 62,702 | 75,848 | 93,609 | 100,934 | 96,131 |
| Travel Permits | 10,136 | 10,877 | 28,763 | 34,294 | 34,501 |
| Institutional Location | 6,993 | 6,859 | 14,434 | 17,495 | 16,242 |
| Program & Disciplinary Offence Information** | 11,208 | 14,826 | 16,790 | ||
| Conditional Release | 10,353 | 10,870 | 11,803 | 12,318 | 13,253 |
| Sentencing Information | 13,770 | 16,268 | 12,813 | 10,333 | 10,792 |
| Custody | 2,192 | 2,414 | 2,569 | 2,476 | 2,423 |
| Total | 106,146 | 123,136 | 175,199 | 192,676 | 190,132 |
Source: Correctional Service Canada.
Note:
Temporary Absence information includes information on unescorted and escorted temporary absences and work release. Conditional Release information includes information regarding day and full parole, statutory release, suspensions, detention, and long-term supervision orders. Sentencing information includes information on the offender's sentence, offender information, warrant expiry date, judicial review, and public domain.
Disclosure means a type of information identified in section 26 of the CCRA that has been disclosed to a registered victim during a notification.
As of December 2, 2011 as per Bill S6, Correctional Services Canada now provides information to some victims who are not registered which requires providing information to family members of murdered victims where the offender is still eligible to apply for Judicial Review including when the offender does not apply for a Judicial Review within the allotted time period, as well as the next date the offender can apply. Notification to unregistered victims are excluded for the data.
*In order to register to receive information under section 26 and 142 of the Corrections and Conditional Release Act, a person must meet the definition of a victim that appears in section 2 or subsection 26(3) or 142(3) of the Act. Victims can register with the Correctional Service of Canada or the Parole Board of Canada by completing a Victims Request for Information form, though a signed letter of request can be considered as meeting this requirement.
**In 2012, Bill C10 expanded the types of information that could be disclosed to victims. These types now include information on reintegration programs taken by offenders and disciplinary offences committed by offenders.
Parole Board of Canada contacts with victims have increased
Figure F7
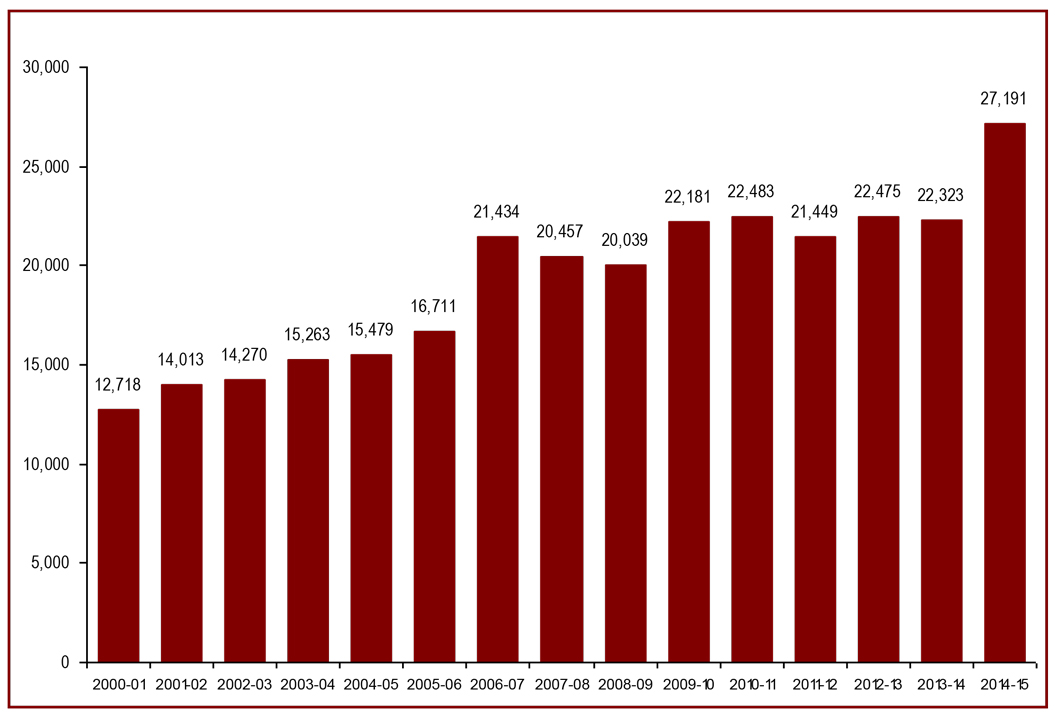
Source: Parole Board of Canada.
- In 2014-15, the Parole Board of Canada (PBC) had 27,191 contacts* with victims**, an increase of 21.8% (4,868 more contacts) compared to 2013-14. Since 2000-01, there has been a 113.8% increase in the number of contacts with victims by the PBC.
- In 2014-15, victims made 231 presentations at 128 hearings, 33 fewer presentations than the previous year.
- Most of the victims who made presentations at PBC hearings were the family members of murdered victims and victims of sexual offences.
Note:
*A victim contact refers to each time the Parole Board of Canada has contact with a victim by mail, fax, or by telephone.
**Bill C-10 (Safe Streets and Communities Act) , which came into force on June 13, 2012, resulted in changes to the categories of victims defined in section 2 of the CCRA. An actual victim is a person who survived a crime 2(1). If the person is dead, ill or otherwise incapacitated, a) a spouse/common law 2(1)(a), b) a relative/dependant 2(1)(b), c) anyone who is responsible for the care of the person 2(1)(c), d) anyone who is responsible for the care of a dependant of the person 2(1)(d) are considered as victims. If physical or emotional harm was done to a person as a result of the offender’s act, whether or not the offender is prosecuted or convicted of the act, and if the person made a complaint to the police or the Crown attorney, the person is recognized as a victim per CCRA 26 (3) and 142(3).
| Year | Total Number of Contacts* |
|---|---|
| 2000-01 | 12,718 |
| 2001-12 | 14,013 |
| 2002-03 | 14,270 |
| 2003-04 | 15,263 |
| 2004-05 | 15,479 |
| 2005-06 | 16,711 |
| 2006-07 | 21,434 |
| 2007-08 | 20,457 |
| 2008-09 | 20,039 |
| 2009-10 | 22,181 |
| 2010-11 | 22,483 |
| 2011-12 | 21,449 |
| 2012-13 | 22,475 |
| 2013-14 | 22,323 |
| 2014-15 | 27,191 |
Source: Parole Board of Canada.
Note:
*A victim contact refers to each time the Parole Board of Canada has contact with a victim by mail, fax, or by telephone.
Bill C-10 (Safe Streets and Communities Act), which came into force on June 13, 2012, resulted in changes to the categories of victims defined in section 2 of the CCRA. An actual victim is a person who survived a crime 2(1). If the person is dead, ill or otherwise incapacitated, a) a spouse/common law 2(1)(a), b) a relative/dependant 2(1)(b), c) anyone who is responsible for the care of the person 2(1)(c), d) anyone who is responsible for the care of a dependant of the person 2(1)(d) are considered as victims. If physical or emotional harm was done to a person as a result of the offender’s act, whether or not the offender is prosecuted or convicted of the act, and if the person made a complaint to the police or the Crown attorney, the person is recognized as a victim per CCRA 26(3) and 142(3).
- Date modified: