2009 Corrections and Conditional Release Statistical Overview

Table of contents
Section A: Context - Crime and the Criminal Justice System
- Police-reported crime rate has been decreasing since 1991
- Crime rates are higher in the west and highest in the north
- Canada's incarceration rate is high relative to most Western European countries
- The rate of adults charged has declined since 1982
- Administration of justice charges account for 24% of charges in adult courts
- Victimization rates for theft of personal property have increased
- The majority of victims of violent crime are under 30
- Most adult custodial sentences ordered by the court are short
- Relatively few crimes result in sentences to federal penitentiaries
- The rate of youth charged peaked in 1991 and has declined steadily since
- The most common youth court case is theft
- Fewer youth are receiving custodial sentences under YCJA
Section B: Corrections Administration
- Federal expenditures on corrections increased in 2007-08
- CSC employees are concentrated in custody centres
- The cost of keeping an inmate incarcerated has increased
- The number of National Parole Board employees
- The number of employees in the Office of the Correctional Investigator
- Health care is the most common area of offender complaint received by the Office of the. Correctional Investigator
Section C: Offender Population
- Federal offenders under the jurisdiction of the Correctional Service of Canada
- The number of incarcerated federal offenders decreased in 2008-09
- The number of admissions to federal jurisdiction has decreased
- The number of women admitted from the courts to federal jurisdiction has increased over the past decade
- Offender age at admission to federal jurisdiction is increasing
- The average age at admission is lower for Aboriginal offenders than for non-Aboriginal offenders
- 18% of the federal incarcerated offender population is age 50 or over
- 67% of federal offenders are Caucasian
- The religious identification of the offender population is diverse
- 11% of federal offenders have a mental health diagnosis at admission
- The proportion of Aboriginal offenders incarcerated is higher than for non-Aboriginal offenders
- The majority of incarcerated federal offenders are classified as medium security risk
- Admissions with a life or indeterminate sentence decreased in 2008-09
- Offenders with life or indeterminate sentences represent 22% of the total offender population
- 69% of federal offenders are serving a sentence for a violent offence
- The number of Aboriginal offenders under federal jurisdiction is increasing
- The number of offender deaths while in custody has fluctuated
- The number of escapes has decreased
- The supervised federal offender population in the community has increased since 2004-05
- In the past five years, the provincial/territorial community corrections population has decreased
- The number of offenders on provincial parole has decreased over the past decade
Section D: Conditional Release
- The federal full parole grant rate has stabilized
- The federal parole grant rate for Aboriginal offenders decreased in 2008-09
- Federal parole hearings involving an Aboriginal Cultural advisor decreased for the third year
- Offenders granted full parole serve about 40 % of their sentence prior to starting full parole
- Aboriginal offenders serve a higher proportion of their sentences before being released on parole
- Women serve a lower proportion of their sentences than men before being released on parole
- A large majority of federal day paroles are successfully completed
- The majority of federal full paroles are successfully completed
- The majority of statutory releases are successfully completed
- Over the past decade, the rate of violent conviction for offenders while under supervision has declined
- Over 25% of offenders serving determinate sentences were not reviewed for parole
- The number of offenders granted temporary absences has decreased since 1999-00
Section E: Statistics on Special Applications of Criminal Justice
- The number of detention reviews has fluctuated over the past five years
- 83% of judicial review hearings result in earlier parole eligibility
- The number of dangerous offender designations has stabilized over the past four years
- Most long term supervision orders are for a 10-year period
- The number of pardon applications processed has increased
Section A: Context - Crime and the Criminal Justice System
Police-reported crime rate has been decreasing since 1991

Source: Uniform Crime Reporting Survey, Canadian Centre for Justice Statistics, Statistics Canada.
- The crime rate, since peaking in 1991, continues to decline. In 2008, the crime rate was the lowest recorded in the last 25 years.
- The property crime rate has declined by 50% since 1991, and in 2008, was also at its lowest in the last 25 years.
- Violent crime peaked in 1992, and has decreased by 14% to a rate of 932 per 100,000 in 2008. The 2008 violent crime rate was the lowest recorded since 1989.
Note:
Violent crimes include homicide, attempted murder, assault, sexual offences, abduction and robbery.
Property crimes include break and enter, motor vehicle thefts, other thefts, possession of stolen goods and fraud.
These crime statistics are based on crimes that are reported to the police. Since not all crimes are reported to the police, these figures underestimate actual crime. See Figure A6 for rates based on victimization surveys (drawn from the General Social Survey), an alternative method of measuring crime.
Data presented in this figure do not reflect the changes in the classification of violation groups as published in the Juristat article - "Police-reported crime statistics in Canada, 2008."
Year |
Type of Offence |
|||
|---|---|---|---|---|
Property |
Violent |
Other CCC |
Total |
|
1984 |
5,501 |
701 |
2,185 |
8,387 |
1985 |
5,451 |
735 |
2,227 |
8,413 |
1986 |
5,550 |
785 |
2,392 |
8,727 |
1987 |
5,553 |
829 |
2,575 |
8,957 |
1988 |
5,439 |
868 |
2,613 |
8,919 |
1989 |
5,289 |
911 |
2,692 |
8,892 |
1990 |
5,612 |
973 |
2,900 |
9,485 |
1991 |
6,160 |
1,059 |
3,122 |
10,342 |
1992 |
5,904 |
1,084 |
3,052 |
10,040 |
1993 |
5,575 |
1,082 |
2,881 |
9,538 |
1994 |
5,257 |
1,047 |
2,821 |
9,125 |
1995 |
5,292 |
1,009 |
2,707 |
9,008 |
1996 |
5,274 |
1,002 |
2,656 |
8,932 |
1997 |
4,880 |
993 |
2,603 |
8,475 |
1998 |
4,569 |
995 |
2,529 |
8,093 |
1999 |
4,276 |
971 |
2,449 |
7,695 |
2000 |
4,081 |
996 |
2,534 |
7,610 |
2001 |
4,004 |
995 |
2,593 |
7,592 |
2002 |
3,976 |
980 |
2,560 |
7,516 |
2003 |
4,125 |
978 |
2,670 |
7,773 |
2004 |
3,976 |
957 |
2,668 |
7,601 |
2005 |
3,744 |
962 |
2,620 |
7,326 |
2006 |
3,604 |
968 |
2,673 |
7,245 |
2007 |
3,331 |
951 |
2,618 |
6,900 |
2008 |
3,079 |
932 |
2,578 |
6,589 |
Source: Uniform Crime Reporting Survey, Canadian Centre for Justice Statistics, Statistics Canada.
Note:
Rates are based on incidents reported per 100,000 population.
Due to rounding, rates may not add to Totals.
Data presented in this table do not reflect the changes in the classification of violation groups as published in the Juristat article - "Police-reported crime statistics in Canada, 2008."
Crime Rates are Higher in the West and Highest in the North

Source: Uniform Crime Reporting Survey, Canadian Centre for Justice Statistics, Statistics Canada.
- Crime rates are higher in the west and highest in the Territories. This general pattern has been stable over time.
- The Canadian crime rate dropped from 6,900 in 2007 to 6,589 in 2008.
Note:
The crime rate represents all Criminal Code incidents excluding traffic violations and other federal statutes, such as drug offences.
Data presented in this figure do not reflect the changes in the classification of violation groups as published in the Juristat article - "Police-reported crime statistics in Canada, 2008."
Province/Territory |
Crime Rate |
||||
|---|---|---|---|---|---|
2004 |
2005 |
2006 |
2007 |
2008 |
|
Newfoundland & Labrador |
6,359 |
6,166 |
6,145 |
6,388 |
6,322 |
Prince Edward Island |
8,225 |
7,661 |
6,796 |
6,063 |
6,208 |
Nova Scotia |
8,712 |
8,149 |
8,082 |
7,494 |
6,956 |
New Brunswick |
7,271 |
6,443 |
6,022 |
5,586 |
5,665 |
Quebec |
5,397 |
5,321 |
5,415 |
5,129 |
5,065 |
Ontario |
5,450 |
5,258 |
5,399 |
5,106 |
4,879 |
Manitoba |
12,732 |
11,808 |
11,642 |
10,934 |
9,911 |
Saskatchewan |
14,975 |
14,142 |
13,659 |
13,402 |
12,892 |
Alberta |
9,981 |
9,797 |
9,362 |
9,160 |
8,808 |
British Columbia |
12,199 |
11,719 |
11,178 |
10,462 |
9,580 |
Yukon |
23,261 |
22,188 |
19,922 |
20,781 |
21,805 |
Northwest Territories |
41,840 |
42,734 |
40,544 |
43,124 |
43,509 |
Nunavut |
36,745 |
34,862 |
31,277 |
30,265 |
34,867 |
Canada |
7,601 |
7,326 |
7,245 |
6,900 |
6,589 |
Source: Uniform Crime Reporting Survey, Canadian Centre for Justice Statistics, Statistics Canada.
Note:
Rates are based on 100,000 population.
The crime rate represents all Criminal Code incidents excluding traffic violations and other federal statutes, such as drug offences.
Data presented in this table do not reflect the changes in the classification of violation groups as published in the Juristat article - "Police-reported crime statistics in Canada, 2008.
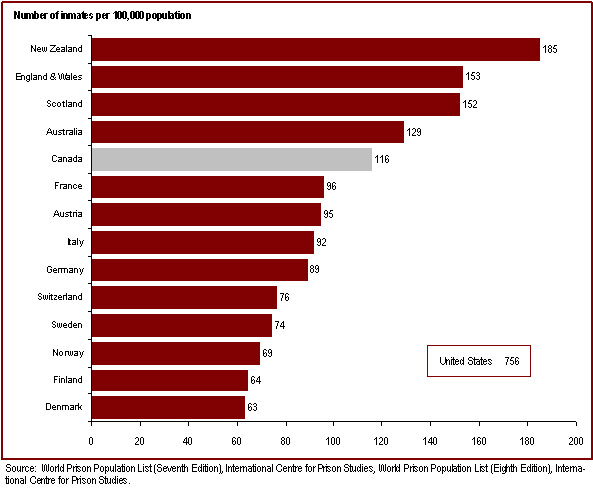
Canada's Incarceration Rate is High Relative to Most Western European Countries
Source: World Prison Population List (Seventh Edition), International Centre for Prison Studies, World Prison Population List (Eighth Edition), International Centre for Prison Studies.
- Canada's incarceration rate is higher than the rates in most Western European countries but much lower than the United States, where the most recent incarceration rate was 756 per 100,000 general population.
- The incarceration rate in Canada has decreased 8% from 126 per 100,000 in 1997 to 116 per 100,000 in 2008.
Note:
The incarceration rate, in this figure, is a measure of the number of people (i.e., adults and youth) in custody per 100,000 people in the general population.
Incarceration rates from the World Prison Population List are based on the most recently available data at the time the list was compiled. Due to variations in the availability of information, the 2006 and 2008 dates reported in Table A2 refer to when the World Prison Population Lists were published, but may not necessarily correspond to the date the data was obtained. Additionally, different practices and variations in measurement in different countries limit the comparability of these figures.
|
1997 |
1998 |
1999 |
2000 |
2001 |
2002 |
2003 |
2004 |
20061* |
20082* |
|---|---|---|---|---|---|---|---|---|---|---|
United States |
649 |
682 |
682 |
699 |
700 |
701 |
714 |
723 |
738 |
756 |
New Zealand |
137 |
150 |
149 |
149 |
145 |
155 |
168 |
168 |
186 |
185 |
England & Wales |
120 |
125 |
125 |
124 |
125 |
141 |
142 |
141 |
148 |
153 |
Scotland |
119 |
119 |
118 |
115 |
120 |
129 |
132 |
136 |
139 |
152 |
Australia |
95 |
110 |
108 |
108 |
110 |
115 |
117 |
120 |
126 |
129 |
Canada |
126 |
123 |
118 |
116 |
116 |
116 |
108 |
107 |
107 |
116 |
France |
90 |
88 |
91 |
89 |
80 |
93 |
91 |
91 |
85 |
96 |
Austria |
86 |
86 |
85 |
84 |
85 |
100 |
106 |
110 |
105 |
95 |
Italy |
86 |
85 |
89 |
94 |
95 |
100 |
98 |
96 |
104 |
92 |
Germany |
90 |
96 |
97 |
97 |
95 |
98 |
96 |
98 |
95 |
89 |
Switzerland |
88 |
85 |
81 |
79 |
90 |
68 |
81 |
81 |
83 |
76 |
Sweden |
59 |
60 |
59 |
64 |
65 |
73 |
75 |
81 |
82 |
74 |
Norway |
53 |
57 |
56 |
-- |
60 |
59 |
65 |
65 |
66 |
69 |
Finland |
56 |
54 |
46 |
52 |
50 |
70 |
71 |
66 |
75 |
64 |
Denmark |
62 |
64 |
66 |
61 |
60 |
64 |
70 |
70 |
77 |
63 |
Source: 1World Prison Population List (Seventh Edition), International Centre for Prison Studies, 2World Prison Population List (Eighth Edition), International Centre for Prison Studies.
Note:
*Incarceration rates from the World Prison Population List are based on the most recently available data at the time the list was compiled. Due to variations in the availability of information, the 2006 and 2008 dates reported in Table A2 refer to when the World Prison Population Lists were published, but may not necessarily correspond to the date the data was obtained. Additionally, different practices and variations in measurement in different countries limit the comparability of these figures.
Rates are based on 100,000 population.
-- Figures not available.
The Rate of Adults Charged has Declined Since 1982

Source: Uniform Crime Reporting Survey, Canadian Centre for Justice Statistics, Statistics Canada.
- The rate of adults charged declined steadily from 1991 to 1999, and has fluctuated since.
- The rate of women charged with violent crimes doubled between 1984 and 2001, and has since leveled off at approximately 155 women charged per 100,000 women in the population. In comparison, the rate of men charged with violent crimes peaked in 1993 at 1,080 men charged per 100,000 men in the population and has since decreased to 762 in 2008.
Note:
Violent crimes include homicide, attempted murder, assault, sexual offences, abduction and robbery.
Property crimes include break and enter, motor vehicle thefts, other thefts, possession of stolen goods and fraud.
Total charged includes adults charged under the Criminal Code as well as adults charged under other Federal Statutes such as the Controlled Drugs and Substances Act, the Fisheries Act, the Customs Act, the Indian Act and the Employment Insurance Act but excludes provincial statute offences and municipal by-laws.
Year |
Criminal Code |
|
Federal Statutes |
||||
|---|---|---|---|---|---|---|---|
Violent |
Property |
Other |
Total |
Drugs |
Other* |
Total Charged** |
|
1984 |
363 |
1,122 |
620 |
2,104 |
203 |
57 |
2,364 |
1985 |
374 |
1,007 |
582 |
1,963 |
194 |
41 |
2,199 |
1986 |
405 |
974 |
641 |
2,021 |
190 |
43 |
2,254 |
1987 |
439 |
962 |
683 |
2,085 |
198 |
40 |
2,323 |
1988 |
462 |
941 |
684 |
2,087 |
195 |
43 |
2,324 |
1989 |
489 |
880 |
677 |
2,047 |
217 |
44 |
2,308 |
1990 |
529 |
905 |
683 |
2,118 |
198 |
38 |
2,354 |
1991 |
582 |
968 |
732 |
2,282 |
194 |
40 |
2,516 |
1992 |
587 |
925 |
713 |
2,225 |
198 |
50 |
2,474 |
1993 |
596 |
839 |
677 |
2,112 |
183 |
51 |
2,345 |
1994 |
573 |
739 |
619 |
1,932 |
178 |
42 |
2,152 |
1995 |
530 |
719 |
597 |
1,846 |
171 |
36 |
2,053 |
1996 |
523 |
727 |
579 |
1,829 |
172 |
29 |
2,030 |
1997 |
510 |
651 |
552 |
1,713 |
158 |
26 |
1,896 |
1998 |
494 |
615 |
561 |
1,670 |
168 |
24 |
1,862 |
1999 |
479 |
569 |
570 |
1,618 |
185 |
30 |
1,832 |
2000 |
496 |
528 |
593 |
1,617 |
198 |
26 |
1,842 |
2001 |
517 |
522 |
638 |
1,677 |
202 |
28 |
1,907 |
2002 |
499 |
507 |
640 |
1,647 |
199 |
29 |
1,875 |
2003 |
482 |
515 |
650 |
1,647 |
172 |
23 |
1,842 |
2004 |
469 |
515 |
663 |
1,648 |
187 |
30 |
1,866 |
2005 |
472 |
492 |
654 |
1,617 |
185 |
29 |
1,831 |
2006 |
478 |
473 |
674 |
1,624 |
198 |
27 |
1,849 |
2007 |
463 |
436 |
696 |
1,595 |
208 |
28 |
1,830 |
2008 |
454 |
413 |
698 |
1,565 |
203 |
31 |
1,799 |
Source: Uniform Crime Reporting Survey, Canadian Centre for Justice Statistics, Statistics Canada.
Note:
*Examples of other Federal Statutes include: the Controlled Drugs and Substances Act, the Fisheries Act, the Customs Act, the Indian Act and the Employment Insurance Act.
**Total charged excludes provincial statute offences and municipal by-laws.
Rates are based on 100,000 population, 18 years of age and older.
Due to rounding, rates may not add to Totals.
Administration of Justice Charges Account For 24% of Charges in Adult Courts

Source: Adult Criminal Court Survey, Canadian Centre for Justice Statistics, Statistics Canada.
- Administration of justice charges (offences related to case proceedings such as failure to appear in court, failure to comply with a court order, breach of probation, and unlawfully at large) account for almost one quarter of charges before the courts.
- Apart from charges of administration of justice, impaired driving, which has decreased in each of the last three years, is the most frequent federal statute charge in adult courts.
Note:
The concept of a case has changed from previous editions of this report to more closely reflect court processing. Statistics from the Adult Criminal Court Survey used in this report should not be compared to those in previous editions of the Corrections and Conditional Release Statistical Overview.
These statistics were previously reported in the 2008 Corrections and Conditional Release Statistical Overview. No new data are available.
Type of Charge |
Criminal Code and Other Federal Statute Charges |
|||||
|---|---|---|---|---|---|---|
2004-05 |
2005-06 |
2006-07 |
||||
|
# |
% |
# |
% |
# |
% |
Crimes Against the Person |
228,606 |
22.53 |
246,687 |
23.36 |
251,371 |
23.41 |
Homicide and Related |
421 |
0.04 |
448 |
0.04 |
483 |
0.04 |
Attempted Murder |
525 |
0.05 |
633 |
0.06 |
589 |
0.05 |
Robbery |
9,606 |
0.95 |
9,906 |
0.94 |
10,090 |
0.94 |
Sexual Assault |
8,152 |
0.80 |
7,890 |
0.75 |
8,439 |
0.79 |
Other Sexual Offences |
5,037 |
0.50 |
4,663 |
0.44 |
4,652 |
0.43 |
Major Assault (Levels 2 & 3) |
41,089 |
4.05 |
44,405 |
4.20 |
44,957 |
4.19 |
Common Assault (Level 1) |
79,127 |
7.80 |
84,580 |
8.01 |
84,965 |
7.91 |
Uttering Threats |
41,783 |
4.12 |
45,120 |
4.27 |
44,667 |
4.16 |
Criminal Harassment |
7,226 |
0.71 |
7,419 |
0.70 |
7,690 |
0.72 |
Weapons |
28,489 |
2.81 |
33,940 |
3.21 |
36,325 |
3.38 |
Other Crimes Against Persons |
7,151 |
0.70 |
7,683 |
0.73 |
8,514 |
0.79 |
|
||||||
Crimes Against Property |
273,256 |
26.93 |
264,837 |
25.07 |
263,541 |
24.54 |
Theft |
83,032 |
8.18 |
79,888 |
7.56 |
80,138 |
7.46 |
Break and Enter |
29,680 |
2.93 |
28,842 |
2.73 |
28,680 |
2.67 |
Fraud |
65,357 |
6.44 |
63,254 |
5.99 |
63,237 |
5.89 |
Mischief |
34,096 |
3.36 |
34,581 |
3.27 |
36,051 |
3.36 |
Possession of Stolen Property |
57,634 |
5.68 |
55,504 |
5.26 |
53,187 |
4.95 |
Other Property Crimes |
3,457 |
0.34 |
2,768 |
0.26 |
2,248 |
0.21 |
|
||||||
Administration of Justice |
227,503 |
22.42 |
247,120 |
23.40 |
257,112 |
23.95 |
Fail to Appear |
24,014 |
2.37 |
23,421 |
2.22 |
23,377 |
2.18 |
Breach of probation |
79,775 |
7.86 |
87,289 |
8.26 |
90,675 |
8.44 |
Unlawfully at large |
6,924 |
0.68 |
5,708 |
0.54 |
5,827 |
0.54 |
Fail to Comply with Order |
111,303 |
10.97 |
124,734 |
11.81 |
131,018 |
12.20 |
Other Admin. Justice |
5,487 |
0.54 |
5,968 |
0.57 |
6,215 |
0.58 |
|
||||||
Other Criminal Code |
58,532 |
5.77 |
71,057 |
6.73 |
74,033 |
6.89 |
Prostitution |
3,727 |
0.37 |
3,346 |
0.32 |
3,616 |
0.34 |
Disturbing the Peace |
6,307 |
0.62 |
6,172 |
0.58 |
6,207 |
0.58 |
Residual Criminal Code |
48,498 |
4.78 |
61,539 |
5.83 |
64,210 |
5.98 |
|
||||||
Criminal Code Traffic |
122,816 |
12.11 |
121,361 |
11.49 |
117,288 |
10.92 |
Impaired Driving |
101,672 |
10.02 |
99,672 |
9.44 |
95,503 |
8.89 |
Other CC Traffic |
21,144 |
2.08 |
21,689 |
2.05 |
21,785 |
2.03 |
|
||||||
Other Federal Statutes |
103,863 |
10.24 |
105,150 |
9.96 |
110,392 |
10.28 |
Drug Possession |
30,676 |
3.02 |
32,715 |
3.10 |
35,001 |
3.26 |
Drug Trafficking |
25,757 |
2.54 |
25,520 |
2.42 |
26,910 |
2.51 |
Residual Federal Statutes |
47,430 |
4.67 |
46,915 |
4.44 |
48,481 |
4.52 |
Total Offences |
1,014,576 |
100.00 |
1,056,212 |
100.00 |
1,073,737 |
100.00 |
Source: Adult Criminal Court Survey, Canadian Centre for Justice Statistics, Statistics Canada.
Note:
Weapons have been included under "Crimes Against the Person" in this report. The Adult Criminal Court Survey groups these offences under "Other Criminal Code". Table excludes Youth Criminal Justice Act/Young Offenders Act offences. The Adult Criminal Court Survey groups these offences under "Other Federal Statutes". Due to rounding, percentages may not add to 100 percent. Data from this survey are not nationally comprehensive as they do not include Manitoba for years prior to 2005-06. In addition, Superior Court data are not reported to the Adult Criminal Court Survey for Quebec, Ontario and Saskatchewan. The concept of a case has changed from previous editions of this report to more closely reflect court processing. Statistics from the Adult Criminal Court Survey used in this report should not be compared to those in previous editions of the Corrections and Conditional Release Statistical Overview. These statistics were previously reported in the 2008 Corrections and Conditional Release Statistical Overview. No new data are available.
Victimization Rates for Theft of Personal Property have Increased

Source: General Social Survey, Statistics Canada, 1999 and 2004.
- Victimization rates for theft of personal property were higher in 2004 than in 1999
- Rates of victimization for assault were slightly lower in 2004 than in 1999.
Note:
*Assault data includes incidents of spousal violence. In previous editions of this document, the victimization data excluded incidents of spousal violence.
The next General Social Survey is in 2009.
Rates are based on 1,000 population, 15 years of age and older.
These statistics were previously reported in the 2008 Corrections and Conditional Release Statistical Overview. No new data are available.
Type of Incident |
Year |
|
|---|---|---|
1999 |
2004 |
|
Theft of Personal Property |
75 |
93 |
Sexual Assault |
21 |
21 |
Robbery |
9 |
11 |
Assault* |
81 |
75 |
Source: General Social Survey, Statistics Canada, 1999 and 2004.
Note:
*Assault data includes incidents of spousal violence. In previous editions of this document, the victimization data excluded incidents of spousal violence.
The next General Social Survey is in 2009.
Rates are based on 1,000 population, 15 years of age and older.
These statistics were previously reported in the 2008 Corrections and Conditional Release Statistical Overview. No new data are available.
The Majority of Victims of Violent Crime are Under 30

Source: Incident-based Uniform Crime Reporting Survey, Canadian Centre for Justice Statistics, Statistics Canada.
- More than half (53.5%) of all victims of violent crime reported in 2008 were under the age of 30, whereas 37.4% of the Canadian population is under the age of 30.
- Females aged 15 to 44 years were more likely than males of that age to be victims of a violent crime.
- Canadians aged 65 and older, who account for 13.7% of the general population, represent 2.1% of victims of violent crime.
Note:
Violent crimes include homicide, attempted murder, assault, sexual offences, abduction, robbery and traffic offences causing bodily harm and death.
The data do not represent 100% coverage. In 2008, 155 police services in all 10 provinces and 3 territories supplied data for the complete year to the UCR2 and represented approximately 98% of the population of Canada. The data excludes 4,661 cases where age was unknown, 2,076 cases where sex was unknown and 651 cases where both age and sex were unknown.
Due to rounding, totals may not add to 100 percent.
Age of Victim |
Males |
Females |
Total |
|||
|---|---|---|---|---|---|---|
# |
% |
# |
% |
# |
% |
|
0 to 4 years |
1,731 |
0.9 |
1,868 |
1.0 |
3,599 |
1.0 |
5 to 9 years |
3,860 |
2.1 |
3,744 |
2.0 |
7,604 |
2.0 |
10 to 14 years |
15,105 |
8.2 |
13,684 |
7.2 |
28,789 |
7.7 |
15 to 19 years |
30,116 |
16.3 |
31,100 |
16.5 |
61,216 |
16.4 |
20 to 24 years |
26,174 |
14.2 |
28,930 |
15.3 |
55,104 |
14.7 |
25 to 29 years |
20,715 |
11.2 |
23,102 |
12.2 |
43,817 |
11.7 |
30 to 34 years |
16,757 |
9.1 |
19,492 |
10.3 |
36,249 |
9.7 |
35 to 39 years |
16,683 |
9.0 |
18,592 |
9.8 |
35,275 |
9.4 |
40 to 44 years |
16,035 |
8.7 |
16,861 |
8.9 |
32,896 |
8.8 |
45 to 49 years |
14,168 |
7.7 |
13,244 |
7.0 |
27,412 |
7.3 |
50 to 54 years |
9,765 |
5.3 |
7,967 |
4.2 |
17,732 |
4.7 |
55 to 59 years |
6,027 |
3.3 |
4,367 |
2.3 |
10,394 |
2.8 |
60 to 64 years |
3,589 |
1.9 |
2,435 |
1.3 |
6,024 |
1.6 |
65 to 69 years |
1,855 |
1.0 |
1,382 |
0.7 |
3,237 |
0.9 |
70 to 74 years |
998 |
0.5 |
789 |
0.4 |
1,787 |
0.5 |
75 and over |
1,157 |
0.6 |
1,313 |
0.7 |
2,470 |
0.7 |
Total |
184,735 |
100.0 |
188,870 |
100.0 |
373,605 |
100.0 |
Source: Incident-based Uniform Crime Reporting Survey, Canadian Centre for Justice Statistics, Statistics Canada
Note:
The data do not represent 100% coverage. In 2008, 155 police services in all 10 provinces and 3 territories supplied data for the complete year to the UCR2 and represented approximately 98% of the population of Canada. The data excludes 4,661 cases where age was unknown, 2,076 cases where sex was unknown and 651 cases where both age and sex were unknown.
Due to rounding, totals may not add to 100 percent.
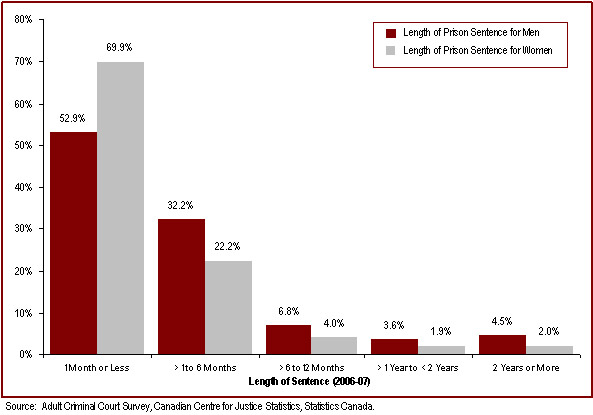
Most Adult Custodial Sentences Ordered by the Court are Short
Source: Adult Criminal Court Survey, Canadian Centre for Justice Statistics, Statistics Canada.
- Over half (54.6%) of all custodial sentences imposed by adult courts are less than one month.
- Prison sentences for men tend to be longer than for women. Over two-thirds (69.9%) of women and just over half of men (52.9%) who are incarcerated upon conviction receive a sentence of one month or less, and 92.1% of women and 85.1% of men receive a sentence of six months or less.
- Of all convictions that result in custody, only 4.2% result in federal jurisdiction (i.e., a sentence of two years or more).
Note:
Due to rounding, totals may not add to 100 percent.
Excludes cases where length of prison sentence was not known.
Superior Court data are not reported to the Adult Criminal Court Survey for Quebec, Ontario and Saskatchewan.
The concept of case has changed in the Adult Criminal Court Survey to more closely reflect court processing. As a result, these figures should not be compared to the court statistics reported in previous editions of the Corrections and Conditional Release Statistical Overview.
These statistics were previously reported in the 2008 Corrections and Conditional Release Statistical Overview. No new data are available.
Length of Prison Sentence |
2002-03 |
2003-04 |
2004-05 |
2005-06 |
2006-07 |
|---|---|---|---|---|---|
% |
% |
% |
% |
% |
|
1 Month or Less |
|
|
|
|
|
Women |
65.2 |
68.0 |
68.3 |
68.7 |
69.9 |
Men |
50.8 |
51.7 |
52.1 |
52.4 |
52.9 |
Total |
52.2 |
53.3 |
53.7 |
54.2 |
54.6 |
More Than 1 Month to 6 Months |
|
|
|
|
|
Women |
21.5 |
19.9 |
22.6 |
22.9 |
22.2 |
Men |
31.9 |
31.5 |
32.5 |
32.5 |
32.2 |
Total |
30.9 |
30.4 |
31.5 |
31.5 |
31.1 |
More Than 6 Months to 12 Months |
|
|
|
|
|
Women |
3.3 |
2.4 |
4.6 |
3.9 |
4.0 |
Men |
5.8 |
5.6 |
6.7 |
6.8 |
6.8 |
Total |
5.6 |
5.3 |
6.5 |
6.5 |
6.7 |
More Than 1 Year to Less Than 2 Years |
|
|
|
|
|
Women |
1.7 |
1.4 |
1.7 |
1.9 |
1.9 |
Men |
2.8 |
2.9 |
3.6 |
3.7 |
3.6 |
Total |
2.7 |
2.8 |
3.4 |
3.5 |
3.5 |
2 Years or More |
|
|
|
|
|
Women |
1.7 |
2.2 |
2.0 |
2.1 |
2.0 |
Men |
4.0 |
4.3 |
4.5 |
4.2 |
4.5 |
Total |
3.8 |
4.1 |
4.3 |
4.0 |
4.2 |
Source: Adult Criminal Court Survey, Canadian Centre for Justice Statistics, Statistics Canada.
Note:
Due to rounding, totals may not add to 100 percent.
Excludes cases where length of prison sentence was not known.
Superior Court data are not reported to the Adult Criminal Court Survey for Quebec, Ontario and Saskatchewan.
The concept of case has changed in the Adult Criminal Court Survey to more closely reflect court processing. As a result, these figures should not be compared to the court statistics reported in previous editions of the Corrections and Conditional Release Statistical Overview.
These statistics were previously reported in the 2008 Corrections and Conditional Release Statistical Overview. No new data are available.
Relatively few crimes result in sentences to federal Penitentiaries

Source: 1Uniform Crime Reporting Survey, Adult Criminal Court Survey and Adult Corrections Survey, Canadian Centre for Justice Statistics, Statistics Canada; 2Correctional Service Canada.
- There were about 2.5 million crimes reported to police in 2008.
- During 2008-09, 4,825 offenders were sentenced to federal jurisdiction (i.e., two years or more).
Note:
*This figure only includes cases convicted in provincial court and partial data from Superior Court. The concept of case has changed in the Adult Criminal Court Survey to more closely reflect court processing. As a result, these figures should not be compared to the court statistics reported in previous editions of the Corrections and Conditional Release Statistical Overview.
#These statistics were previously reported in the 2008 Corrections and Conditional Release Statistical Overview. No new data are available.
Police data are reported on a calendar year basis whereas court and prison data are reported on a fiscal year basis (April 1 through March 31).
|
2004-05 |
2005-06 |
2006-07 |
2007-08 |
2008-09 |
|---|---|---|---|---|---|
Total Number of Offences Reported to Police1 |
2,680,215 |
2,608,736 |
2,606,882 |
2,534,730 |
2,473,087 |
Convicted cases in Adult Court1*# |
238,456 |
244,572 |
242,988 |
Not available |
Not available |
Sentenced Admissions to Provincial/ Territorial Custody1 |
62,388 |
88,273 |
85,371 |
85,748 |
Not available |
Warrant of Committal Admissions to Federal Facilities2 |
4,553 |
4,784 |
5,115 |
5,010 |
4,825 |
Source: 1Uniform Crime Reporting Survey, Adult Criminal Court Survey and Adult Corrections Survey, Canadian Centre for Justice Statistics, Statistics Canada; 2Correctional Service Canada.
Note:
*This figure only includes cases convicted in provincial court and partial data from Superior Court. The concept of case has changed in the Adult Criminal Court Survey to more closely reflect court processing. As a result, these figures should not be compared to the court statistics reported in previous editions of the Corrections and Conditional Release Statistical Overview.
#These statistics were previously reported in the 2008 Corrections and Conditional Release Statistical Overview. No new data are available.
Police data are reported on a calendar year basis whereas court and prison data are reported on a fiscal year basis (April 1 through March 31).
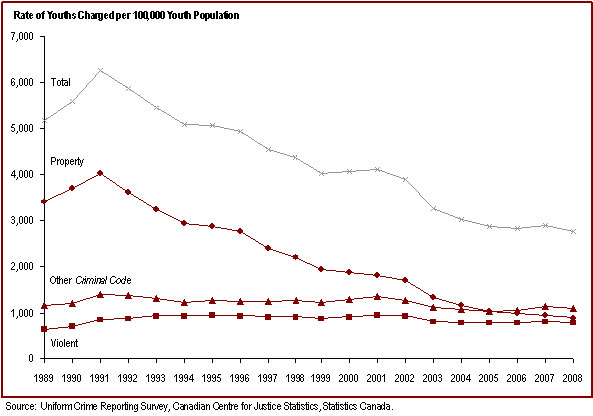
The Rate of Youth Charged Peaked in 1991 and has Declined Steadily Since
Source: Uniform Crime Reporting Survey, Canadian Centre for Justice Statistics, Statistics Canada.
- The rate of youth* charged has decreased since 1991.
- In 2003, there was a notable decrease in all major crime categories, in part attributable to the implementation of the Youth Criminal Justice Act (YCJA) in April 2003, which places greater emphasis on diversion.
Note:
*For criminal justice purposes, youth are defined under Canadian law as persons aged 12 to 17 years.
Violent crimes include homicide, attempted murder, assault, sexual offences, abduction and robbery.
Property crimes include break and enter, motor vehicle thefts, other thefts, possession of stolen goods and fraud.
In 2008, 43.3% of all youths charged with violent crimes were charged with assault level 1 (minor assault).
Year |
Type of Offence |
|||||||||||
|---|---|---|---|---|---|---|---|---|---|---|---|---|
Violent |
Property |
Other CCC |
Total |
|||||||||
|
Female |
Male |
Total |
Female |
Male |
Total |
Female |
Male |
Total |
Female |
Male |
Total |
1989 |
235 |
964 |
614 |
1,186 |
5,456 |
3,401 |
371 |
1,880 |
1,153 |
1,944 |
8,714 |
5,168 |
1990 |
286 |
1,072 |
696 |
1,335 |
5,912 |
3,712 |
364 |
1,982 |
1,202 |
2,178 |
9,430 |
5,610 |
1991 |
333 |
1,288 |
832 |
1,492 |
6,357 |
4,031 |
451 |
2,267 |
1,396 |
2,491 |
10,464 |
6,258 |
1992 |
365 |
1,327 |
869 |
1,450 |
5,615 |
3,629 |
480 |
2,197 |
1,375 |
2,539 |
9,709 |
5,874 |
1993 |
429 |
1,368 |
923 |
1,325 |
4,945 |
3,221 |
461 |
2,083 |
1,307 |
2,500 |
8,995 |
5,450 |
1994 |
406 |
1,382 |
918 |
1,186 |
4,511 |
2,924 |
421 |
1,983 |
1,234 |
2,288 |
8,502 |
5,077 |
1995 |
424 |
1,411 |
941 |
1,246 |
4,321 |
2,856 |
470 |
1,991 |
1,263 |
2,420 |
8,385 |
5,061 |
1996 |
432 |
1,386 |
932 |
1,200 |
4,185 |
2,761 |
599 |
1,938 |
1,250 |
2,419 |
8,158 |
4,943 |
1997 |
452 |
1,320 |
908 |
1,020 |
3,637 |
2,389 |
511 |
1,909 |
1,242 |
2,284 |
7,465 |
4,539 |
1998 |
451 |
1,307 |
902 |
953 |
3,331 |
2,198 |
542 |
1,925 |
1,266 |
2,250 |
7,162 |
4,365 |
1999 |
421 |
1,247 |
855 |
858 |
2,935 |
1,945 |
512 |
1,875 |
1,224 |
2,072 |
6,634 |
4,025 |
2000 |
455 |
1,332 |
915 |
851 |
2,796 |
1,869 |
541 |
1,977 |
1,291 |
2,152 |
6,717 |
4,075 |
2001 |
480 |
1,369 |
947 |
862 |
2,673 |
1,811 |
600 |
2,053 |
1,359 |
2,257 |
6,705 |
4,118 |
2002 |
481 |
1,307 |
916 |
850 |
2,484 |
1,708 |
567 |
1,931 |
1,280 |
2,215 |
6,309 |
3,904 |
2003 |
406 |
1,155 |
800 |
553 |
2,058 |
1,338 |
471 |
1,700 |
1,113 |
1,684 |
5,369 |
3,250 |
2004 |
397 |
1,107 |
770 |
472 |
1,806 |
1,167 |
469 |
1,616 |
1,068 |
1,582 |
4,967 |
3,005 |
2005 |
387 |
1,136 |
780 |
433 |
1,606 |
1,044 |
431 |
1,593 |
1,036 |
1,486 |
4,767 |
2,860 |
2006 |
389 |
1,135 |
780 |
450 |
1,469 |
982 |
442 |
1,615 |
1,052 |
1,514 |
4,647 |
2,814 |
2007 |
405 |
1,165 |
802 |
460 |
1,399 |
950 |
489 |
1,742 |
1,140 |
1,593 |
4,722 |
2,892 |
2008 |
404 |
1,120 |
778 |
448 |
1,273 |
878 |
497 |
1,674 |
1,108 |
1,590 |
4,486 |
2,764 |
Source: Uniform Crime Reporting Survey, Canadian Centre for Justice Statistics, Statistics Canada.
Note:
For criminal justice purposes, youth are defined under Canadian law as persons aged 12 to 17 years.
Rates for "Total" are based on 100,000 youth population (12 to 17 years).
Rates for "Females" are based on 100,000 female youth population (12 to 17 years) and rates for "Males" are based on 100,000 male youth population (12 to 17 years).
The Most Common Youth Court Case is Theft

Source: Youth Court Survey, Canadian Centre for Justice Statistics, Statistics Canada.
- Following the enactment of the Youth Criminal Justice Act in 2003, fewer youth are in court.
- Theft is the most common case in youth court.
- Homicides and related offences account for 0.1% of all youth cases.
- Females account for 22% of all cases, but they account for 35% of common assaults.
Note:
*"Administration of Justice" category includes the offences failure to appear, failure to comply, breach of recognizance, escape and unlawfully at large.
**Youth Criminal Justice Act offences include failure to comply with a disposition or undertaking, contempt against youth court, assisting a youth to leave a place of custody and harbouring a youth unlawfully at large. Also included are similar offences under the Young Offenders Act, which preceded the Youth Criminal Justice Act.
The concept of a case has changed in the Youth Court Survey to more closely reflect court processing. As a result, these figures should not be compared to the youth court statistics reported in previous editions of the Corrections and Conditional Release Statistical Overview.
These statistics were previously reported in the 2008 Corrections and Conditional Release Statistical Overview. No new data are available.
Type of Case |
Number of Youth Court Cases |
||||
|---|---|---|---|---|---|
2002-03 |
2003-04 |
2004-05 |
2005-06 |
2006-07 |
|
|
|||||
Crimes Against the Person |
20,342 |
18,570 |
16,988 |
16,805 |
17,122 |
Common Assault |
7,440 |
6,768 |
5,953 |
5,940 |
5,682 |
Major Assault |
3,892 |
3,633 |
3,400 |
3,488 |
3,435 |
Robbery |
2,598 |
2,227 |
2,021 |
1,990 |
2,228 |
Weapons / Firearms / Explosives |
1,896 |
1,854 |
1,861 |
1,839 |
1,996 |
Sexual Assault / Sexual Offences |
1,499 |
1,451 |
1,305 |
1,252 |
1,165 |
Homicide and Related Offences |
75 |
66 |
61 |
56 |
63 |
Other Crimes Against the Person |
2,942 |
2,571 |
2,387 |
2,440 |
2,553 |
|
|||||
Crimes Against Property |
31,359 |
25,532 |
22,722 |
21,522 |
21,279 |
Theft |
12,413 |
9,211 |
7,977 |
7,503 |
7,687 |
Break and Enter |
7,344 |
6,653 |
6,087 |
5,607 |
5,066 |
Possession of Stolen Goods |
5,218 |
4,262 |
3,680 |
3,504 |
3,505 |
Mischief |
4,647 |
3,765 |
3,557 |
3,728 |
3,878 |
Fraud |
1,345 |
1,181 |
1,009 |
827 |
817 |
Other Crimes Against Property |
392 |
460 |
412 |
353 |
326 |
|
|||||
Administration of Justice |
5,924 |
5,186 |
4,904 |
4,793 |
4,945 |
Escape / Unlawfully at Large |
1,131 |
889 |
666 |
596 |
549 |
Other Administration of Justice* |
4,793 |
4,297 |
4,238 |
4,197 |
4,396 |
|
|||||
Other Criminal Code |
4,119 |
3,819 |
3,475 |
3,558 |
3,561 |
Prostitution |
28 |
27 |
11 |
26 |
19 |
Disturbing the Peace |
363 |
260 |
230 |
228 |
244 |
Impaired Driving / Other CC traffic |
1,329 |
1,216 |
1,136 |
1,049 |
1,086 |
Residual Criminal Code |
2,399 |
2,316 |
2,098 |
2,255 |
2,212 |
|
|||||
Other Federal Statutes |
14,409 |
10,895 |
9,499 |
9,393 |
9,556 |
Drug Possession |
3,899 |
2,214 |
2,198 |
2,236 |
2,430 |
Drug Trafficking |
1,635 |
1,427 |
1,309 |
1,243 |
1,305 |
Youth Criminal Justice Act** |
8,678 |
7,118 |
5,828 |
4,966 |
4,795 |
Residual Federal Statutes |
197 |
136 |
164 |
948 |
1,026 |
Total |
76,153 |
64,002 |
57,588 |
56,071 |
56,463 |
Source: Youth Court Survey, Canadian Centre for Justice Statistics, Statistics Canada.
Note:
*"Other Administration of Justice" includes the offences failure to appear, failure to comply, and breach of recognizance.
**Youth Criminal Justice Act offences include failure to comply with a disposition or undertaking, contempt against youth court, assisting a youth to leave a place of custody and harbouring a youth unlawfully at large. Also included are similar offences under the Young Offenders Act, which preceded the Youth Criminal Justice Act.
The concept of a case has changed in the Youth Court Survey to more closely reflect court processing. As a result, these figures should not be compared to the youth court statistics reported in previous editions of the Corrections and Conditional Release Statistical Overview.
These statistics were previously reported in the 2008 Corrections and Conditional Release Statistical Overview. No new data are available.
Fewer youth are receiving custodial sentences under the YCJA

Source: Youth Court Survey, Canadian Centre for Justice Statistics, Statistics Canada.
- Consistent with the objectives of the YCJA, fewer youth are sentenced to custody. In 2006-07, about 17% of all guilty cases resulted in the youth being sentenced to custody. This compares to 27% of all guilty cases in 2002-03.
- In 2006-07, 59% of youth found guilty were given probation, down from 70% in 2002-03, the last year of the Young Offenders Act.
- Of the new YCJA sentences, deferred custody and supervision orders were handed down the most frequently. In 2006-07, 3% of all guilty cases received such an order.
Note:
*"Other" includes absolute discharge, restitution, prohibition, seizure, forfeiture, compensation, pay purchaser, essays, apologies, counseling programs and conditional discharge. Commencing in 2003-04, it also includes conditional sentence, intensive support and supervision, attendance at non-residential program and reprimand.
The concept of a case has changed in the Youth Court Survey to more closely reflect court processing. As a result, these figures should not be compared to the youth court statistics reported in previous editions of the Corrections and Conditional Release Statistical Overview.
These statistics were previously reported in the 2008 Corrections and Conditional Release Statistical Overview. No new data are available.
Type of Disposition |
Gender |
Year |
||||
|---|---|---|---|---|---|---|
2002-03 |
2003-04 |
2004-05 |
2005-06 |
2006-07 |
||
|
|
% |
% |
% |
% |
% |
Probation |
Female |
70.0 |
61.0 |
60.1 |
59.6 |
57.4 |
|
Male |
70.1 |
63.8 |
63.1 |
61.1 |
59.5 |
|
Total |
70.0 |
63.2 |
62.4 |
60.1 |
58.6 |
Custody |
Female |
22.6 |
17.0 |
16.2 |
15.3 |
13.5 |
|
Male |
28.1 |
23.4 |
22.4 |
19.9 |
18.1 |
|
Total |
26.9 |
22.1 |
21.1 |
18.4 |
16.6 |
Community Service Order |
Female |
26.6 |
26.0 |
25.6 |
23.9 |
22.3 |
|
Male |
27.2 |
27.7 |
27.7 |
26.1 |
25.1 |
|
Total |
27.1 |
27.4 |
27.2 |
24.8 |
23.8 |
Fine |
Female |
5.2 |
5.2 |
4.9 |
4.1 |
4.0 |
|
Male |
7.3 |
6.4 |
6.0 |
5.8 |
5.8 |
|
Total |
6.9 |
6.2 |
5.8 |
5.5 |
5.5 |
Deferred Custody and Supervision |
Female |
0.0 |
1.0 |
2.7 |
3.0 |
2.5 |
|
Male |
0.0 |
1.5 |
3.0 |
3.7 |
3.5 |
|
Total |
0.0 |
1.4 |
3.0 |
3.5 |
3.2 |
Other* |
Female |
28.4 |
34.2 |
40.1 |
37.4 |
36.8 |
|
Male |
31.1 |
35.6 |
42.1 |
41.0 |
40.3 |
|
Total |
30.5 |
35.3 |
41.8 |
38.9 |
38.1 |
Source: Youth Court Survey, Canadian Centre for Justice Statistics, Statistics Canada.
Note:
*"Other" includes absolute discharge, restitution, prohibition, seizure, forfeiture, compensation, pay purchaser, essays, apologies, counseling programs and conditional discharge. Commencing in 2003-04, it also includes conditional sentence, intensive support and supervision, attendance at non-residential program and reprimand.
The concept of a case has changed in the Youth Court Survey to more closely reflect court processing. As a result, these figures should not be compared to the youth court statistics reported in previous editions of the Corrections and Conditional Release Statistical Overview.
These statistics were previously reported in the 2008 Corrections and Conditional Release Statistical Overview. No new data are available.
Section B: Corrections Administration
Federal Expenditures on corrections increased in 2007-08

Source: Correctional Service Canada; National Parole Board; Office of the Correctional Investigator, Statistics Canada Consumer Price Index.
- In 2007-08, expenditures on federal corrections in Canada totaled about $2.02 billion.
- Federal expenditures on corrections, in constant dollars, increased 19.1% from 2003-04 to 2007-08.
- The per capita cost adjusted for inflation was lower in 2003-04 than in 2007-08.
- Federal correctional expenditures represent less than 1% of the total federal government budget.
- Provincial/territorial expenditures totaled just under $1.64 billion in 2007-08 (see Adult Correctional Services Survey, Statistics Canada).
Note:
Federal expenditures on corrections include the spending by the Correctional Service Canada (CSC), the National Parole Board (NPB) and the Office of the Correctional Investigator (OCI). The expenditures for the CSC include both operating and capital costs. CSC expenditures exclude CORCAN (a Special Operating Agency that conducts industrial operations within penitentiaries).
Constant dollars represent dollar amounts calculated on a one-year base (2002) that adjusts for inflation allowing the yearly amounts to be directly comparable. Changes in the Consumer Price Index were used to calculate constant dollars.
Year |
Current Dollars |
Constant 2002 Dollars |
||||||
|---|---|---|---|---|---|---|---|---|
Operating |
Capital |
Total |
Per capita |
Operating |
Capital |
Total |
Per capita |
|
|
$'000 |
|
|
$ |
$'000 |
|
|
$ |
2003-04 |
||||||||
CSC |
1,411,746 |
110,530 |
1,522,276 |
48.11 |
1,385,831 |
108,501 |
1,494,332 |
47.23 |
NPB |
35,700 |
-- |
35,700 |
1.13 |
35,045 |
-- |
35,045 |
1.11 |
OCI |
2,790 |
-- |
2,790 |
0.09 |
2,739 |
-- |
2,739 |
0.09 |
Total |
1,450,236 |
110,530 |
1,560,766 |
49.33 |
1,423,614 |
108,501 |
1,532,115 |
48.42 |
2004-05 |
||||||||
CSC |
1,480,721 |
105,893 |
1,586,614 |
49.67 |
1,422,813 |
101,752 |
1,524,564 |
47.73 |
NPB |
41,200 |
-- |
41,200 |
1.29 |
39,589 |
-- |
39,589 |
1.24 |
OCI |
2,871 |
-- |
2,871 |
0.09 |
2,759 |
-- |
2,759 |
0.09 |
Total |
1,524,792 |
105,893 |
1,630,685 |
51.05 |
1,465,160 |
101,752 |
1,566,912 |
49.06 |
2005-06 |
||||||||
CSC |
1,533,498 |
116,843 |
1,650,341 |
51.18 |
1,440,716 |
109,774 |
1,550,489 |
48.08 |
NPB |
42,800 |
-- |
42,800 |
1.33 |
40,210 |
-- |
40,210 |
1.25 |
OCI |
3,115 |
-- |
3,115 |
0.10 |
2,927 |
-- |
2,927 |
0.09 |
Total |
1,579,413 |
116,843 |
1,696,256 |
52.60 |
1,483,853 |
109,774 |
1,593,626 |
49.42 |
2006-07 |
||||||||
CSC |
1,743,847 |
124,538 |
1,868,386 |
57.35 |
1,608,418 |
114,866 |
1,723,285 |
52.90 |
NPB |
43,400 |
-- |
43,400 |
1.33 |
40,030 |
-- |
40,030 |
1.23 |
OCI |
3,156 |
-- |
3,156 |
0.10 |
2,911 |
-- |
2,911 |
0.09 |
Total |
1,790,403 |
124,538 |
1,914,942 |
58.78 |
1,651,359 |
114,866 |
1,766,226 |
54.21 |
2007-08 |
||||||||
CSC |
1,827,839 |
140,641 |
1,968,480 |
59.78 |
1,650,717 |
127,013 |
1,777,730 |
53.99 |
NPB |
48,600 |
-- |
48,600 |
1.48 |
43,891 |
-- |
43,891 |
1.33 |
OCI |
3,132 |
-- |
3,132 |
0.10 |
2,829 |
-- |
2,829 |
0.09 |
Total |
1,879,571 |
140,641 |
2,020,212 |
61.35 |
1,697,436 |
127,013 |
1,824,449 |
55.41 |
Source: Correctional Service Canada; National Parole Board; Office of the Correctional Investigator, Statistics Canada Consumer Price Index.
Note:
Due to rounding, constant dollar amounts may not add to "Total".
Per capita cost is calculated by dividing the total expenditures by the total Canadian population and thus represents the cost per Canadian for federal correctional services.
Constant dollars represent dollar amounts calculated on a one-year base (2002) that adjusts for inflation allowing the yearly amounts to be directly comparable.
Changes in the Consumer Price Index were used to calculate constant dollars.
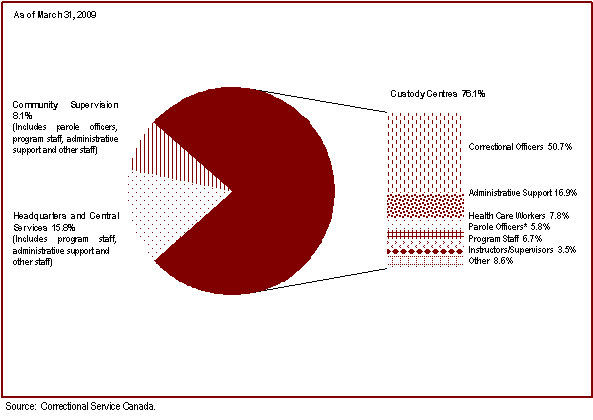
CSC Employees are concentrated in custody centres
Source: Correctional Service Canada.
- The Correctional Service of Canada (CSC) has a total staff of about 16,500.**
- Approximately 76% of CSC staff work in institutions.
- Staff employed in community supervision account for 8% of the total.
Note:
*These parole officers are situated within institutions, with the responsibility of preparing offenders for release.
**CSC has changed its definition of employee. Previously the total number of employees included casual employees, employees on leave without pay and suspended employees. These categories have been removed from the total as of 2005-06. These numbers represent active employees as of March 31, 2009.
Service Area |
Number of Staff |
Percent |
|---|---|---|
|
||
Headquarters and Central Services |
2,609 |
15.8 |
Administrative Support |
2,198 |
13.3 |
Program Staff |
108 |
0.7 |
Health Care Workers |
111 |
0.7 |
Correctional Officers |
44 |
0.3 |
Instructors / Supervisors |
17 |
0.1 |
Parole Officers / Parole Supervisors |
2 |
0.0 |
Other** |
129 |
0.8 |
|
||
Custody Centres |
12,590 |
76.1 |
Correctional Officers |
6,382 |
38.6 |
Administrative Support |
2,126 |
12.9 |
Health Care Workers |
988 |
6.0 |
Parole Officers / Parole Supervisors* |
727 |
4.4 |
Program Staff |
839 |
5.1 |
Instructors / Supervisors |
444 |
2.7 |
Other** |
1,084 |
6.6 |
|
||
Community Supervision |
1,337 |
8.1 |
Parole Officers / Parole Supervisors |
714 |
4.3 |
Administrative Support |
336 |
2.0 |
Program Staff |
198 |
1.2 |
Health Care Workers |
69 |
0.4 |
Correctional Officers |
18 |
0.1 |
Other** |
2 |
0.0 |
Total*** |
16,536 |
100.0 |
Source: Correctional Service Canada.
Note:
*These parole officers are situated within institutions, with the responsibility of preparing offenders for release.
**The "Other" category represents job classifications such as trades and food services.
***CSC has changed its definition of employee. Previously the total number of employees included casual employees, employees on leave without pay and suspended employees. These categories have been removed from the total as of 2005-06. These numbers represent active employees as of March 31, 2009.
Due to rounding, percentages may not add to 100.
The cost of keeping an inmate incarcerated has increased
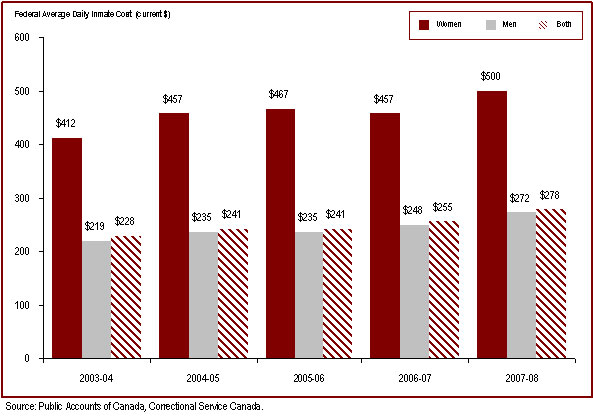
Source: Public Accounts of Canada, Correctional Service Canada.
- The federal average daily inmate cost has increased from $228 in 2003-04 to $278 in 2007-08.
- In 2007-08, the annual average cost of keeping an inmate incarcerated was $101,666 per year, up from $83,276 per year in 2003-04. In 2007-08, the annual average cost of keeping a male inmate incarcerated was $99,205 per year, whereas the annual average cost for incarcerating a woman was $182,506.
- It costs substantially less to maintain an offender in the community than to keep that individual incarcerated ($24,825 per year versus $101,666 per year).
Note:
The average daily inmate cost includes those costs associated with the operation of the institutions such as salaries and employee benefit plan contributions, but excludes capital expenditures and expenditures related to CORCAN (a Special Operating Agency that conducts industrial operations within penitentiaries).
In 2001-02, the cost allocation methodology was refined to better reflect expenditures directly related to offenders. In addition, the cost of keeping a woman incarcerated includes the cost of maximum security units for women co-located within institutions for men.
Categories |
Annual Average Costs per Offender (current $) |
||||
|---|---|---|---|---|---|
2003-04 |
2004-05 |
2005-06 |
2006-07 |
2007-08 |
|
Incarcerated Offenders |
|
||||
Maximum Security (males only) |
110,223 |
113,591 |
113,645 |
121,294 |
135,870 |
Medium Security (males only) |
71,640 |
75,661 |
75,251 |
80,545 |
87,498 |
Minimum Security (males only) |
74,431 |
83,643 |
82,676 |
83,297 |
89,377 |
Women's Facilities |
150,867 |
166,642 |
170,684 |
166,830 |
182,506 |
Exchange of Services Agreements |
56,393 |
65,932 |
71,605 |
77,428 |
77,762 |
Incarcerated Average |
83,276 |
87,919 |
88,067 |
93,030 |
101,666 |
Offenders in the Community |
20,698 |
20,320 |
23,105 |
23,076 |
24,825 |
Total Incarcerated and Community |
65,991 |
68,216 |
71,004 |
74,261 |
81,932 |
Source: Public Accounts of Canada, Correctional Service Canada
Note:
The average daily inmate cost includes those costs associated with the operation of the institutions such as salaries and employee benefit plan contributions, but excludes capital expenditures and expenditures related to CORCAN (a Special Operating Agency that conducts industrial operations within penitentiaries).
In 2001-02, the cost allocation methodology was refined to better reflect expenditures directly related to offenders. In addition, the cost of keeping a woman incarcerated includes the cost of maximum security units for women co-located within institutions for men.
The number of National Parole Board employees

Source: National Parole Board.
- The total number of full-time equivalents used by the National Parole Board has increased since 1999-00.
Note:
Section 103 of the Corrections and Conditional Release Act limits the National Parole Board to 45 full-time members.
Full-Time Equivalents |
|||||
|---|---|---|---|---|---|
|
2004-05 |
2005-06 |
2006-07 |
2007-08 |
2008-09 |
Strategic Outcome* |
|
|
|
|
|
Conditional Release Decisions |
296 |
305 |
278 |
288 |
291 |
Conditional Release Openness and Accountability |
-- |
-- |
57 |
53 |
58 |
Pardon Decisions and Clemency Recommendations |
40 |
65 |
32 |
36 |
39 |
Corporate Management |
49 |
34 |
49 |
39 |
40 |
Total |
385 |
404 |
416 |
416 |
428 |
Type of Employees |
|
|
|
|
|
Full-time Board Members |
41 |
43 |
40 |
41 |
37 |
Part-time Board Members |
15 |
18 |
19 |
22 |
25 |
Staff |
329 |
343 |
357 |
353 |
366 |
Total |
385 |
404 |
416 |
416** |
428 |
Source: National Parole Board.
Note:
*As of 2006-07, the Receiver General and Treasury Board Secretariat reporting requirements have been changed from Business Line to Strategic Outcome. Consequently, data regarding Conditional Release Openness and Accountability is unavailable prior to 2006-07.
**The National Parole Board transferred the Information Technology function to Correctional Services of Canada effective April 1st, 2007. This represented a reduction of 23 full-time equivalents.
Section 103 of the Corrections and Conditional Release Act limits the National Parole Board to 45 full-time members.
The number of employees in the Office of the Correctional Investigator
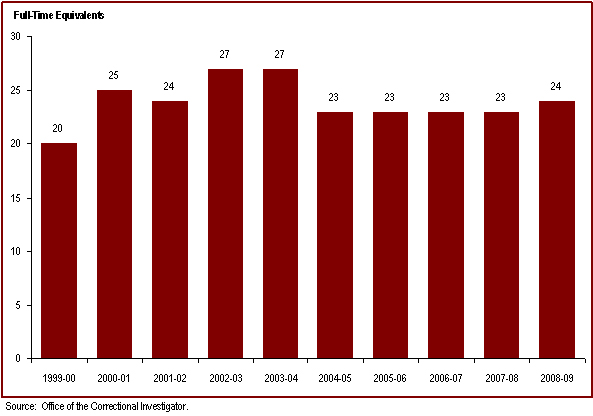
Source: Office of the Correctional Investigator.
- The total number of full-time equivalents at the Office of the Correctional Investigator has remained stable over the past five years.
- In 2008-09, approximately 6,100 complaints/inquires* were received by the Office of the Correctional Investigator.
Note:
*The Office of the Correctional Investigator (OCI) may commence an investigation on receipt of a complaint by or on behalf of an offender or on its own initiative. Complaints are made by telephone, letter and during interviews with the OCI's investigative staff at federal correctional facilities. The dispositions in response to complaints involve a combination of internal responses (where the information or assistance sought by the offender can generally be provided by the OCI's investigative staff) and investigations (where, further to a review/analysis of law, policies and documentation, OCI investigative staff make an inquiry or several interventions with Correctional Service Canada and submit recommendations to address the complaint). Investigations vary considerably in terms of scope, complexity, duration and resources required.
Full-Time Equivalents |
|||||
|---|---|---|---|---|---|
|
2004-05 |
2005-06 |
2006-07 |
2007-08 |
2008-09 |
Type of Employees |
|
|
|
|
|
Correctional Investigator |
1 |
1 |
1 |
1 |
1 |
Senior Management and Legal Counsel/Advisor |
5 |
5 |
5 |
5 |
5 |
Investigative Services |
13 |
13 |
13 |
13 |
16 |
Administrative Services |
4 |
4 |
4 |
4 |
2 |
Total |
23 |
23 |
23 |
23 |
24 |
Source: Office of the Correctional Investigator.
Health care is the most common area of offender complaint received by the Office of the Correctional Investigator

Source: Office of the Correctional Investigator.
- There were 6,059 complaints/inquires* received at the Office of the Correctional Investigator in 2008-09.
- Health care (14.0%), institutional transfers (7.4%), and administrative segregation (7.0%) accounted for 28% of all complaints.
- The number of individual complaints processed by the OCI has decreased in recent years because the OCI has reallocated resources to sharpen its focus on systemic and death in custody investigations.
Note:
*The Office of the Correctional Investigator (OCI) may commence an investigation on receipt of a complaint by or on behalf of an offender or on its own initiative. Complaints are made by telephone, letter and during interviews with the OCI's investigative staff at federal correctional facilities. The dispositions in response to complaints involve a combination of internal responses (where the information or assistance sought by the offender can generally be provided by the OCI's investigative staff) and investigations (where, further to a review/analysis of law, policies and documentation, OCI investigative staff make an inquiry or several interventions with Correctional Service Canada and submit recommendations to address the complaint). Investigations vary considerably in terms of scope, complexity, duration and resources required.
Category of Complaint |
Number of Complaints* |
||||
|---|---|---|---|---|---|
2004-05 |
2005-06 |
2006-07 |
2007-08 |
2008-09 |
|
|
# |
# |
# |
# |
# |
Health Care |
891 |
913 |
916 |
849 |
851 |
Institutional Transfers |
653 |
613 |
610 |
555 |
447 |
Cell Property |
567 |
617 |
686 |
520 |
416 |
Administrative Segregation |
468 |
467 |
453 |
406 |
423 |
Case Preparation for Decisions |
348 |
410 |
429 |
379 |
257 |
Conditions of Confinement |
330 |
427 |
374 |
350 |
373 |
Staff Performance |
429 |
363 |
452 |
316 |
357 |
Visits |
467 |
384 |
357 |
315 |
311 |
File Information |
351 |
284 |
343 |
297 |
253 |
Grievance Procedures |
378 |
293 |
296 |
264 |
209 |
Financial Matters |
261 |
275 |
248 |
196 |
140 |
Telephone |
211 |
195 |
180 |
189 |
195 |
Programs |
220 |
291 |
239 |
180 |
186 |
Safety/Security of Offender |
215 |
199 |
167 |
176 |
165 |
Security Classification |
183 |
227 |
193 |
172 |
138 |
Employment |
104 |
149 |
146 |
100 |
101 |
Cell Placement |
93 |
118 |
128 |
79 |
43 |
Other** |
1,234 |
1,046 |
1,155 |
852 |
978 |
Outside OCI's Terms of Reference |
293 |
320 |
290 |
203 |
216 |
Total |
7,696 |
7,591 |
7,662 |
6,398 |
6,059 |
Source: Office of the Correctional Investigator.
Note:
*The Office of the Correctional Investigator (OCI) may commence an investigation on receipt of a complaint by or on behalf of an offender or on its own initiative. Complaints are made by telephone, letter and during interviews with the OCI's investigative staff at federal correctional facilities. The dispositions in response to complaints involve a combination of internal responses (where the information or assistance sought by the offender can generally be provided by the OCI's investigative staff) and investigations (where, further to a review/analysis of law, policies and documentation, OCI investigative staff make an inquiry or several interventions with Correctional Service Canada and submit recommendations to address the complaint). Investigations vary considerably in terms of scope, complexity, duration and resources required.
**Other refers to other types of complaints not specified in the table and includes Claims Against the Crown, Community Programs/Supervision, Correspondence, Death or Serious Injury, General Decision/Implementation, Diet, Discipline, Discrimination, Food Services, Harassment, Health and Safety/ Worksite, Ion Scan/Drug Dog, Mental Health, Methadone, Official Languages, Operation/Decisions of the OCI, Release Procedures, Request for Information, Search and Seizure, Sentence Administration/Calculation, Temporary Absence Decision, Urinalysis and Use of Force.
The number of individual complaints processed by the OCI has decreased in recent years because the OCI has reallocated resources to sharpen its focus on systemic and death in custody investigations.
Section C: Offender Population
Federal offenders under the jurisdiction of Correctional Service of Canada

Source: Correctional Service Canada.
Definitions:
Total Offender Population includes male and female federal offenders who are incarcerated (serving their sentences in federal or provincial institutions and those on temporary absence), offenders who are temporarily detained, actively supervised, on bail, escaped, unlawfully at large and those that have been deported.
Incarcerated includes male and female federal offenders serving their sentences in federal or provincial institutions.
Community Supervision includes federal offenders on day parole, full parole, statutory release, or in the community supervised on a long term supervision order, as well as those who are temporarily detained or paroled for deportation.
Actively Supervised includes federal offenders on day parole, full parole or statutory release, as well as those who are in the community on long-term supervision orders.
On Bail includes offenders on a judicial interim release; they have appealed their conviction or sentence and have been released to await the results of a new trial.
Temporarily Detained includes offenders who are physically held in a provincial detention centre or a federal institution after being suspended for a breach of a parole condition or to prevent a breach of parole conditions.
Deported includes offenders for whom a deportation order has been enforced by Citizenship and Immigration Canada.
Escaped includes offenders who have absconded from either a correctional facility or while on a temporary absence and whose whereabouts are unknown.
Unlawfully at Large includes offenders who have been released to the community on day parole, full parole, statutory release or a long term supervision order for whom a warrant for suspension has been issued, but has not yet been executed.
Status |
Federal Offenders |
|||
|---|---|---|---|---|
|
# |
|
% |
|
Incarcerated |
13, 286 |
|
58.4 |
|
On Bail |
72 |
|
0.3 |
|
Actively Supervised |
7,316 |
|
32.2 |
|
Day Parole |
|
1,013 |
|
4.5 |
Full Parole |
|
3,585 |
|
15.8 |
Statutory Release |
|
2,489 |
|
10.9 |
Long Term Supervision Order |
|
229 |
|
1.0 |
Temporarily Detained, while on: |
1,035 |
|
4.5 |
|
Day Parole |
|
127 |
|
0.6 |
Full Parole |
|
134 |
|
0.6 |
Statutory Release |
|
753 |
|
3.3 |
Long Term Supervision Order |
|
21 |
|
0.1 |
Deported |
365 |
|
1.6 |
|
Escaped |
130 |
|
0.6 |
|
Unlawfully At Large |
545 |
|
2.4 |
|
Total |
22,749 |
|
100.0 |
|
Source: Correctional Service Canada.
Note:
It is possible for an offender under federal jurisdiction to serve his or her sentence in a provincial institution. The data presented include these offenders as they are still under federal jurisdiction.
The number of incarcerated federal offenders decreased in 2008-09

Source: Correctional Service Canada.
- Following consecutive increases in the federal incarcerated offender population from 2004-05 to 2007-08, there was a decease in 2008-09.
- The provincial/territorial sentenced offender population in custody decreased from 1999-00 to 2007-08 while the remand population increased during this period. Since 2005-06, the number of remanded inmates exceeded the number of sentenced inmates in provincial/territorial custody.**
Note:
*The data reflect the number of offenders incarcerated at the end of each fiscal year. A fiscal year runs from April 1 to March 31 of the following year.
The term "incarcerated federal offenders" refers to those offenders serving a sentence of two years or more who are currently serving their sentence in a federal or provincial correctional facility. These numbers include those offenders who are in the community on some form of temporary absence at the time of the count. These numbers do not include those offenders who have had their supervision period suspended and are temporarily detained, those offenders who are on bail, or those offenders who have escaped and have not yet been recaptured at the time of the count.
**Source: Adult Correctional Services Survey - Corrections Key Indicator Report for Adults and Young Offenders, Canadian Centre for Justice Statistics, Statistics Canada
Year |
Incarcerated Offenders |
|||||
|---|---|---|---|---|---|---|
Provincial/Territorial2 |
Total |
|||||
Federal1 |
Sentenced |
Remand Other/ Temporary Detention |
Total |
|||
1999-00 |
12,816 |
11,436 |
6,664 |
531 |
18,631 |
31,447 |
2000-01 |
12,794 |
10,978 |
7,427 |
415 |
18,820 |
31,614 |
2001-02 |
12,663 |
10,956 |
7,972 |
334 |
19,262 |
31,925 |
2002-03 |
12,652 |
10,621 |
8,728 |
337 |
19,686 |
32,338 |
2003-04 |
12,413 |
9,863 |
9,163 |
342 |
19,368 |
31,781 |
2004-05 |
12,624 |
9,832 |
9,642 |
346 |
19,820 |
32,444 |
2005-06 |
12,671 |
9,618 |
10,879 |
332 |
20,829 |
33,500 |
2006-07 |
13,171 |
9,978 |
11,925 |
337 |
22,240 |
35,411 |
2007-08 |
13,581 |
9,750 |
12,888 |
387 |
23,026 |
36,607 |
2008-09 |
13,286 |
-- |
-- |
-- |
-- |
-- |
Source: 1Correctional Service Canada.; 2Adult Correctional Survey - Corrections Key Indicator Report for Adults and Young Offenders, Canadian Centre for Justice Statistics, Statistics Canada
Note:
Incarcerated includes male and female federal offenders serving their sentences in federal or provincial institutions.
The figures for federal offenders reflect yearly snapshots as of the last day of each fiscal year. A fiscal year runs from April 1 to March 31 of the following year.
The figures for provincial and territorial offenders reflect annual average counts.
-- Data not available.
The number of admissions to federal jurisdiction has decreased

Source: Correctional Service Canada.
- After peaking at 8,614 in 2006-07, the number of admissions has decreased by 4.5% to 8,226 in 2008-09.
- The number of warrant of committal admissions has fluctuated over the past decade, and decreased by 3.7% from 2007-08 to 2008-09.
- The number of women admitted to federal jurisdiction under warrants of committal increased from 236 in 2004-05 to 313 in 2008-09.
Note:
*"Other" includes transfers from other jurisdictions (exchange of services), terminations, transfers from foreign countries, and admissions where a release is interrupted as a consequence of a new conviction.
These numbers refer to the federal jurisdiction admissions during each fiscal year and may be greater than the actual number of offenders admitted, since an individual offender may be admitted more than once in a given year. A fiscal year runs from April 1 to March 31 of the following year.
|
2004-05 |
2005-06 |
2006-07 |
2007-08 |
2008-09 |
|||||
|---|---|---|---|---|---|---|---|---|---|---|
Women |
Men |
Women |
Men |
Women |
Men |
Women |
Men |
Women |
Men |
|
Warrant of Committal |
|
|||||||||
1st Federal Sentence |
216 |
3,025 |
239 |
3,160 |
276 |
3,407 |
274 |
3,356 |
278 |
3,272 |
All Others |
20 |
1,292 |
35 |
1,350 |
42 |
1,390 |
34 |
1,346 |
35 |
1,240 |
Subtotal |
236 |
4,317 |
274 |
4,510 |
318 |
4,797 |
308 |
4,702 |
313 |
4,512 |
Total |
4,553 |
4,784 |
5,115 |
5,010 |
4,825 |
|||||
Revocations |
153 |
3,090 |
162 |
3,125 |
156 |
3,219 |
147 |
3,237 |
167 |
3,065 |
Total |
3,243 |
3,287 |
3,375 |
3,384 |
3,232 |
|||||
Other* |
16 |
151 |
12 |
149 |
8 |
116 |
11 |
156 |
20 |
149 |
Total |
167 |
161 |
124 |
167 |
169 |
|||||
|
405 |
7,558 |
448 |
7,784 |
482 |
8,138 |
466 |
8,095 |
500 |
7,726 |
Total Admissions |
7,963 |
8,232 |
8,614 |
8,561 |
8,226 |
|||||
Source: Correctional Service Canada.
Note:
*"Other" includes transfers from other jurisdictions through exchange of services, terminations, transfers from foreign countries, and admissions where a release is interrupted as a consequence of a new conviction.
These numbers refer to the federal jurisdiction admissions during each fiscal year and may be greater than the actual number of offenders admitted, since an individual offender may be admitted more than once in a given year. A fiscal year runs from April 1 to March 31 of the following year.
The number of women admitted from the courts to federal jurisdiction has increased over the past decade

Source: Correctional Service Canada.
- In the last ten years, the number of women admitted to federal jurisdiction increased 37.9% from 227 in 1999-00 to 313 in 2008-09. During the same time period, there was an increase of 9.5% in the number of men admitted to federal jurisdiction.
- In the last three years, the number of women admitted to federal jurisdiction under warrants of committal has fluctuated little, between 308 and 318.
- Overall, women continue to represent a small proportion of the total number of admissions (i.e., 6.5% in 2008-09).
- As of April 12, 2009, there were 500 women incarcerated in Canada under federal jurisdiction.
Note:
A warrant of committal is a new admission to federal jurisdiction from the courts.
Year |
Warrant of Committal Admissions |
Total |
|||
|---|---|---|---|---|---|
Women |
Men |
||||
|
# |
% |
# |
% |
|
1999-00 |
227 |
5.2 |
4,122 |
94.8 |
4,349 |
2000-01 |
231 |
5.4 |
4,044 |
94.6 |
4,275 |
2001-02 |
202 |
4.9 |
3,914 |
95.1 |
4,116 |
2002-03 |
204 |
4.8 |
4,070 |
95.2 |
4,274 |
2003-04 |
237 |
5.6 |
3,990 |
94.4 |
4,227 |
2004-05 |
236 |
5.2 |
4,317 |
94.8 |
4,553 |
2005-06 |
274 |
5.7 |
4,510 |
94.3 |
4,784 |
2006-07 |
318 |
6.2 |
4,797 |
93.8 |
5,115 |
2007-08 |
308 |
6.1 |
4,702 |
93.9 |
5,010 |
2008-09 |
313 |
6.5 |
4,512 |
93.5 |
4,825 |
Source: Correctional Service Canada.
Note:
A warrant of committal is a new admission to federal jurisdiction from the courts.
Offender age at admission to federal jurisdiction is increasing
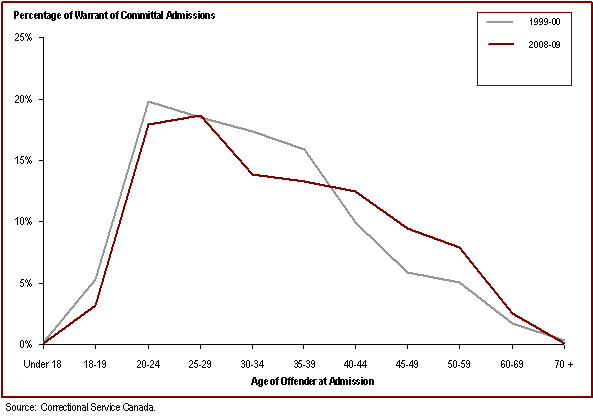
Source: Correctional Service Canada.
- In 2008-09, 36.5% of offenders admitted to federal jurisdiction were between the ages of 20 and 29, and 27.2% were between 30 and 39 years of age.
- The distribution of age upon admission is similar for both men and women.
- The median age of the population upon admission has increased from 31 in 1999-00 to 33 in 2008-09.
- The number of offenders between the ages of 40 and 49 at admission has increased from 686 (15.8%) in 1999-00 to 1,056 (21.9%) in 2008-09, whereas the number of offenders between the ages of 30 and 34 decreased from 754 (17.3%) in 1999-00 to 670 (13.9%) in 2008-09.
Note:
A warrant of committal is a new admission to federal jurisdiction from the courts.
Age at Admission |
1999-00 |
2008-09 |
||||||||||
|---|---|---|---|---|---|---|---|---|---|---|---|---|
Women |
Men |
Total |
Women |
Men |
Total |
|||||||
|
# |
% |
# |
% |
# |
% |
# |
% |
# |
% |
# |
% |
Under 18 |
1 |
0.4 |
8 |
0.2 |
9 |
0.2 |
0 |
0.0 |
3 |
0.1 |
3 |
0.1 |
18 and 19 |
15 |
6.6 |
216 |
5.2 |
231 |
5.3 |
9 |
2.9 |
145 |
3.2 |
154 |
3.2 |
20 to 24 |
43 |
18.9 |
818 |
19.8 |
861 |
19.8 |
41 |
13.1 |
821 |
18.2 |
862 |
17.9 |
25 to 29 |
51 |
22.5 |
755 |
18.3 |
806 |
18.5 |
54 |
17.3 |
844 |
18.7 |
898 |
18.6 |
30 to 34 |
34 |
15.0 |
720 |
17.5 |
754 |
17.3 |
61 |
19.5 |
609 |
13.5 |
670 |
13.9 |
35 to 39 |
41 |
18.1 |
650 |
15.8 |
691 |
15.9 |
42 |
13.4 |
601 |
13.3 |
643 |
13.3 |
40 to 44 |
21 |
9.3 |
410 |
9.9 |
431 |
9.9 |
50 |
16.0 |
554 |
12.3 |
604 |
12.5 |
45 to 49 |
12 |
5.3 |
243 |
5.9 |
255 |
5.9 |
27 |
8.6 |
425 |
9.4 |
452 |
9.4 |
50 to 59 |
6 |
2.6 |
215 |
5.2 |
221 |
5.1 |
25 |
8.0 |
356 |
7.9 |
381 |
7.9 |
60 to 69 |
3 |
1.3 |
72 |
1.7 |
75 |
1.7 |
4 |
1.3 |
120 |
2.7 |
124 |
2.6 |
70 and over |
0 |
0.0 |
15 |
0.4 |
15 |
0.3 |
0 |
0.0 |
34 |
0.8 |
34 |
0.7 |
Total |
227 |
4,122 |
4,349 |
313 |
4,512 |
4,825 |
||||||
Source: Correctional Service Canada.
Note:
A warrant of committal is a new admission to federal jurisdiction from the courts.
Due to rounding, percentages may not add to 100 percent.
The average age at admission is lower for Aboriginal offenders than for non-Aboriginal offenders
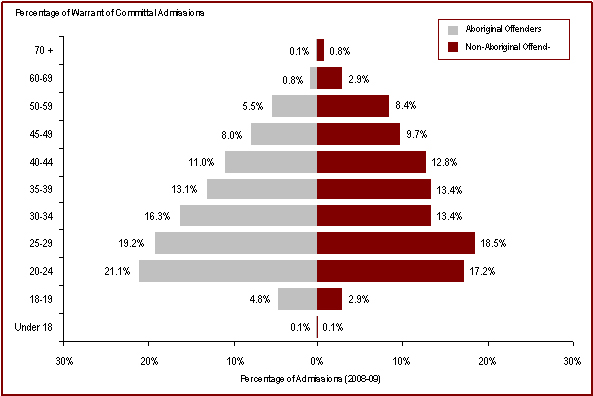
Source: Correctional Service Canada.
- Of those offenders admitted to federal jurisdiction in 2008-09, 45.2% of Aboriginal offenders were under the age of 30, compared to 38.6% of non-Aboriginal offenders.
- The median age of Aboriginal offenders at admission is 31, compared to a median age of 34 for non-Aboriginal offenders.
Note:
A warrant of committal is a new admission to federal jurisdiction from the courts.
Age at Admission |
1999-00 |
2008-09 |
||||||||||
|---|---|---|---|---|---|---|---|---|---|---|---|---|
Aboriginal |
Non-Aboriginal |
Total |
Aboriginal |
Non-Aboriginal |
Total |
|||||||
|
# |
% |
# |
% |
# |
% |
# |
% |
# |
% |
# |
% |
Under 18 |
6 |
0.8 |
3 |
0.1 |
9 |
0.2 |
1 |
0.1 |
2 |
0.1 |
3 |
0.1 |
18 and 19 |
56 |
7.3 |
175 |
4.9 |
231 |
5.3 |
40 |
4.8 |
114 |
2.9 |
154 |
3.2 |
20 to 24 |
199 |
25.8 |
662 |
18.5 |
861 |
19.8 |
178 |
21.1 |
684 |
17.2 |
862 |
17.9 |
25 to 29 |
163 |
21.2 |
643 |
18.0 |
806 |
18.5 |
162 |
19.2 |
736 |
18.5 |
898 |
18.6 |
30 to 34 |
114 |
14.8 |
640 |
17.9 |
754 |
17.3 |
137 |
16.3 |
533 |
13.4 |
670 |
13.9 |
35 to 39 |
114 |
14.9 |
577 |
16.1 |
691 |
15.9 |
110 |
13.1 |
533 |
13.4 |
643 |
13.3 |
40 to 44 |
58 |
7.5 |
373 |
10.4 |
431 |
9.9 |
93 |
11.0 |
511 |
12.8 |
604 |
12.5 |
45 to 49 |
36 |
4.7 |
219 |
6.1 |
255 |
5.9 |
67 |
8.0 |
385 |
9.7 |
452 |
9.4 |
50 to 59 |
18 |
2.3 |
203 |
5.7 |
221 |
5.1 |
46 |
5.5 |
335 |
8.4 |
381 |
7.9 |
60 to 69 |
5 |
0.6 |
70 |
2.0 |
75 |
1.7 |
7 |
0.8 |
117 |
2.9 |
124 |
2.6 |
70 and over |
1 |
0.1 |
14 |
0.4 |
15 |
0.3 |
1 |
0.1 |
33 |
0.8 |
34 |
0.7 |
Total |
770 |
3,579 |
4,349 |
842 |
3,983 |
4,825 |
||||||
Source: Correctional Service Canada.
Note:
A warrant of committal is a new admission to federal jurisdiction from the courts.
Due to rounding, percentages may not add to 100 percent.
18% of the federal incarcerated offender population is age 50 or over
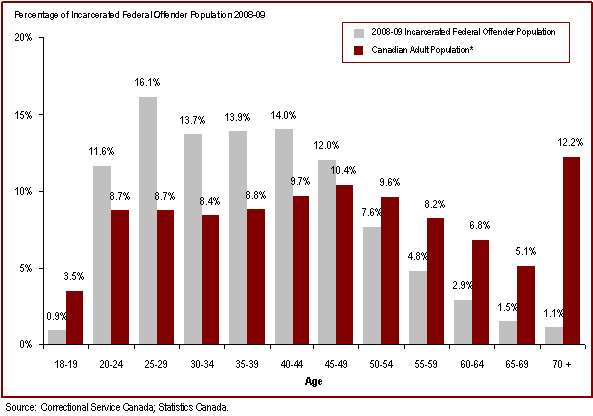
Source: Correctional Service Canada; Statistics Canada.
- In 2008-09, 56.1% of incarcerated offenders were under the age of 40 while 38.7% of the Canadian population was under the age of 40.
- In 2008-09, 17.9% of the incarcerated federal offender population was aged 50 and over, while 41.9% of the Canadian population was aged 50 and over.
- The community federal offender population was older than the incarcerated population; 28.9% of offenders in the community were aged 50 and over, compared to 17.9% of the incarcerated offenders in this age group.
Note:
*Preliminary Postcensal Estimates, July 1, 2008; Demography Division, Statistics Canada.
Incarcerated includes male and female federal offenders serving their sentences in federal or provincial institutions, as well as those on temporary absence.
Age |
Incarcerated |
Community |
Total |
% of Canadian Adult Population |
|||
|---|---|---|---|---|---|---|---|
|
# |
% |
# |
% |
# |
% |
% |
Under 18 |
2 |
0.0 |
0 |
0.0 |
2 |
0.0 |
-- |
18 and 19 |
115 |
0.9 |
11 |
0.1 |
126 |
0.6 |
3.5 |
20 to 24 |
1,536 |
11.6 |
664 |
7.6 |
2,220 |
10.0 |
8.7 |
25 to 29 |
2,140 |
16.1 |
1,134 |
13.0 |
3,274 |
14.9 |
8.7 |
30 to 34 |
1,818 |
13.7 |
1,115 |
12.8 |
2,933 |
13.3 |
8.4 |
35 to 39 |
1,842 |
13.9 |
1,062 |
12.2 |
2,904 |
13.2 |
8.8 |
40 to 44 |
1,863 |
14.0 |
1,116 |
12.8 |
2,979 |
13.5 |
9.7 |
45 to 49 |
1,591 |
12.0 |
1,097 |
12.6 |
2,688 |
12.2 |
10.4 |
50 to 54 |
1,012 |
7.6 |
813 |
9.3 |
1,825 |
8.3 |
9.6 |
55 to 59 |
635 |
4.8 |
651 |
7.5 |
1,286 |
5.8 |
8.2 |
60 to 64 |
381 |
2.9 |
465 |
5.3 |
846 |
3.8 |
6.8 |
65 to 69 |
203 |
1.5 |
291 |
3.3 |
494 |
2.2 |
5.1 |
70 and over |
148 |
1.1 |
297 |
3.4 |
445 |
2.0 |
12.2 |
Total |
13,286 |
100.0 |
8,716 |
100.0 |
22,002 |
100.0 |
100.0 |
Source: Correctional Service Canada; Statistics Canada.
Note:
*Preliminary Postcensal Estimates, July 1, 2008; Demography Division, Statistics Canada.
Incarcerated includes male and female federal offenders serving their sentences in federal or provincial institutions, and those on temporary absence.
Community supervision includes federal offenders on day parole, full parole, statutory release or in the community supervised on a long term supervision order, as well as those who are temporarily detained or paroled for deportation.
The data presented is a snapshot of the offender population as of April 12, 2009.
Due to rounding, percentages may not add to 100.0.
67% of federal offenders are Caucasian
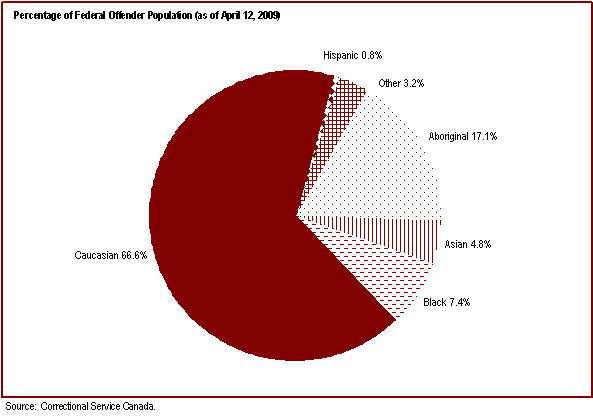
Source: Correctional Service Canada.
- The federal offender population is diverse; however, 66.6% of offenders identify themselves as Caucasian.
- Since 2003-04, the Aboriginal population has increased from 3,474 to 3,894.
Note:
These data are self-identified by offenders while they are incarcerated, and the categories are not comprehensive; therefore, the reader should interpret these data with caution.
"Aboriginal" includes offenders who are Inuit, Innu, Métis and North American Indian.
"Asian" includes offenders who are Arab, West Indian, Asiatic, Chinese, East Indian, Filipino, Japanese, Korean, South East Asian and South Asian.
"Hispanic" includes offenders who are Hispanic and Latin American.
The data reflects the total offender population, which includes male and female federal offenders who are incarcerated (serving their sentences in federal or provincial institutions, and those on temporary absence), offenders who are on community supervision, on bail, escaped and unlawfully at large. Community supervision includes federal offenders on day parole, full parole, statutory release, or in the community supervised on a long term supervision order, as well as those who are temporarily detained or paroled for deportation.
Offender Population |
||||
|---|---|---|---|---|
|
2003-04 |
2008-09 |
||
|
# |
% |
# |
% |
Aboriginal |
3,474 |
16.1 |
3,894 |
17.1 |
Inuit |
118 |
0.5 |
163 |
0.7 |
Métis |
948 |
4.4 |
1,035 |
4.5 |
North American Indian |
2,408 |
11.2 |
2,696 |
11.9 |
Asian |
878 |
4.1 |
1,097 |
4.8 |
Arab/West Asian |
133 |
0.6 |
213 |
0.9 |
Asiatic |
210 |
1.0 |
107 |
0.5 |
Chinese |
113 |
0.5 |
140 |
0.6 |
East Indian |
51 |
0.2 |
32 |
0.1 |
Filipino |
40 |
0.2 |
56 |
0.2 |
Japanese |
9 |
0.0 |
7 |
0.0 |
Korean |
15 |
0.1 |
12 |
0.1 |
South East Asian |
205 |
0.9 |
346 |
1.5 |
South Asian |
102 |
0.5 |
184 |
0.8 |
Black |
1,387 |
6.4 |
1,684 |
7.4 |
Caucasian |
15,138 |
70.1 |
15,157 |
66.6 |
Hispanic |
121 |
0.6 |
188 |
0.8 |
Hispanic |
38 |
0.2 |
19 |
0.1 |
Latin American |
83 |
0.4 |
169 |
0.7 |
Other/Unknown |
584 |
2.7 |
729 |
3.2 |
Total |
21,582 |
100.0 |
22,749 |
100.0 |
Source: Correctional Service Canada.
Note:
The data reflects the total offender population, which includes male and female federal offenders who are incarcerated (serving their sentences in federal or provincial institutions and those on temporary absence), offenders who are on community supervision, on bail, escaped and unlawfully at large. Community supervision includes federal offenders on day parole, full parole, statutory release, or in the community supervised on a long term supervision order, as well as those who are temporarily detained or paroled for deportation.
These data are self-identified by offenders while they are incarcerated, and the categories are not comprehensive; therefore, the reader should interpret these data with caution.
The data reflect the number of offenders active at the end of each fiscal year. A fiscal year runs from April 1 to March 31 of the following year.
Due to rounding, percentages may not add to 100.0.
The religious identification of the offender population is diverse

Source: Correctional Service Canada.
- The religious identification of the current federal offender population is diverse. The two most frequently declared religions are Catholic (39.2%), and Protestant (20.0%).
- Religious identification is unknown for 7.5% of offenders, whereas 15.2% stated they have no religion.
Note:
Religious identification is self-declared by offenders while they are incarcerated, and the categories are not comprehensive; therefore, the reader should interpret these data with caution.
Catholic includes offenders who are Catholic, Roman-Catholic, Greek-Catholic, Native-Catholic and Ukrainian-Catholic.
Orthodox includes offenders who are Greek Orthodox, Russian Orthodox and Ukrainian Orthodox.
Protestant includes offenders who are Anglican, Baptist, Christian Missionary, Christian Reform, Hutterite, Lutheran, Mennonite, Moravian, Native Spirit Protestant, Pentecostal, Presbyterian, Protestant, Salvation Army, Seventh Day Adventist, United Church, Christ Methodist, Christ Wesleyan and Worldwide Church.
Other includes other declared identifications such as Agnostic, Atheist, Baha'i, Christian Science, Hindu, Jehovah's Witness, Mormon, Rastafarian, Scientology, Siddha Yoga, Taoism, Pagan, Sufiism, Wicca and Zoroastrian.
The data reflect the total offender population, which includes federal offenders who are incarcerated (serving their sentences in federal or provincial institutions, and those on temporary absence) and federal offenders who are on community supervision, on bail, escaped and unlawfully at large. Community supervision includes federal offenders on day parole, full parole, statutory release, or in the community supervised on a long term supervision order, as well as those who are temporarily detained or paroled for deportation.
Offender Population |
||||
|---|---|---|---|---|
|
2003-04 |
2008-09 |
||
|
# |
% |
# |
% |
Catholic |
9,304 |
43.1 |
8,916 |
39.2 |
Protestant |
4,557 |
21.1 |
4,555 |
20.0 |
Muslim |
758 |
3.5 |
919 |
4.0 |
Native Spirituality |
682 |
3.2 |
844 |
3.7 |
Buddhist |
381 |
1.8 |
402 |
1.8 |
Jewish |
156 |
0.7 |
168 |
0.7 |
Orthodox |
107 |
0.5 |
105 |
0.5 |
Sikh |
88 |
0.4 |
141 |
0.6 |
Other |
1,449 |
6.7 |
1,516 |
6.7 |
None |
2,911 |
13.5 |
3,468 |
15.2 |
Unknown |
1,189 |
5.5 |
1,715 |
7.5 |
Total |
21,582 |
100.0 |
22,749 |
100.0 |
Source: Correctional Service Canada.
Note:
Religious identification is self-declared by offenders while they are incarcerated, and the categories are not comprehensive; therefore, the reader should interpret these data with caution.
The data reflect the total offender population, which includes federal offenders who are incarcerated (serving their sentences in federal or provincial institutions, and those on temporary absence) and federal offenders who are on community supervision, on bail, escaped and unlawfully at large. Community supervision includes federal offenders on day parole, full parole, statutory release, or in the community supervised on a long term supervision order, as well as those who are temporarily detained or paroled for deportation.
The data reflect the number of offenders active at the end of each fiscal year. A fiscal year runs from April 1 to March 31 of the following year.
Due to rounding, percentages may not add to 100.0.
11% of federal offenders have a mental health diagnosis at admission
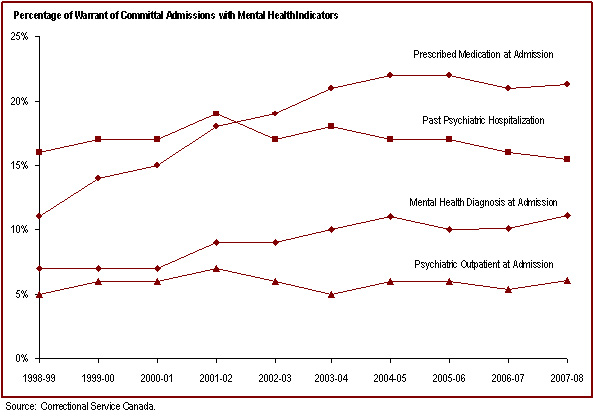
Source: Correctional Service Canada.
- The percentage of offenders committed to federal jurisdiction with a mental health diagnosis at time of admission is increasing.
- In 2007-08, 11.1% of offenders committed to federal jurisdiction had a mental health diagnosis at time of admission and 6.1% were receiving outpatient services prior to admission.
- In 2007-08, 30.1% of female offenders compared to 14.5% of male offenders had previously been hospitalized for psychiatric reasons.
- The percentage of federally incarcerated offenders prescribed medication for psychiatric concerns at admission has almost doubled from 11.0% in 1998-99 to 21.3% in 2007-08.
- Female offenders are twice as likely as male offenders to have a mental health diagnosis at time of admission.
Note:
Data are from the Correctional Service of Canada's Offender Intake Assessment process, where all new admissions are screened at intake.
The percentage is taken from answers "Yes" and "No" to the Mental Health Indicator at time of admission. The unknown and the blank answers are not taken into consideration in the denominator.
These statistics were previously reported in the 2008 Corrections and Conditional Release Statistical Overview. No new data are available.
Mental Health Indicator At Time of Admission |
Women |
Men |
Total |
|||
|---|---|---|---|---|---|---|
# |
% |
# |
% |
# |
% |
|
Diagnosis |
52 |
21.8 |
394 |
10.4 |
446 |
11.1 |
Prescribed Psychiatric Medication |
78 |
33.2 |
772 |
20.6 |
850 |
21.3 |
Past Psychiatric Hospitalization |
72 |
30.1 |
547 |
14.5 |
619 |
15.5 |
Psychiatric Outpatient |
21 |
8.7 |
225 |
5.9 |
246 |
6.1 |
Source: Correctional Service Canada.
Note:
Data are from the Correctional Service of Canada's Offender Intake Assessment process, where all new admissions are screened at intake.
The percentage is taken from answers "Yes" and "No" to the Mental Health Indicator at time of admission. The unknown and the blank answers are not taken into consideration in the denominator.
These statistics were previously reported in the 2008 Corrections and Conditional Release Statistical Overview. No new data are available.
The proportion of Aboriginal offenders incarcerated is higher than for non-Aboriginal offenders

Source: Correctional Service Canada.
- As of April 12, 2009, the proportion of offenders incarcerated was about 10% greater for Aboriginal offenders (69.1%) than for non-Aboriginal offenders (58.6%).
- Aboriginal women represent 31.4% of all incarcerated women while Aboriginal men represent 19.2% of incarcerated men.
- In 2008-09, Aboriginal offenders represented 17.2% of the total federal offender population while Aboriginal adults represent 4.0% of the Canadian adult population*.
- Aboriginal offenders accounted for 19.7% of the incarcerated population and 13.4% of the community population in 2008-09.
Note:
*2006 Census, Statistics Canada.
Incarcerated includes male and female federal offenders serving their sentences in federal or provincial institutions.
The data reflect the number of offenders active at the end of each fiscal year. A fiscal year runs from April 1 to March 31 of the following year.
|
Incarcerated |
Community |
Total |
|||
|---|---|---|---|---|---|---|
|
# |
% |
# |
% |
|
|
Men |
||||||
2005-06 |
Aboriginal |
2,245 |
68.3 |
1,041 |
31.7 |
3,286 |
|
Non-Aboriginal |
10,018 |
59.5 |
6,824 |
40.5 |
16,842 |
|
Total |
12,263 |
60.9 |
7,865 |
39.1 |
20,128 |
2006-07 |
Aboriginal |
2,432 |
71.1 |
989 |
28.9 |
3,421 |
|
Non-Aboriginal |
10,263 |
59.6 |
6,944 |
40.4 |
17,207 |
|
Total |
12,695 |
61.5 |
7,933 |
38.5 |
20,628 |
2007-08 |
Aboriginal |
2,493 |
70.7 |
1,031 |
29.3 |
3,524 |
|
Non-Aboriginal |
10,593 |
60.8 |
6,842 |
39.2 |
17,435 |
|
Total |
13,086 |
62.4 |
7,873 |
37.6 |
20,959 |
2008-09 |
Aboriginal |
2,460 |
69.9 |
1,058 |
30.1 |
3,518 |
|
Non-Aboriginal |
10,326 |
59.3 |
7,083 |
40.7 |
17,409 |
|
Total |
12,786 |
61.1 |
8,141 |
38.9 |
20,927 |
Women |
||||||
2005-06 |
Aboriginal |
128 |
56.1 |
100 |
43.9 |
228 |
|
Non-Aboriginal |
280 |
41.2 |
400 |
58.8 |
680 |
|
Total |
408 |
44.9 |
500 |
55.1 |
908 |
2006-07 |
Aboriginal |
148 |
59.0 |
103 |
41.0 |
251 |
|
Non-Aboriginal |
328 |
44.4 |
410 |
55.6 |
738 |
|
Total |
476 |
48.1 |
513 |
51.9 |
989 |
2007-08 |
Aboriginal |
164 |
58.8 |
115 |
41.2 |
279 |
|
Non-Aboriginal |
331 |
42.6 |
446 |
57.4 |
777 |
|
Total |
495 |
46.9 |
561 |
53.1 |
1,056 |
2008-09 |
Aboriginal |
157 |
58.1 |
113 |
41.9 |
270 |
|
Non-Aboriginal |
343 |
42.6 |
462 |
57.4 |
805 |
|
Total |
500 |
46.5 |
575 |
53.5 |
1,075 |
Source: Correctional Service Canada.
Note:
Incarcerated includes male and female federal offenders serving their sentences in federal or provincial institutions.
Community supervision includes federal offenders on day parole, full parole, statutory release, or in the community supervised on a long term supervision order, as well as those who are temporarily detained or paroled for deportation.
The data reflect the number of offenders active at the end of each fiscal year. A fiscal year runs from April 1 to March 31 of the following year.
The majority of incarcerated federal offenders are classified as medium security risk

Source: Correctional Service Canada.
- Approximately two-thirds (65.2%) of federal offenders are classified as medium security risk.
- Compared to non-Aboriginal offenders, a lower percentage of Aboriginal offenders are classified as minimum security risk (14.4% vs. 20.6%) and a higher percentage are classified as medium (67.5% vs. 64.6%) and maximum (18.1% vs. 14.8%) security risk.
Note:
The data represent the offender security level decision, as of April 12, 2009.
Security Risk Level |
Aboriginal |
Non-Aboriginal |
Total |
|||
|---|---|---|---|---|---|---|
# |
% |
# |
% |
# |
% |
|
Minimum |
360 |
14.4 |
2,054 |
20.6 |
2,414 |
19.4 |
Medium |
1,685 |
67.5 |
6,424 |
64.6 |
8,109 |
65.2 |
Maximum |
453 |
18.1 |
1,470 |
14.8 |
1,923 |
15.5 |
Total |
2,498 |
100.0 |
9,948 |
100.0 |
1,246 |
100.0 |
Not Yet Determined* |
119 |
|
721 |
|
840 |
|
Total |
2,617 |
10,669 |
13,286 |
|||
Source: Correctional Service Canada.
Note:
*The "not yet determined" category includes offenders who have not yet been classified.
The data represent the offender security level decision, as of April 12, 2009.
Incarcerated offenders include male and female federal offenders serving their sentences in federal or provincial institutions, as well as those on temporary absence.
Admissions with a life or indeterminate sentence decreased in 2008-09

Source: Correctional Service Canada.
- From 1999-00 to 2008-09, the number of admissions to federal jurisdiction with a life/indeterminate* sentence fluctuated between 162 and 178.
- As of April 12, 2009, there were a total of 3,070 offenders incarcerated with a life/indeterminate sentence. Of these, 2,990 (97.4%) were men and 80 (2.6%) were women; 586 (19.1%) were Aboriginal and 2,484 (80.9%) were non-Aboriginal.
- As of April 12, 2009, 22.3% of the total federal population was serving a life/indeterminate sentence. Of these offenders, 62.5% were incarcerated and 37.5% were supervised in the community.
Note:
*Although life sentences and indeterminate sentences both may result in imprisonment for life, they are different. A life sentence is a sentence of life imprisonment, imposed by a judge at the time of sentence, for example for murder. An indeterminate sentence is a result of a designation, where an application is made to the court to declare an offender a Dangerous Offender, and the consequence of this designation is imprisonment for an indeterminate period.
A warrant of committal is a new admission to federal jurisdiction from the courts.
Year |
Aboriginal Offenders |
Non-Aboriginal Offenders |
Total |
||||||
|---|---|---|---|---|---|---|---|---|---|
Women |
Men |
Total |
Women |
Men |
Total |
Women |
Men |
Total |
|
1999-00 |
4 |
27 |
31 |
4 |
128 |
132 |
8 |
155 |
163 |
2000-01 |
2 |
31 |
33 |
8 |
124 |
132 |
10 |
155 |
165 |
2001-02 |
2 |
31 |
33 |
4 |
121 |
125 |
6 |
152 |
158 |
2002-03 |
1 |
34 |
35 |
3 |
111 |
114 |
4 |
145 |
149 |
2003-04 |
0 |
18 |
18 |
2 |
120 |
122 |
2 |
138 |
140 |
2004-05 |
1 |
22 |
23 |
5 |
119 |
124 |
6 |
141 |
147 |
2005-06 |
4 |
38 |
42 |
8 |
124 |
132 |
12 |
162 |
174 |
2006-07 |
4 |
33 |
37 |
11 |
125 |
136 |
15 |
158 |
173 |
2007-08 |
4 |
27 |
31 |
3 |
144 |
147 |
7 |
171 |
178 |
2008-09 |
3 |
30 |
33 |
2 |
127 |
129 |
5 |
157 |
162 |
Source: Correctional Service Canada.
Note:
This table combines offenders serving life sentences and offenders serving indeterminate sentences.
Although life sentences and indeterminate sentences both may result in imprisonment for life, they are different. A life sentence is a sentence of life Imprisonment, imposed by a judge at the time of sentence, for example for murder. An indeterminate sentence is a result of a designation, where an application is made to the court to declare an offender a Dangerous Offender, and the consequence of this designation is imprisonment for an indeterminate period.
Offenders with Life or Indeterminate sentences represent 22% of the total offender population
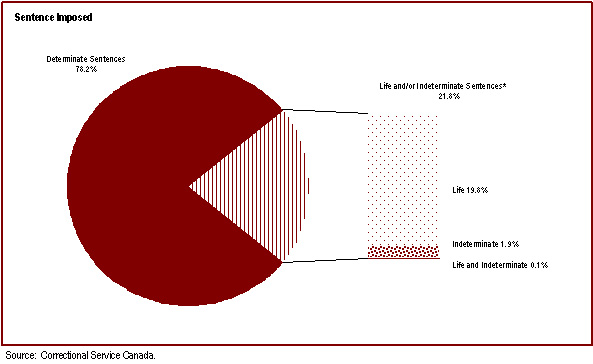
Source: Correctional Service Canada.
- As of April 12, 2009, there were 4,955 offenders serving a life sentence and/or an indeterminate sentence. This represents 21.8% of the total offender population. The majority (62.7%) of these offenders were in custody. Of the 1,850 offenders who were being supervised in the community, the majority (80.5%) are serving a life sentence for 2nd Degree Murder.
- There are 20 offenders who are serving both a life sentence and an indeterminate sentence*. There are 440 offenders who are serving not only an indeterminate sentence as a result of a special designation, but also a determinate sentence for their crimes. The remaining 4,495 offenders have not received a special designation, but are serving a life sentence.
- 95.9% of the 392 Dangerous Offenders with indeterminate sentences were incarcerated and 4.1% were supervised in the community. In contrast, 48.8% of the 41 Dangerous Sexual Offenders and none of the 9 Habitual Offenders were incarcerated.
Note:
*Although life sentences and indeterminate sentences may both result in imprisonment for life, they are different. A life sentence is a sentence of life imprisonment, imposed by a judge at the time of sentence, for example for murder. An indeterminate sentence is a result of a designation, where an application is made to the court to declare an offender a Dangerous Offender, and the consequence of this designation is imprisonment for an indeterminate period. The Dangerous Sexual Offender and Habitual Offender designations were replaced with Dangerous Offender Legislation in 1977.
|
Offenders under |
Current Status |
||||
|---|---|---|---|---|---|---|
Custody |
Community |
|||||
Incarcerated |
Day Parole |
Full Parole |
Other*** |
|||
|
# |
% |
|
|
|
|
Offenders with a life sentence for: |
||||||
1st Degree Murder |
983 |
4.3 |
781 |
41 |
150 |
11 |
2nd Degree Murder |
3,292 |
14.5 |
1,802 |
199 |
1,152 |
139 |
Other Offences* |
220 |
1.0 |
109 |
12 |
78 |
21 |
Total |
4,495 |
19.8 |
2,692 |
252 |
1,380 |
171 |
Offenders with indeterminate sentences resulting from the special designation of: |
||||||
Dangerous Offender |
392 |
1.7 |
376 |
4 |
11 |
1 |
Dangerous Sexual Offender |
40 |
0.2 |
20 |
2 |
16 |
2 |
Habitual Offenders |
8 |
0.0 |
0 |
0 |
3 |
5 |
Total |
440 |
1.9 |
396 |
6 |
30 |
8 |
Offenders serving an indeterminate sentence (due to a special designation) and a life sentence (due to an offence) |
||||||
|
20 |
0.1 |
17 |
0 |
2 |
1 |
Total offenders with Life and/or Indeterminate sentence |
4,955 |
21.8 |
3,105 |
258 |
1,412 |
180 |
Offenders Serving Determinate sentences** |
17,794 |
78.2 |
11,216 |
755 |
2,173 |
3,650 |
Total |
22,749 |
100.0 |
14,321 |
1,013 |
3,585 |
3,830 |
Source: Correctional Service Canada.
Note:
*Other offences include Schedule 1, Schedule 2 and Non-Schedule types of offences.
**This includes four offenders designated as Dangerous Offenders who are serving determinate sentences.
***Other in the Community includes federal offenders on bail, statutory release, on a long term supervision order, deported, have escaped, or are unlawfully at large. As offenders serving a life or indeterminate sentence are ineligible for Statutory Release, this includes a total of 136 offenders who have been deported, four on bail, 12 escapes, and 28 unlawfully at large.
Offenders in custody include offenders who are temporarily detained and presently in custody.
Among the 20 offenders serving an indeterminate sentence (due to a special designation) and a life sentence (due to an offence), there is one Dangerous Sexual Offender and one Habitual Offender.
One offender who received a Dangerous Offender designation on April 3, 2009, is not represented in the above table (C14).
69% of federal offenders are serving a sentence for a violent offence*

Source: Correctional Service Canada.
- As of April 12, 2009, a greater proportion of Aboriginal offenders than non-Aboriginal offenders were serving a sentence for a violent offence (80.1% versus 66.1%, respectively).
- 73.0% of Aboriginal women offenders were serving a sentence for a violent offence compared to 45.8% of non-Aboriginal women offenders.
- Of those offenders serving a sentence for Murder, 3.9% were women and 16.5% were Aboriginal.
- A greater proportion of Aboriginal offenders than non-Aboriginal offenders were serving a sentence for a Schedule I offence (61.9% versus 47.1%, respectively).
- 7.0% of Aboriginal offenders were serving a sentence for a Schedule II offence compared to 19.1% of non-Aboriginal offenders.
- 31.3% of women were serving a sentence for a Schedule II offence compared to 16.3% for men.
Note:
*Violent offence includes Murder I, Murder II and Schedule I offences.
Schedule I is comprised of sexual offences and other violent crimes excluding first and second degree murder (see the Corrections and Conditional Release Act).
Schedule II is comprised of serious drug offences or conspiracy to commit serious drug offences (see the Corrections and Conditional Release Act).
In cases where the offender is serving a sentence for more than one offence, the data reflect the most serious offence.
Offence Category |
Aboriginal |
Non-Aboriginal |
Total |
||||||
|---|---|---|---|---|---|---|---|---|---|
Women |
Men |
Total |
Women |
Men |
Total |
Women |
Men |
Total |
|
Murder I |
3 |
140 |
143 |
25 |
831 |
856 |
28 |
971 |
999 |
Percent |
1.1 |
3.9 |
3.7 |
3.0 |
4.6 |
4.5 |
2.5 |
4.5 |
4.4 |
Murder II |
38 |
528 |
566 |
103 |
2,638 |
2,741 |
141 |
3,166 |
3,307 |
Percent |
13.7 |
14.6 |
14.5 |
12.3 |
14.6 |
14.5 |
12.6 |
14.6 |
14.5 |
Schedule I |
162 |
2,248 |
2,410 |
257 |
8,617 |
8,874 |
419 |
10,865 |
11,284 |
Percent |
58.3 |
62.2 |
61.9 |
30.6 |
47.8 |
47.1 |
37.5 |
50.2 |
49.6 |
Schedule II |
51 |
221 |
272 |
299 |
3,305 |
3,604 |
350 |
3,526 |
3,876 |
Percent |
18.3 |
6.1 |
7.0 |
35.6 |
18.3 |
19.1 |
31.3 |
16.3 |
17.0 |
Non-Schedule |
24 |
479 |
503 |
156 |
2,624 |
2,780 |
180 |
3,103 |
3,283 |
Percent |
8.6 |
13.2 |
12.9 |
18.6 |
14.6 |
14.7 |
16.1 |
14.3 |
14.4 |
Total |
278 |
3,616 |
|
840 |
18,015 |
|
1,118 |
21,631 |
|
|
3,894 |
|
18,885 |
|
22,749 |
|
|||
Source: Correctional Service Canada.
Note:
*Violent offence includes Murder I, Murder II and Schedule I offences.
Schedule I is comprised of sexual offences and other violent crimes excluding first and second degree murder (see the Corrections and Conditional Release Act).
Schedule II comprises serious drug offences or conspiracy to commit serious drug offences (see the Corrections and Conditional Release Act).
The data reflect the total offender population, which includes male and female federal offenders who are incarcerated (serving their sentences in federal or provincial institutions, and those on temporary absence), offenders who are on community supervision, on bail, escaped and unlawfully at large. Community supervision includes federal offenders on day parole, full parole, statutory release, or in the community supervised on a long term supervision order, as well as those who are temporarily detained or paroled for deportation.
These figures are based on the offender population as of April 12, 2009.
The number of aboriginal offenders under federal jurisdiction is increasing

Source: Correctional Service Canada.
- From 1999-00 to 2008-09, the Aboriginal incarcerated population under federal jurisdiction increased by 20.1%.
- The number of incarcerated Aboriginal women increased steadily from 84 in 1999-00 to 157 in 2008-09, an increase of 86.9% in the last ten years. The increase for incarcerated Aboriginal men was 17.4% for the same period, increasing from 2,095 to 2,460.
- From 1999-00 to 2008-09, the number of Aboriginal offenders on community supervision increased 13.1%, from 1,035 to 1,171. The Aboriginal community population accounted for 13.4% of the total community population in 2008-09.
Note:
*Incarcerated includes male and female federal offenders serving their sentences in federal or provincial institutions.
**Community supervision includes federal offenders on day parole, full parole, statutory release, or in the community supervised on a long term supervision order, as well as those who are temporarily detained or paroled for deportation.
Aboriginal Offenders |
Fiscal Year |
|||||
|---|---|---|---|---|---|---|
2004-05 |
2005-06 |
2006-07 |
2007-08 |
2008-09 |
||
Incarcerated |
|
|
|
|
|
|
Atlantic Region |
Men |
83 |
75 |
110 |
120 |
118 |
|
Women |
3 |
9 |
7 |
4 |
5 |
Quebec Region |
Men |
184 |
201 |
218 |
226 |
250 |
|
Women |
3 |
3 |
6 |
14 |
10 |
Ontario Region |
Men |
290 |
296 |
323 |
351 |
373 |
|
Women |
11 |
12 |
24 |
25 |
25 |
Prairie Region |
Men |
1,213 |
1,268 |
1,367 |
1,357 |
1,292 |
|
Women |
69 |
85 |
93 |
99 |
89 |
Pacific Region |
Men |
426 |
405 |
414 |
439 |
427 |
|
Women |
14 |
19 |
18 |
22 |
28 |
National Total |
Men |
2,196 |
2,245 |
2,432 |
2,493 |
2,460 |
|
Women |
100 |
128 |
148 |
164 |
157 |
|
Total |
2,296 |
2,373 |
2,580 |
2,657 |
2,617 |
Community |
|
|
|
|
|
|
Atlantic Region |
Men |
31 |
33 |
25 |
37 |
45 |
|
Women |
5 |
8 |
8 |
10 |
6 |
Quebec Region |
Men |
67 |
82 |
85 |
81 |
83 |
|
Women |
2 |
3 |
1 |
1 |
2 |
Ontario Region |
Men |
112 |
109 |
121 |
152 |
142 |
|
Women |
10 |
9 |
12 |
21 |
21 |
Prairie Region |
Men |
598 |
605 |
550 |
543 |
574 |
|
Women |
57 |
66 |
68 |
62 |
64 |
Pacific Region |
Men |
186 |
212 |
208 |
218 |
214 |
|
Women |
17 |
14 |
14 |
21 |
20 |
National Total |
Men |
994 |
1,041 |
989 |
1,031 |
1,058 |
|
Women |
91 |
100 |
103 |
115 |
113 |
|
Total |
1,085 |
1,141 |
1,092 |
1,146 |
1,171 |
Total Incarcerated & Community |
3,381 |
3,514 |
3,672 |
3,803 |
3,788 |
|
Source: Correctional Service Canada
Note:
Regional statistics for the Correctional Service of Canada account for data relating to the northern territories in the following manner: data for Nunavut are reported in the Ontario Region, data for the Northwest Territories are reported in the Prairies region and data for the Yukon Territories are reported in the Pacific Region.
The number of offender deaths while in custody has fluctuated

Source: Adult Correctional Services Survey, Canadian Centre for Justice Statistics, Statistics Canada
- In the ten-year period from 1998-99 to 2007-08, 532 federal offenders and 381 provincial offenders have died while in custody.
- During this time period, suicides accounted for 20.3% of federal offender deaths and 40.9% of provincial offender deaths. The suicide rate was approximately 84 per 100,000 for incarcerated federal offenders, and approximately 78 per 100,000 for incarcerated provincial offenders**. These rates are significantly higher than Canada's 2004 rate of 11.3 suicides per 100,000 people.
- Between 1998-99 and 2007-08, 6.8% of the federal offender deaths were due to homicide, whereas homicide accounted for 2.9% of provincial offender deaths. The homicide rate for incarcerated federal offenders was approximately 28 per 100,000 and 6 per 100,000 for incarcerated provincial offenders**. These rates are significantly higher than the national homicide rate of 1.8 per 100,000 people in 2007.
Note:
*Other causes of death include: natural causes, accidental deaths, death as a result of a legal intervention, other causes of death and where cause of death was not stated.
**For the calculation of rates, the total actual in-count numbers between 1998-99 and 2007-08 was used as the denominator.
Year |
Type of Death |
||||||
|---|---|---|---|---|---|---|---|
Homicide |
Suicide |
Other* |
Total |
||||
|
# |
% |
# |
% |
# |
% |
# |
Federal |
|||||||
1998-99 |
7 |
10.9 |
17 |
26.6 |
40 |
62.5 |
64 |
1999-00 |
8 |
13.6 |
11 |
18.6 |
40 |
67.8 |
59 |
2000-01 |
0 |
0.0 |
9 |
20.9 |
34 |
79.1 |
43 |
2001-02 |
1 |
2.0 |
13 |
25.5 |
37 |
72.5 |
51 |
2002-03 |
2 |
4.1 |
12 |
24.5 |
35 |
71.4 |
49 |
2003-04 |
8 |
11.9 |
11 |
16.4 |
48 |
71.6 |
67 |
2004-05 |
3 |
6.1 |
9 |
18.4 |
37 |
75.5 |
49 |
2005-06 |
3 |
6.1 |
10 |
20.4 |
36 |
73.5 |
49 |
2006-07 |
3 |
4.9 |
10 |
16.4 |
48 |
78.7 |
61 |
2007-08 |
1 |
2.5 |
5 |
12.5 |
34 |
85.0 |
40 |
Total |
36 |
6.8 |
107 |
20.1 |
389 |
73.1 |
532 |
Provincial |
|||||||
1998-99 |
3 |
7.9 |
19 |
50.0 |
16 |
42.1 |
38 |
1999-00 |
3 |
6.3 |
26 |
54.2 |
19 |
39.6 |
48 |
2000-01 |
1 |
2.0 |
28 |
57.1 |
20 |
40.8 |
49 |
2001-02 |
0 |
0.0 |
16 |
40.0 |
24 |
60.0 |
40 |
2002-03 |
2 |
7.4 |
14 |
51.9 |
11 |
40.7 |
27 |
2003-04 |
0 |
0.0 |
7 |
38.9 |
11 |
61.1 |
18 |
2004-05 |
0 |
0.0 |
12 |
25.0 |
36 |
75.0 |
48 |
2005-06 |
2 |
4.0 |
20 |
40.0 |
28 |
56.0 |
50 |
2006-07 |
0 |
0.0 |
8 |
23.5 |
26 |
76.5 |
34 |
2007-08 |
0 |
0.0 |
6 |
20.7 |
23 |
79.3 |
29 |
Total |
11 |
2.9 |
156 |
40.9 |
214 |
56.2 |
381 |
Total Federal and Provincial Offender Deaths |
47 |
5.1 |
263 |
28.8 |
603 |
66.0 |
913 |
Source: Adult Correctional Services Survey, Canadian Centre for Justice Statistics, Statistics Canada
Note:
Percent calculation include deaths where the cause was unknown. Between 1998-99 and 2007-08, there were nine deaths in federal custody and 43 deaths in provincial custody where the cause was unknown.
*Other causes of death include: natural causes, accidental deaths, death as a result of a legal intervention, other causes of death and where cause of death was not stated.
The number of escapes has decreased
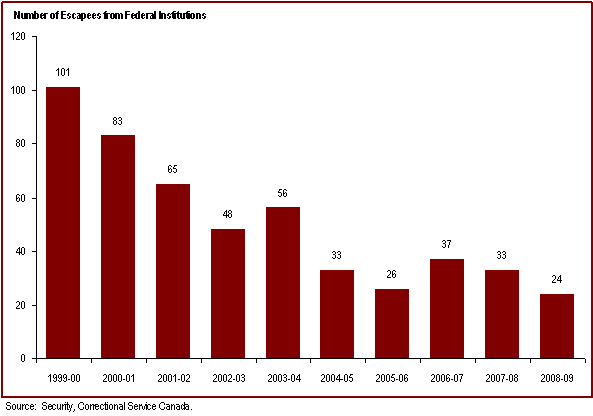
Source: Security, Correctional Service Canada.
- In 2008-09, there were 22 escape incidents involving a total of 24 inmates. Of these 24 escapees, 21 had been recaptured as of April 1, 2009.
- In 2008-09, almost all of the escapees were from minimum security facilities, with 1 escapee from a multi-level institution.
- Inmates who escaped from federal institutions in 2008-09 represented less than 0.2% of the inmate population.
Type of Escapes |
2004-05 |
2005-06 |
2006-07 |
2007-08 |
2008-09 |
|---|---|---|---|---|---|
Escapes from Multi-level Institutions |
1 |
0 |
0 |
0 |
1 |
Number of Escapees |
1 |
0 |
0 |
0 |
1 |
Escapes from Maximum Security Level Institutions |
0 |
0 |
0 |
0 |
0 |
Number of Escapees |
0 |
0 |
0 |
0 |
0 |
Escapes from Medium Security Level Institutions |
1 |
0 |
0 |
0 |
0 |
Number of Escapees |
1 |
0 |
0 |
0 |
0 |
Escapes from Minimum Security Level Institutions |
30 |
23 |
31 |
29 |
21 |
Number of Escapees |
31 |
26 |
37 |
33 |
23 |
Total Number of Escape Incidents |
32 |
23 |
31 |
29 |
22 |
Total Number of Escapees |
33 |
26 |
37 |
33 |
24 |
Source: Security, Correctional Service Canada.
Note:
The data represent the number of escape incidents from federal facilities during each fiscal year. A fiscal year runs from April 1 to March 31 of the following year.
An escape incident can involve more than one offender.
The supervised federal offender population in the community has increased since 2004-05
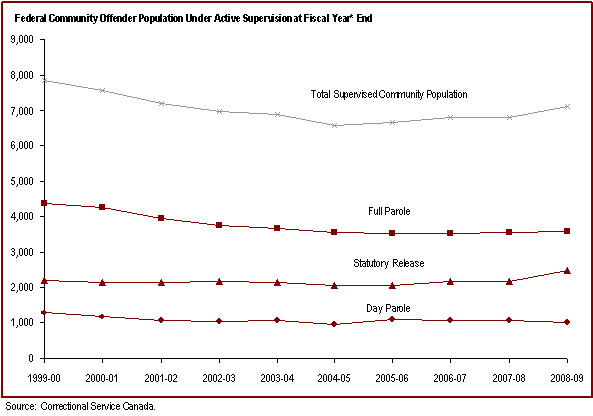
Source: Correctional Service Canada.
- After decreases in the federal offender population in the community under active supervision** from 1999-00 to 2004-05, there has been a small increase in each of the last four years.
- In 2008-09, there were 6,576 men and 511 women on active community supervision.
Note:
*A fiscal year runs from April 1 to March 31 of the following year.
**The data presented above do not include offenders temporarily detained following suspension of a conditional release, offenders who were on long term supervision orders (See Figure/Table E4), offenders paroled for deportation or offenders unlawfully at large.
Day parole is a type of conditional release granted by the National Parole Board whereby offenders are permitted to participate in community-based activities in preparation for full parole or statutory release. The conditions require offenders to return nightly to an institution or half-way house unless otherwise authorized by the National Parole Board.
Full parole is a type of conditional release granted by the National Parole Board whereby the remainder of the sentence is served under supervision in the community.
Statutory release refers to a conditional release that is subject to supervision after the offender has served two-thirds of the sentence.
Supervision Type of Federal Offenders |
||||||||||
|---|---|---|---|---|---|---|---|---|---|---|
Year |
Day Parole |
Full Parole |
Statutory Release |
Totals |
% change* |
|||||
Women |
Men |
Women |
Men |
Women |
Men |
Women |
Men |
Both |
Both |
|
1999-00 |
83 |
1,200 |
334 |
4,013 |
35 |
2,184 |
452 |
7,397 |
7,849 |
1.9 |
2000-01 |
68 |
1,097 |
328 |
3,925 |
51 |
2,112 |
447 |
7,134 |
7,581 |
-3.4 |
2001-02 |
55 |
1,018 |
298 |
3,654 |
56 |
2,109 |
409 |
6,781 |
7,190 |
-5.2 |
2002-03 |
71 |
969 |
267 |
3,469 |
54 |
2,132 |
392 |
6,570 |
6,962 |
-3.2 |
2003-04 |
67 |
986 |
259 |
3,412 |
42 |
2,120 |
368 |
6,518 |
6,886 |
-1.1 |
2004-05 |
90 |
872 |
249 |
3,296 |
69 |
1,999 |
408 |
6,167 |
6,575 |
-4.5 |
2005-06 |
75 |
1,002 |
285 |
3,231 |
64 |
1,998 |
424 |
6,231 |
6,655 |
1.2 |
2006-07 |
97 |
973 |
289 |
3,243 |
64 |
2,116 |
450 |
6,332 |
6,782 |
1.9 |
2007-08 |
102 |
957 |
292 |
3,251 |
89 |
2,100 |
483 |
6,308 |
6,791 |
0.1 |
2008-09 |
86 |
927 |
322 |
3,263 |
103 |
2,386 |
511 |
6,576 |
7,087 |
4.4 |
Source: Correctional Service Canada.
Note:
*Percent change is measured from the previous year.
These cases reflect the number of offenders on active supervision at fiscal year end. A fiscal year runs from April 1 to March 31 of the following year.
The data presented above do not include offenders temporarily detained following suspension of a conditional release, offenders who were on long term supervision orders (See Figure/Table E4), offenders paroled for deportation or offenders unlawfully at large.
In the past five years, the provincial/territorial community corrections population has decreased

Source: Adult Correctional Services Survey, Canadian Centre for Justice Statistics, Statistics Canada.
- There has been an 8.5% decrease in the provincial/territorial community corrections population from 2002-03 to 2007-08.
- Since the introduction of the conditional sentence as a sentencing option in September 1996, the number of offenders serving a conditional sentence had increased steadily until 2005-06. In the last two years, the number of offenders serving conditional sentences has decreased by 7.0% and 2.7% respectively.
- In 2007-08, the total number of offenders on probation was 95,419.
- Probation counts have fluctuated at about 100,000 offenders for over the past decade.
Note:
As of press time, the 2008-09 statistics were unavailable for this publication.
A conditional sentence is a disposition of the court where the offender serves a term of imprisonment in the community under specified conditions. This type of sentence can only be imposed in cases where the term of imprisonment would be less than two years. Conditional sentences have been a provincial and territorial sentencing option since September 1996.
Probation count data are not available for Nunavut in 1999-00, 2000-01, 2002-03 and 2003-04 and for New Brunswick in 2000-01. Data are not available from the Northwest Territories for all years except 2002-03.
--Data reporting conditional sentences begins in 1997-98 as this was the first full year for which data were available. For 1998-99 and 1999-00, figures are not available for Prince Edward Island. For 1997-98 to 2000-01, figures are not available for New Brunswick. For 1997-98 to 2005-06, figures are not available for the Northwest Territories. For 1999-00, 2000-01, 2002-03 and 2003-04 figures are not available for Nunavut.
Year |
Average Monthly Offender Counts on Probation |
Average Monthly Offender Counts on Conditional Sentence |
Total |
|---|---|---|---|
1998-99 |
101,868 |
7,627 |
109,495 |
1999-00 |
102,785 |
8,984 |
111,769 |
2000-01 |
100,441 |
9,885 |
110,326 |
2001-02 |
103,956 |
12,209 |
116,165 |
2002-03 |
105,062 |
13,193 |
118,255 |
2003-04 |
100,993 |
13,632 |
114,625 |
2004-05 |
98,736 |
13,912 |
112,648 |
2005-06 |
98,073 |
14,143 |
112,216 |
2006-07 |
95,660 |
13,148 |
108,808 |
2007-08 |
95,419 |
12,797 |
108,216 |
Source: Adult Correctional Services Survey - Corrections Key Indicator Report for Adults and Young Offenders, Canadian Centre for Justice Statistics, Statistics Canada.
Note:
As of press time, the 2008-09 statistics were unavailable for this publication.
A conditional sentence is a disposition of the court where the offender serves a term of imprisonment in the community under specified conditions. This type of sentence can only be imposed in cases where the term of imprisonment would be less than two years. Conditional sentences have been a provincial and territorial sentencing option since September 1996.
Probation count data are not available for Nunavut in 1999-00, 2000-01, 2002-03 and 2003-04 and for New Brunswick in 2000-01. Data are not available from the Northwest Territories for all years except 2002-03.
--Data reporting conditional sentences begins in 1997-98 as this was the first full year for which data were available. For 1998-99 and 1999-00, figures are not available for Prince Edward Island. For 1997-98 to 2000-01, figures are not available for New Brunswick. For 1997-98 to 2005-06, figures are not available for the Northwest Territories. For 1999-00, 2000-01, 2002-03 and 2003-04 figures are not available for Nunavut.
The number of offenders on provincial parole has decreased over the past decade
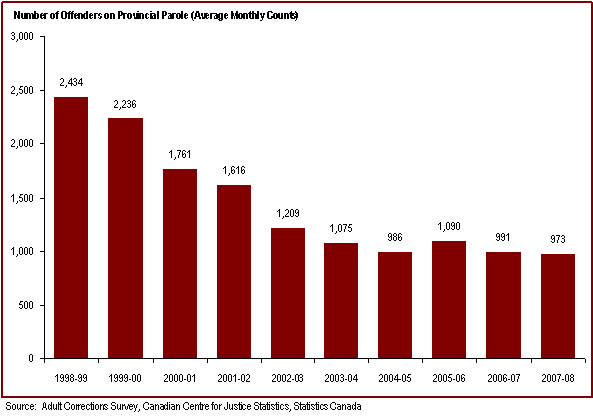
Source: Adult Corrections Survey, Canadian Centre for Justice Statistics, Statistics Canada
- Over the past ten years, there has been a 60.0% decrease in the number of offenders on provincial parole, from 2,434 in 1998-99 to 973 in 2007-08.
Note:
As of press time, the 2008-09 statistics were unavailable for this publication.
Provincial parole boards operate in Quebec and Ontario. On April 1, 2007, the National Parole Board assumed responsibility for parole decisions relating to offenders serving sentences in British Columbia's provincial correctional facilities. The National Parole Board has jurisdiction over granting parole to provincial offenders in the Atlantic and Prairie provinces and to territorial offenders in the Yukon, Nunavut and Northwest Territories.
Year |
Average Monthly Counts on Provincial Parole |
||||||
|---|---|---|---|---|---|---|---|
Provincial Boards |
National Parole Board* |
Total |
Percent Change |
||||
Quebec |
Ontario |
British Columbia |
Total |
||||
1998-99 |
1,334 |
574 |
239 |
2,147 |
287 |
2,434 |
-13.5 |
1999-00 |
1,291 |
406 |
203 |
1,900 |
336 |
2,236 |
-8.1 |
2000-01 |
903 |
322 |
249 |
1,474 |
287 |
1,761 |
-21.2 |
2001-02 |
846 |
276 |
265 |
1,387 |
229 |
1,616 |
-8.2 |
2002-03 |
581 |
210 |
223 |
1,014 |
195 |
1,209 |
-25.1 |
2003-04 |
550 |
146 |
189 |
885 |
190 |
1,075 |
-11.1 |
2004-05 |
517 |
127 |
166 |
810 |
176 |
986 |
-8.3 |
2005-06 |
628 |
152 |
147 |
927 |
163 |
1,090 |
10.3 |
2006-07 |
593 |
142 |
120 |
855 |
136 |
991 |
-9.1 |
2007-08 |
531 |
205 |
n/a |
736 |
237 |
973 |
-1.8 |
Source: Adult Corrections Survey, Canadian Centre for Justice Statistics, Statistics Canada
Note:
As of press time, the 2008-09 statistics were unavailable for this publication.
*The data represent the number of provincial offenders who are released from custody on the authority of the National Parole Board and supervised by the Correctional Service of Canada.
Provincial parole boards operate in Quebec and Ontario. On April 1, 2007, the National Parole Board assumed responsibility for parole decisions relating to offenders serving sentences in British Columbia's provincial correctional facilities. The National Parole Board has jurisdiction over granting parole to provincial offenders in the Atlantic and Prairie provinces and to territorial offenders in the Yukon, Nunavut and Northwest Territories.
Section D: Conditional Release
The federal full parole grant rate has stabilized

Source: National Parole Board.
- In 2008-09, the grant rates for day parole and full parole were 68.9% and 44.0%, respectively.
- The grant rates for day parole have fluctuated since 1999-00 but have been on a downward trend, while the grant rates for full parole have remained stable. The day parole grant rate is the lowest it has been in last decade.
- Federal day parole and full parole grant rates are higher for female offenders than for male offenders.
Note:
The grant rate represents the percentage of pre-release reviews resulting in a grant by the National Parole Board.
Day parole is a type of conditional release granted by the National Parole Board in which offenders are permitted to participate in community-based activities in preparation for full parole or statutory release. The conditions require offenders to return nightly to an institution or half-way house unless otherwise authorized by the National Parole Board.
Not all offenders apply for day parole, and some apply more than once before being granted day parole.
Full parole is a type of conditional release granted by the National Parole Board in which the remainder of the sentence is served under supervision in the community.
The National Parole Board must review the cases of all offenders for full parole at the time prescribed by legislation, unless the offender advises the National Parole Board in writing that he/she does not wish to be considered for full parole.
Type of Release |
Year |
Granted |
Denied |
Grant Rate (%) |
||||
|---|---|---|---|---|---|---|---|---|
Women |
Men |
Women |
Men |
Women |
Men |
Total |
||
Day Parole |
1999-00 |
231 |
3,609 |
38 |
1,428 |
85.9 |
71.6 |
72.4 |
|
2000-01 |
224 |
3,236 |
27 |
1,325 |
89.2 |
70.9 |
71.9 |
|
2001-02 |
189 |
2,981 |
29 |
1,228 |
86.7 |
70.8 |
71.6 |
|
2002-03 |
196 |
2,830 |
24 |
1,181 |
89.1 |
70.6 |
71.5 |
|
2003-04 |
213 |
2,909 |
25 |
1,047 |
89.5 |
73.5 |
74.4 |
|
2004-05 |
258 |
2,819 |
24 |
1,027 |
91.5 |
73.3 |
74.5 |
|
2005-06 |
247 |
2,961 |
33 |
1,087 |
88.2 |
73.1 |
74.1 |
|
2006-07 |
263 |
2,902 |
41 |
1,312 |
86.5 |
68.9 |
70.1 |
|
2007-08 |
285 |
2,855 |
38 |
1,264 |
88.2 |
69.3 |
70.7 |
|
2008-09 |
276 |
2,767 |
38 |
1,338 |
87.9 |
67.4 |
68.9 |
Full Parole |
1999-00 |
195 |
1,974 |
84 |
2,739 |
69.9 |
41.9 |
43.4 |
|
2000-01 |
173 |
1,641 |
57 |
2,407 |
75.2 |
40.5 |
42.4 |
|
2001-02 |
148 |
1,512 |
53 |
2,128 |
73.6 |
41.5 |
43.2 |
|
2002-03 |
113 |
1,391 |
57 |
1,965 |
66.5 |
41.4 |
42.7 |
|
2003-04 |
156 |
1,449 |
48 |
1,897 |
76.5 |
43.3 |
45.2 |
|
2004-05 |
155 |
1,376 |
72 |
1,750 |
68.3 |
44.0 |
45.7 |
|
2005-06 |
168 |
1,486 |
67 |
1,958 |
71.5 |
43.1 |
45.0 |
|
2006-07 |
168 |
1,450 |
82 |
2,058 |
67.2 |
41.3 |
43.1 |
|
2007-08 |
168 |
1,398 |
70 |
2,008 |
70.6 |
41.0 |
43.0 |
|
2008-09 |
209 |
1,427 |
60 |
2,018 |
77.7 |
41.4 |
44.0 |
Source: National Parole Board.
Note:
The grant rate represents the percentage of pre-release reviews resulting in a grant by the National Parole Board.
Day parole is a type of conditional release granted by the National Parole Board in which offenders are permitted to participate in community-based activities in preparation for full parole or statutory release. The conditions require offenders to return nightly to an institution or half-way house unless otherwise authorized by the National Parole Board.
Not all offenders apply for day parole, and some apply more than once before being granted day parole.
Full parole is a type of conditional release granted by the National Parole Board in which the remainder of the sentence is served under supervision in the community.
The National Parole Board must review the cases of all offenders for full parole at the time prescribed by legislation, unless the offender advises the National Parole Board in writing that he/she does not wish to be considered for full parole.
The federal parole grant rate for Aboriginal offenders decreased in 2008-09
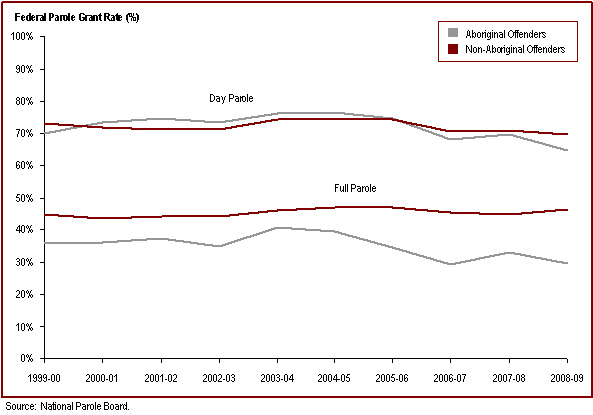
Source: National Parole Board.
- The day parole grant rate decreased for both Aboriginal and non-Aboriginal offenders in 2008-09.
However, the rate for Aboriginal offenders was lower than the rate for non-Aboriginal offenders. - The full parole grant rate for Aboriginal offenders decreased in 2008-09, while it increased for non- Aboriginal offenders.
Note:
The grant rate represents the percentage of pre-release reviews resulting in a grant by the National Parole Board.
Day parole is a type of conditional release granted by the National Parole Board in which offenders are permitted to participate in community-based activities in preparation for full parole or statutory release. The conditions require offenders to return nightly to an institution or half-way house unless otherwise authorized by the National Parole Board.
Not all offenders apply for day parole, and some apply more than once before being granted day parole.
Full parole is a type of conditional release granted by the National Parole Board in which the remainder of the sentence is served under supervision in the community.
The National Parole Board must review the cases of all offenders for full parole at the time prescribed by legislation, unless the offender advises the National Parole Board in writing that he/she does not wish to be considered for full parole.
Type of Release |
Year |
Aboriginal |
Denied |
Total Number |
||||
|---|---|---|---|---|---|---|---|---|
Number Granted |
Number Denied |
Grant Rate (%) |
Number Granted |
Number Denied |
Grant Rate (%) |
|||
Day Parole |
1999-00 |
533 |
230 |
69.9 |
3,307 |
1,236 |
72.8 |
5,306 |
|
2000-01 |
531 |
194 |
73.2 |
2,929 |
1,158 |
71.7 |
4,812 |
|
2001-02 |
479 |
163 |
74.6 |
2,691 |
1,094 |
71.1 |
4,427 |
|
2002-03 |
484 |
178 |
73.1 |
2,542 |
1,027 |
71.2 |
4,231 |
|
2003-04 |
495 |
157 |
75.9 |
2,627 |
915 |
74.2 |
4,194 |
|
2004-05 |
487 |
149 |
76.6 |
2,590 |
902 |
74.2 |
4,128 |
|
2005-06 |
570 |
194 |
74.6 |
2,638 |
926 |
74.1 |
4,328 |
|
2006-07 |
514 |
243 |
67.9 |
2,651 |
1,110 |
70.5 |
4,518 |
|
2007-08 |
477 |
209 |
69.5 |
2,663 |
1,093 |
70.9 |
4,442 |
|
2008-09 |
445 |
243 |
64.7 |
2,598 |
1,133 |
69.6 |
4,419 |
Full Parole |
1999-00 |
245 |
443 |
35.6 |
1,924 |
2,380 |
44.7 |
4,992 |
|
2000-01 |
207 |
366 |
36.1 |
1,607 |
2,098 |
43.4 |
4,278 |
|
2001-02 |
185 |
314 |
37.1 |
1,475 |
1,867 |
44.1 |
3,841 |
|
2002-03 |
173 |
323 |
34.9 |
1,331 |
1,699 |
43.9 |
3,526 |
|
2003-04 |
197 |
290 |
40.5 |
1,408 |
1,655 |
46.0 |
3,550 |
|
2004-05 |
187 |
287 |
39.5 |
1,344 |
1,535 |
46.7 |
3,353 |
|
2005-06 |
195 |
372 |
34.4 |
1,459 |
1,653 |
46.9 |
3,679 |
|
2006-07 |
154 |
375 |
29.1 |
1,464 |
1,765 |
45.3 |
3,758 |
|
2007-08 |
162 |
331 |
32.9 |
1,404 |
1,747 |
44.6 |
3,644 |
|
2008-09 |
149 |
354 |
29.6 |
1,487 |
1,724 |
46.3 |
3,714 |
Source: National Parole Board.
Note:
The grant rate represents the percentage of pre-release reviews resulting in a grant by the National Parole Board.
Day parole is a type of conditional release granted by the National Parole Board in which offenders are permitted to participate in community-based activities in preparation for full parole or statutory release. The conditions require offenders to return nightly to an institution or half-way house unless otherwise authorized by the National Parole Board.
Not all offenders apply for day parole, and some apply more than once before being granted day parole.
Full parole is a type of conditional release granted by the National Parole Board in which the remainder of the sentence is served under supervision in the community.
The National Parole Board must review the cases of all offenders for full parole at the time prescribed by legislation, unless the offender advises the National Parole Board in writing that he/she does not wish to be considered for full parole.
Federal parole hearings involving an aboriginal cultural advisor decreased for the third year

Source: National Parole Board.
- In 2008-09, 36.4% of all hearings for Aboriginal offenders were held with an Aboriginal Cultural Advisor.
- In 2008-09, there were 418 hearings for Aboriginal offenders held with an Aboriginal Cultural Advisor, compared to 278 in 1999-00.
- Sixty (12.6%) of the 478 hearings held with an Aboriginal Cultural Advisor in 2008-09 was for non-Aboriginal offenders.
Note:
The presence of an Aboriginal Cultural Advisor is an alternative approach to the traditional parole hearing, which was introduced by the National Parole Board to ensure that conditional release hearings were sensitive to Aboriginal cultural values and traditions. This type of hearing is available to both Aboriginal and non-Aboriginal offenders.
Year |
Hearings held with an Aboriginal Cultural Advisor |
||||||||
|---|---|---|---|---|---|---|---|---|---|
Aboriginal Offenders |
Non-Aboriginal Offenders |
All Offenders |
|||||||
Total Hearings |
With Cultural Advisor |
Total Hearings |
With Cultural Advisor |
Total Hearings |
With Cultural Advisor |
||||
|
# |
# |
% |
# |
# |
% |
# |
# |
% |
1999-00 |
1,248 |
278 |
22.3 |
5,581 |
14 |
0.3 |
6,829 |
292 |
4.3 |
2000-01 |
1,141 |
329 |
28.8 |
5,254 |
35 |
0.7 |
6,395 |
364 |
5.7 |
2001-02 |
1,113 |
429 |
38.5 |
4,761 |
43 |
0.9 |
5,874 |
472 |
8.0 |
2002-03 |
1,179 |
477 |
40.5 |
5,018 |
51 |
1.0 |
6,197 |
528 |
8.5 |
2003-04 |
1,234 |
552 |
44.7 |
5,117 |
71 |
1.4 |
6,351 |
623 |
9.8 |
2004-05 |
1,295 |
616 |
47.6 |
5,080 |
96 |
1.9 |
6,375 |
712 |
11.2 |
2005-06 |
1,356 |
643 |
47.4 |
5,219 |
99 |
1.9 |
6,575 |
742 |
11.3 |
2006-07 |
1,308 |
598 |
45.7 |
5,326 |
87 |
1.6 |
6,634 |
685 |
10.3 |
2007-08 |
1,199 |
465 |
33.8 |
4,800 |
56 |
1.2 |
5,999 |
521 |
8.7 |
2008-09 |
1,149 |
418 |
36.4 |
4,482 |
60 |
1.3 |
5,631 |
478 |
8.5 |
Source: National Parole Board
Note:
The presence of an Aboriginal Cultural Advisor is an alternative approach to the traditional parole hearing, which was introduced by the National Parole Board to ensure that conditional release hearings were sensitive to Aboriginal cultural values and traditions. This type of hearing is available to both Aboriginal and non-Aboriginal offenders.
Offenders granted full parole serve about 40% of their sentence prior to starting full parole

Source: National Parole Board.
- The percentage of time served until supervised under first full parole was 38.3% in 2008-09.
- In 2008-09, women served an average of 2.4% less of their sentences before first federal full parole supervision and 4.2% less before first federal day parole supervision than men (36.2% compared to 38.6% and 28.1% compared to 32.3%, respectively).
- The percentage of time served until first full parole supervision has fluctuated very little since 1999-00.
Note:
Timing of parole in the sentence refers to the percentage of the sentence served at the time the first day parole or full parole starts during the sentence. In most cases a full parole is preceded by a day parole.
These calculations are based on sentences under federal jurisdiction excluding life sentences and indeterminate sentences.
Offenders (other than those serving life or indeterminate sentences or subject to judicial determination) normally become eligible for full parole after serving 1/3 of their sentence or seven years, whichever is less. Eligibility for day parole is normally at 6 months before full parole eligibility or at 1/6 of the sentence for cases that meet the accelerated parole review criteria (see Section 125 of the Corrections and Conditional Release Act).
Year |
Type of Supervision |
|||||
|---|---|---|---|---|---|---|
First Day Parole |
First Full Parole |
|||||
Women |
Men |
Total |
Women |
Men |
Total |
|
|
Percentage of sentence incarcerated |
|||||
1999-00 |
24.8 |
31.2 |
30.7 |
37.4 |
39.5 |
39.4 |
2000-01 |
26.0 |
31.2 |
30.7 |
36.8 |
39.3 |
39.0 |
2001-02 |
26.8 |
32.0 |
31.6 |
36.6 |
39.1 |
38.8 |
2002-03 |
26.9 |
31.5 |
31.1 |
37.4 |
39.0 |
38.8 |
2003-04 |
27.5 |
33.4 |
33.0 |
37.5 |
39.6 |
39.4 |
2004-05 |
28.8 |
33.3 |
32.9 |
37.2 |
39.6 |
39.4 |
2005-06 |
28.5 |
33.0 |
32.6 |
36.1 |
39.3 |
39.0 |
2006-07 |
27.4 |
33.2 |
32.6 |
36.9 |
39.3 |
39.1 |
2007-08 |
30.3 |
32.3 |
32.1 |
37.1 |
38.2 |
38.1 |
2008-09 |
28.1 |
32.3 |
31.8 |
36.2 |
38.6 |
38.3 |
Source: National Parole Board.
Note:
Timing of parole in the sentence refers to the percentage of the sentence served at the time the first day parole or full parole starts during the sentence. In most cases a full parole is preceded by a day parole.
These calculations are based on sentences under federal jurisdiction excluding life sentences and indeterminate sentences.
Offenders (other than those serving life or indeterminate sentences or subject to judicial determination) normally become eligible for full parole after serving 1/3 of their sentence or seven years, whichever is less. Eligibility for day parole is normally at 6 months before full parole eligibility or at 1/6 of the sentence for cases that meet the accelerated parole review criteria (see Section 125 of the Corrections and Conditional Release Act).
Aboriginal offenders serve a higher proportion of their sentences before being released on parole

Source: National Parole Board.
- In 2008-09, the percentage of time served until full parole supervision was lower for non-Aboriginal offenders than for Aboriginal offenders (38.1% versus 41.3%, respectively).
- In 2008-09, the percentage of time served until first day parole supervision was lower for non-Aboriginal offenders than it was for Aboriginal offenders (31.0% versus 38.0%, respectively).
- Of the 102 Aboriginal offenders released on a first federal full parole supervision in 2008-09, 47.1% of them were released on accelerated full parole supervision compared to 68.9% of non-Aboriginal offenders.
- Of the 214 Aboriginal offenders released on a first federal day parole supervision in 2008-09, 32.7% of them were released on accelerated day parole supervision compared to 55.3% of non-Aboriginal offenders.
Note:
Timing of parole in the sentence refers to the percentage of the sentence served at the time the first day parole or full parole starts during the sentence. In most cases a full parole is preceded by a day parole.
These calculations are based on sentences under federal jurisdiction excluding life sentences and indeterminate sentences.
Offenders (other than those serving life or indeterminate sentences or subject to judicial determination) normally become eligible for full parole after serving 1/3 of their sentence or seven years, whichever is less. Eligibility for day parole is normally at 6 months before full parole eligibility or at 1/6 of the sentence for cases that meet the accelerated parole review criteria (see Section 125 of the Corrections and Conditional Release Act).
Year |
Type of Supervision |
|||||
|---|---|---|---|---|---|---|
First Day Parole |
First Full Parole |
|||||
Aboriginal |
Non-Aboriginal |
Total |
Aboriginal |
Non-Aboriginal |
Total |
|
|
Percentage of sentence incarcerated |
|||||
1999-00 |
34.6 |
30.1 |
30.7 |
41.6 |
39.1 |
39.4 |
2000-01 |
34.2 |
30.1 |
30.7 |
40.1 |
38.9 |
39.0 |
2001-02 |
37.1 |
30.7 |
31.6 |
42.7 |
38.4 |
38.8 |
2002-03 |
35.4 |
30.4 |
31.1 |
40.6 |
38.6 |
38.8 |
2003-04 |
38.8 |
31.9 |
33.0 |
42.9 |
38.9 |
39.4 |
2004-05 |
37.2 |
32.1 |
32.9 |
42.1 |
39.0 |
39.4 |
2005-06 |
36.6 |
31.9 |
32.6 |
42.4 |
38.5 |
39.0 |
2006-07 |
37.5 |
31.9 |
32.6 |
40.9 |
38.9 |
39.1 |
2007-08 |
38.5 |
31.2 |
32.1 |
40.8 |
37.8 |
38.1 |
2008-09 |
38.0 |
31.0 |
31.8 |
41.3 |
38.1 |
38.3 |
Source: National Parole Board.
Note:
Timing of parole in the sentence refers to the percentage of the sentence served at the time the first day parole or full parole starts during the sentence. In most cases a full parole is preceded by a day parole.
These calculations are based on sentences under federal jurisdiction excluding life sentences and indeterminate sentences.
Offenders (other than those serving life or indeterminate sentences or subject to judicial determination) normally become eligible for full parole after serving 1/3 of their sentence or seven years, whichever is less. Eligibility for day parole is normally at 6 months before full parole eligibility or at 1/6 of the sentence for cases that meet the accelerated parole review criteria (see Section 125 of the Corrections and Conditional Release Act).
Women serve a lower proportion of their sentences than men before being released on parole
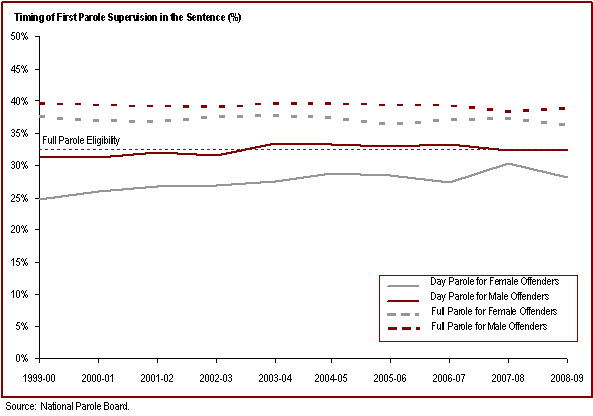
Source: National Parole Board.
- In 2008-09, men served more of their sentences than women prior to beginning their first full parole supervision period (38.6% compared to 36.2%).
- In 2008-09, the percentage of time served until first day parole was less for female offenders than it was for male offenders (28.1% versus 32.3%, respectively).
- Of the 1,256 female offenders released on first federal full parole since 1999-00, 72.5% of them were released on accelerated full parole compared to 61.2% of the 11,430 male offenders released on first federal full parole.
- Since 1999-00, female offenders were released on accelerated day parole more often than male offenders (61.6% versus 45.0%, respectively).
Note:
Timing of parole in the sentence refers to the percentage of the sentence served at the time the first day parole or full parole starts during the sentence. In most cases a full parole is preceded by a day parole.
These calculations are based on sentences under federal jurisdiction excluding life sentences and indeterminate sentences.
Offenders (other than those serving life or indeterminate sentences or subject to judicial determination) normally become eligible for full parole after serving 1/3 of their sentence or seven years, whichever is less. Eligibility for day parole is normally at 6 months before full parole eligibility or at 1/6 of the sentence for cases that meet the accelerated parole review criteria (see Section 125 of the Corrections and Conditional Release Act).
Year |
Type of Supervision |
|||||
|---|---|---|---|---|---|---|
First Day Parole |
First Full Parole |
|||||
Women |
Men |
Total |
Women |
Men |
Total |
|
|
Percentage of sentence incarcerated |
|||||
1999-00 |
24.8 |
31.2 |
30.7 |
37.4 |
39.5 |
39.4 |
2000-01 |
26.0 |
31.2 |
30.7 |
36.8 |
39.3 |
39.0 |
2001-02 |
26.8 |
32.0 |
31.6 |
36.6 |
39.1 |
38.8 |
2002-03 |
26.9 |
31.5 |
31.1 |
37.4 |
39.0 |
38.8 |
2003-04 |
27.5 |
33.4 |
33.0 |
37.5 |
39.6 |
39.4 |
2004-05 |
28.8 |
33.3 |
32.9 |
37.2 |
39.6 |
39.4 |
2005-06 |
28.5 |
33.0 |
32.6 |
36.1 |
39.3 |
39.0 |
2006-07 |
27.4 |
33.2 |
32.6 |
36.9 |
39.3 |
39.1 |
2007-08 |
30.3 |
32.3 |
32.1 |
37.1 |
38.2 |
38.1 |
2008-09 |
28.1 |
32.3 |
31.8 |
36.2 |
38.6 |
38.3 |
Source: National Parole Board.
Note:
Timing of parole in the sentence refers to the percentage of the sentence served at the time the first day parole or full parole starts during the sentence. In most cases a full parole is preceded by a day parole.
These calculations are based on sentences under federal jurisdiction excluding life sentences and indeterminate sentences.
Offenders (other than those serving life or indeterminate sentences or subject to judicial determination) normally become eligible for full parole after serving 1/3 of their sentence or seven years, whichever is less. Eligibility for day parole is normally at 6 months before full parole eligibility or at 1/6 of the sentence for cases that meet the accelerated parole review criteria (see Section 125 of the Corrections and Conditional Release Act).
A large majority of federal day paroles are successfully completed

Source: National Parole Board.
- Since 1999-00, over 80% of day paroles have been completed successfully.
- Based on the year of completion of the supervision period, the total number of federal day paroles completed was 3,073 in 2008-09.
- In 2008-09, 2.8% of day paroles ended with a non-violent offence and 0.5% with a violent offence.
- In 2008-09, the percentage of successful day paroles was higher for men than for women (85.0% versus 80.4%, respectively).
Note:
*Revocation for Breach of Conditions includes revocation with outstanding charges.
A day parole is considered successful if it was completed without a return to prison for a breach of conditions or for a new offence.
Federal Day |
2004-05 |
2005-06 |
2006-07 |
2007-08 |
2008-09 |
|||||
|---|---|---|---|---|---|---|---|---|---|---|
|
# |
% |
# |
% |
# |
% |
# |
% |
# |
% |
Successful Completion |
||||||||||
Regular |
1,875 |
82.7 |
1,740 |
81.4 |
1,785 |
81.6 |
1,705 |
81.2 |
1,783 |
84.4 |
Accelerated |
673 |
80.5 |
743 |
82.1 |
762 |
81.8 |
812 |
82.1 |
814 |
84.7 |
Total |
2,548 |
82.1 |
2,483 |
81.6 |
2,547 |
81.7 |
2,517 |
81.5 |
2,597 |
84.5 |
Revocation for Breach of Conditions* |
||||||||||
Regular |
295 |
13.0 |
313 |
14.6 |
279 |
12.8 |
302 |
14.4 |
274 |
13.0 |
Accelerated |
102 |
12.2 |
84 |
9.3 |
102 |
11.0 |
122 |
12.3 |
101 |
10.5 |
Total |
397 |
12.8 |
397 |
13.0 |
381 |
12.2 |
424 |
13.7 |
375 |
12.2 |
Revocation with Non-Violent Offence |
||||||||||
Regular |
79 |
3.5 |
69 |
3.2 |
101 |
4.6 |
78 |
3.7 |
43 |
2.0 |
Accelerated |
57 |
6.8 |
73 |
8.1 |
66 |
7.1 |
54 |
5.5 |
42 |
4.4 |
Total |
136 |
4.4 |
142 |
4.7 |
167 |
5.4 |
132 |
4.3 |
85 |
2.8 |
Revocation with Violent Offence** |
||||||||||
Regular |
18 |
0.8 |
16 |
0.7 |
22 |
1.0 |
14 |
0.7 |
12 |
0.6 |
Accelerated |
4 |
0.5 |
5 |
0.6 |
1 |
0.1 |
1 |
0.1 |
4 |
0.4 |
Total |
22 |
0.7 |
21 |
0.7 |
23 |
0.7 |
15 |
0.5 |
16 |
0.5 |
Total |
||||||||||
Regular |
2,267 |
73.1 |
2,138 |
70.3 |
2,187 |
70.1 |
2,099 |
68.0 |
2,112 |
68.7 |
Accelerated |
836 |
26.9 |
905 |
29.7 |
931 |
29.9 |
989 |
32.0 |
961 |
31.3 |
Total |
3,103 |
100.0 |
3,043 |
100.0 |
3,118 |
100.0 |
3,088 |
100.0 |
3,073 |
100.0 |
Source: National Parole Board.
Note:
*Revocation for Breach of Conditions includes revocation with outstanding charges.
**Violent offences include murder and Schedule I offences (listed in the Corrections and Conditional Release Act) such as assaults, sexual offences, arson, abduction, robbery and some weapon offences.
Day parole is a type of conditional release in which offenders are permitted to participate in community-based activities in preparation for full parole or statutory release. The conditions require offenders to return nightly to an institution or half-way house unless otherwise authorized by the National Parole Board.
Eligibility for day parole release normally occurs 6 months prior to full parole. Eligibility for accelerated parole review cases occurs after the offender serves 6 months or 1/6 of the sentence, whichever is greater.
The majority of federal full paroles are successfully completed

Source: National Parole Board.
- The percentage of full paroles that were successfully completed increased in 2008-09.
- In 2008-09, 6.7% of full paroles ended with a non-violent offence and 0.8% with a violent offence.
- In 2008-09, the percentage of successful full paroles was higher for women than men (75.5% versus 73.2% respectively).
- Based on the year of completion of the supervision period, the number of federal full paroles completed was 1,441 in 2008-09.
Note:
*Revocation for Breach of Conditions includes revocation with outstanding charges.
A full parole is considered successful if it was completed without a return to prison for a breach of conditions or for a new offence.
These data do not include offenders serving life or indeterminate sentences as these offenders, by definition, remain under supervision for life.
Federal Full Parole Outcomes* |
2004-05 |
2005-06 |
2006-07 |
2007-08 |
2008-09 |
|||||
|---|---|---|---|---|---|---|---|---|---|---|
|
# |
% |
# |
% |
# |
% |
# |
% |
# |
% |
Successful Completion |
||||||||||
Regular |
464 |
73.2 |
466 |
73.7 |
417 |
71.5 |
441 |
73.5 |
415 |
76.3 |
Accelerated |
614 |
70.9 |
548 |
66.2 |
582 |
68.6 |
581 |
69.6 |
643 |
71.7 |
Total |
1,078 |
71.9 |
1,014 |
69.5 |
999 |
69.8 |
1,022 |
71.2 |
1,058 |
73.4 |
Revocation for Breach of Conditions** |
||||||||||
Regular |
107 |
16.9 |
111 |
17.6 |
106 |
18.2 |
110 |
18.3 |
88 |
16.2 |
Accelerated |
163 |
18.8 |
172 |
20.8 |
173 |
20.4 |
167 |
20.0 |
188 |
21.0 |
Total |
270 |
18.0 |
283 |
19.4 |
279 |
19.5 |
277 |
19.3 |
276 |
19.2 |
Revocation with Non-Violent Offence |
||||||||||
Regular |
43 |
6.8 |
41 |
6.5 |
49 |
8.4 |
38 |
6.3 |
32 |
5.9 |
Accelerated |
82 |
9.5 |
101 |
12.2 |
91 |
10.7 |
80 |
9.6 |
64 |
7.1 |
Total |
125 |
8.3 |
142 |
9.7 |
140 |
9.8 |
118 |
8.2 |
96 |
6.7 |
Revocation with Violent Offence*** |
||||||||||
Regular |
20 |
3.2 |
14 |
2.2 |
11 |
1.9 |
11 |
1.8 |
9 |
1.7 |
Accelerated |
7 |
0.8 |
7 |
0.8 |
3 |
0.4 |
7 |
0.8 |
2 |
0.2 |
Total |
27 |
1.8 |
21 |
1.4 |
14 |
1.0 |
18 |
1.3 |
11 |
0.8 |
Total |
||||||||||
Regular |
634 |
42.3 |
632 |
43.3 |
583 |
40.7 |
600 |
41.8 |
544 |
37.8 |
Accelerated |
866 |
57.7 |
828 |
56.7 |
849 |
59.3 |
835 |
58.2 |
897 |
62.2 |
Total |
1,500 |
100.0 |
1,460 |
100.0 |
1,432 |
100.0 |
1,435 |
100.0 |
1,441 |
100.0 |
Source: National Parole Board.
Note:
*Excludes offenders serving indeterminate sentences because they do not have a warrant expiry date and can only successfully complete full parole by dying.
**Revocation for Breach of Conditions includes revocation with outstanding charges.
***Violent offences include murder and Schedule I offences (listed in the Corrections and Conditional Release Act) such as assaults, sexual offences, arson, abduction, robbery and some weapon offences.
Full parole is a type of conditional release granted by the National Parole Board in which a portion of the sentence is served under supervision in the community. Offenders (other than those serving life or indeterminate sentences or subject to judicial determination) normally become eligible for full parole after serving 1/3 of their sentence or seven years, whichever is less.
The majority of statutory releases are successfully completed

Source: National Parole Board.
- Over the past ten years, the percentage of statutory releases that were completed successfully fluctuated little, ranging from 60.2% to 60.3%.
- In 2008-09, 8.4% of statutory releases ended with a non-violent offence and 1.3% with a violent offence.
- In 2008-09, the percentage of successful statutory releases was higher for women than men (73.1% and 59.6% respectively).
Note:
*Revocation for Breach of Conditions includes revocation with outstanding charges.
A statutory release is considered successful if it was completed without a return to prison for a breach of conditions or for a new offence.
Statutory release refers to a conditional release that is subject to supervision after the offender has served two-thirds of the sentence.
Statutory Release Outcomes |
2004-05 |
2005-06 |
2006-07 |
2007-08 |
2008-09 |
|||||
|---|---|---|---|---|---|---|---|---|---|---|
|
# |
% |
# |
% |
# |
% |
# |
% |
# |
% |
Successful Completion |
3,143 |
58.0 |
3,245 |
58.5 |
3,271 |
58.3 |
3,396 |
58.6 |
3,499 |
60.3 |
Revocation for Breach of Conditions* |
1,612 |
29.7 |
1,653 |
29.8 |
1,651 |
29.5 |
1,733 |
29.9 |
1,744 |
30.0 |
Revocation with Non-Violent Offence |
530 |
9.8 |
519 |
9.4 |
543 |
9.7 |
541 |
9.3 |
489 |
8.4 |
Revocation with Violent Offence** |
137 |
2.5 |
132 |
2.4 |
141 |
2.5 |
129 |
2.2 |
75 |
1.3 |
Total |
5,422 |
100.0 |
5,549 |
100.0 |
5,606 |
100.0 |
5,799 |
100.0 |
5,807 |
100.0 |
Source: National Parole Board.
Note:
*Revocation for Breach of Conditions includes revocation with outstanding charges.
**Violent offences include murder and Schedule I offences (listed in the Corrections and Conditional Release Act) such as assaults, sexual offences, arson, abduction, robbery and some weapon offences.
Over the past decade, the rate of violent conviction for offenders while under supervision has declined

Source: National Parole Board.
- The rate of conviction for violent offences** while under community supervision has declined since 1999-00.
- Those offenders under discretionary release (full parole and day parole) are less likely to be convicted of a violent offence while under supervision than those on statutory release.
Note:
*Supervised offenders include offenders who are on parole, statutory release, those temporarily detained in federal institutions, and those who are unlawfully at large.
**Violent offences include murder and Schedule I offences (listed in the Corrections and Conditional Release Act) such as assaults, sexual offences, arson, abduction, robbery and some weapon offences.
The dotted line between 2007-08 and 2008-09 is intended to signify that due to delays in the court process, these numbers under represent the actual number of convictions, as verdicts may not have been reached by year-end.
Year |
# of Offenders Convicted for Violent Offences |
Rate per 1,000 Supervised Offenders* |
|||||
|---|---|---|---|---|---|---|---|
Day Parole |
Full Parole |
Statutory Release |
Total |
Day Parole |
Full Parole |
Statutory Release |
|
1999-00 |
58 |
47 |
160 |
265 |
37 |
10 |
57 |
2000-01 |
35 |
40 |
167 |
242 |
25 |
9 |
60 |
2001-02 |
33 |
33 |
149 |
215 |
25 |
8 |
52 |
2002-03 |
23 |
27 |
148 |
198 |
18 |
7 |
51 |
2003-04 |
20 |
21 |
149 |
190 |
15 |
5 |
50 |
2004-05 |
22 |
28 |
137 |
187 |
18 |
7 |
46 |
2005-06 |
21 |
21 |
132 |
174 |
15 |
5 |
43 |
2006-07 |
23 |
14 |
141 |
178 |
17 |
4 |
44 |
2007-08 |
17 |
18 |
129 |
164 |
13 |
5 |
41 |
2008-09** |
16 |
10 |
73 |
99 |
13 |
3 |
22 |
Source: National Parole Board.
Note:
*Supervised offenders include offenders who are on parole, statutory release, those temporarily detained in federal institutions, and those who are unlawfully at large.
**Due to delays in the court processes, the numbers under-represent the actual number of convictions, as verdicts may not have been reached by year-end. Violent offences include murder and Schedule I offences (listed in the Corrections and Conditional Release Act) such as assaults, sexual offences, arson, abduction, robbery and some weapon offences.
Day and full parole include those offenders serving determinate and indeterminate sentences.
Over 25% of offenders serving determinate sentences were not reviewed for parole

Source: National Parole Board.
- For offenders commencing determinate sentences between April 1, 1998 and March 31, 2003 and completed their sentences by March 31, 2009
- 29.7% did not appear before the National Parole Board for a decision during their sentence as they waived their parole review, postponed it until after statutory release, or withdrew their parole applications.
- 20.4% appeared before the parole board and were denied parole throughout their sentence.
- 49.9% were granted parole at some time during their sentence.
Note:
*Data include only those offenders who commenced their determinate sentence during the fiscal year indicated (April 1 to March 31 of the following year) and had completed their sentence by March 31, 2009.
|
Year that Determinate Sentence Commenced |
|||||||||
|---|---|---|---|---|---|---|---|---|---|---|
1998-99 |
1999-00 |
2000-01 |
2001-02 |
2002-03 |
||||||
|
# |
% |
# |
% |
# |
% |
# |
% |
# |
% |
Reviewed by Board |
3,197 |
78.8 |
2,887 |
77.1 |
2,727 |
74.9 |
2,441 |
69.7 |
2,471 |
70.3 |
Parole Granted |
2,314 |
57.0 |
2,084 |
55.6 |
1,902 |
52.2 |
1,689 |
48.2 |
1,754 |
49.9 |
Parole Denied |
883 |
21.8 |
803 |
21.4 |
825 |
22.6 |
752 |
21.5 |
717 |
20.4 |
Not Reviewed by Board* |
860 |
21.2 |
858 |
22.9 |
916 |
25.1 |
1,063 |
30.3 |
1,042 |
29.7 |
Total Sentences |
4,057 |
100.0 |
3,745 |
100.0 |
3,643 |
100.0 |
3,504 |
100.0 |
3,513 |
100.0 |
Source: National Parole Board.
Note:
*These are determinate sentences where the offender either waived all parole reviews, withdrew all parole applications, or postponed until statutory release.
Data include only those offenders who commenced their determinate sentence during the fiscal year indicated (April 1 to March 31 of the following year) and had completed their sentence by March 31, 2009.
The number of offenders granted temporary absences has decreased since 1999-00

Source: Correctional Service Canada.
- The number of offenders receiving escorted and unescorted temporary absences in 2008-09 has decreased since 1999-00.
- The number of offenders receiving work releases has decreased by 74.0%, from 822 in 1999-00 to 214 in 2008-09.
- The successful completion rates for work releases, escorted and unescorted temporary absences are consistently over 99%.
Note:
A temporary absence is permission given to an eligible offender to be away from the normal place of confinement for medical, administrative, community service, family contact, personal development for rehabilitative purposes, or compassionate reasons, including parental responsibilities.
A work release is a structure program of release of specified duration for work or community service outside the penitentiary, under the supervision of a staff member or other authorized person or organization.
These numbers depict the number of offenders who received at least one temporary absence permit (excluding those for medical purposes) or at least one work release. An offender may be granted more than one temporary absence permit or work release over a period of time.
Year |
Temporary Absences |
Work Releases |
||||
|---|---|---|---|---|---|---|
Escorted |
Unescorted |
|||||
|
# of Offenders |
# of Permits |
# of Offenders |
# of Permits |
# of Offenders |
# of Permits |
1999-00 |
3,502 |
40,595 |
1,161 |
7,357 |
822 |
2,139 |
2000-01 |
3,136 |
34,155 |
1,067 |
6,566 |
644 |
1,722 |
2001-02 |
2,873 |
29,998 |
825 |
5,130 |
589 |
1,332 |
2002-03 |
2,712 |
34,088 |
713 |
4,870 |
577 |
1,307 |
2003-04 |
2,688 |
38,048 |
708 |
4,097 |
475 |
1,017 |
2004-05 |
2,518 |
35,251 |
518 |
3,580 |
321 |
747 |
2005-06 |
2,568 |
37,074 |
500 |
3,044 |
352 |
986 |
2006-07 |
2,524 |
39,603 |
498 |
4,148 |
333 |
717 |
2007-08 |
2,504 |
41,434 |
465 |
3,779 |
294 |
596 |
2008-09 |
2,308 |
36,120 |
433 |
3,748 |
214 |
577 |
Source: Correctional Service Canada.
Note:
A temporary absence is permission given to an eligible offender to be away from the normal place of confinement for medical, administrative, community service, family contact, personal development for rehabilitative purposes, or compassionate reasons, including parental responsibilities.
A work release is a structure program of release of specified duration for work or community service outside the penitentiary, under the supervision of a staff member or other authorized person or organization.
These numbers depict the number of offenders who received at least one temporary absence permit (excluding those for medical purposes) or at least one work release. An offender may be granted more than one temporary absence permit or work release over a period of time.
Section E: Statistics on Special Applications of Criminal Justice
The number of detention reviews has fluctuated over the past five years

Source: National Parole Board.
- The number of initial detention reviews reached a peak in 1995-96, and has been fluctuating at a lower level in subsequent years.
- Out of 4,628 initial detention reviews since 1994-95, 92.0% have resulted in a decision to detain.
- In the last five years, 15 women have been referred for detention and 13 were detained.
- In 2008-09, Aboriginal offenders accounted for 19.6% of incarcerated offenders serving determinate sentences while they accounted for 40.1% of offenders referred for detention and 39.8% of offenders detained.
Note:
According to the Corrections and Conditional Release Act, an offender entitled to statutory release after serving two-thirds of the sentence may be held in custody until warrant expiry if it is established that the offender is likely to commit, before the expiry of sentence, an offence causing death or serious harm, a serious drug offence or a sex offence involving a child.
Outcome of Initial Detention Reviews |
|||||||||||
|---|---|---|---|---|---|---|---|---|---|---|---|
Year |
Detained |
Statutory Release |
Total |
Total |
|||||||
Abor. |
Non - Abor |
Total |
% |
Abor. |
Non - Abor |
Total |
% |
Abor |
Non - Abor |
||
1994-95 |
96 |
314 |
410 |
92.3 |
8 |
26 |
34 |
7.7 |
104 |
340 |
444 |
1995-96 |
143 |
341 |
484 |
91.3 |
13 |
33 |
46 |
8.7 |
156 |
374 |
530 |
1996-97 |
106 |
325 |
431 |
93.3 |
10 |
21 |
31 |
6.7 |
116 |
346 |
462 |
1997-98 |
78 |
234 |
312 |
93.1 |
9 |
14 |
23 |
6.9 |
87 |
248 |
335 |
1998-99 |
80 |
154 |
234 |
91.4 |
3 |
19 |
22 |
8.6 |
83 |
173 |
256 |
1999-00 |
80 |
128 |
208 |
93.7 |
3 |
11 |
14 |
6.3 |
83 |
139 |
222 |
2000-01 |
68 |
147 |
215 |
93.9 |
6 |
8 |
14 |
6.1 |
74 |
155 |
229 |
2001-02 |
72 |
185 |
257 |
94.5 |
2 |
13 |
15 |
5.5 |
74 |
198 |
272 |
2002-03 |
81 |
164 |
245 |
86.3 |
14 |
25 |
39 |
13.7 |
95 |
189 |
284 |
2003-04 |
69 |
210 |
279 |
92.1 |
8 |
16 |
24 |
7.9 |
77 |
226 |
303 |
2004-05 |
69 |
156 |
225 |
91.1 |
6 |
16 |
22 |
8.9 |
75 |
172 |
247 |
2005-06 |
73 |
160 |
233 |
89.3 |
11 |
17 |
28 |
10.7 |
84 |
177 |
261 |
2006-07 |
66 |
156 |
222 |
88.8 |
4 |
24 |
28 |
11.2 |
70 |
180 |
250 |
2007-08 |
85 |
163 |
248 |
93.2 |
6 |
12 |
18 |
6.8 |
91 |
175 |
266 |
2008-09 |
102 |
154 |
256 |
95.9 |
5 |
6 |
11 |
4.1 |
107 |
160 |
267 |
Total |
1,268 |
2,991 |
4,259 |
92.0 |
108 |
261 |
359 |
8.0 |
1,376 |
3,252 |
4,628 |
Source: National Parole Board.
Note:
According to the Corrections and Conditional Release Act, an offender entitled to statutory release after serving two-thirds of the sentence may be held in custody until warrant expiry if it is established that the offender is likely to commit, before the expiry of sentence, an offence causing death or serious harm, a serious drug offence or a sex offence involving a child.
83% of judicial review hearings result in earlier parole eligibility

Source: Correctional Service Canada.
- Since the first judicial review hearing in 1987, there have been a total of 173 court decisions.
- Of these cases, 82.7% of the court decisions resulted in a reduction of the period that must be served before parole eligibility.
- Of offenders eligible to apply for a judicial review, 17.5% have had decisions rendered by the courts.
- Of the 143 offenders who have had their parole eligibility date moved closer, 140 have reached their revised eligibility date. Of these offenders, 130 have been released on parole, and 101 are currently being actively supervised in the community*.
- A higher percentage of second degree (86%) than first degree (82%) murder cases have resulted in a reduction of the period required to be served before parole eligibility.
Note:
*Of the 130 offenders who have been released on parole, 14 offenders have been returned to custody, 11 offenders are deceased, one is on bail and three offenders have been deported.
Judicial review is an application by an offender convicted of murder to the Court for a reduction in the time required to be served before being eligible for parole. Offenders can apply when they have served at least 15 years of their sentence. Judicial review procedures apply to offenders convicted of first degree murder, who are required to serve 25 years prior to being eligible for parole, and to offenders who have been sentenced to life imprisonment for second degree murder, with parole eligibility set at 15 years or more.
Province/Territory |
Parole Ineligibility Reduced |
Reduction Denied by Court |
Total |
|||
|---|---|---|---|---|---|---|
1st degree murder |
2nd degree murder |
1st |
2nd |
1st |
2nd |
|
Northwest Territories |
0 |
0 |
0 |
0 |
0 |
0 |
Nunavut |
0 |
0 |
0 |
0 |
0 |
0 |
Yukon |
0 |
0 |
0 |
0 |
0 |
0 |
Newfoundland & Labrador |
0 |
0 |
0 |
0 |
0 |
0 |
Prince Edward Island |
0 |
0 |
0 |
0 |
0 |
0 |
Nova Scotia |
0 |
1 |
1 |
0 |
1 |
1 |
New Brunswick |
1 |
0 |
0 |
0 |
1 |
0 |
Quebec |
58 |
15 |
5 |
2 |
63 |
17 |
Ontario |
21 |
0 |
10 |
1 |
31 |
1 |
Manitoba |
7 |
2 |
1 |
0 |
8 |
2 |
Saskatchewan |
6 |
0 |
2 |
0 |
8 |
0 |
Alberta |
16 |
0 |
4 |
0 |
20 |
0 |
British Columbia |
15 |
1 |
4 |
0 |
19 |
1 |
Sub-total |
124 |
19 |
27 |
3 |
151 |
22 |
Total |
143 |
30 |
173 |
|||
Source: Correctional Service Canada.
Note:
These numbers represent total decisions as of April 12, 2009.
Judicial reviews are conducted in the province where the conviction took place.
The number of dangerous offender designations has stabilized over the past four years

Source: Correctional Service Canada.
- As of April 12, 2009, there have been 488 offenders designated as Dangerous Offenders (DOs) since 1978. 78% have at least one current conviction for a sexual offence.
- There are 415 DOs currently active, and of these, 99% have indeterminate sentences.
- Of the 415 active DOs, 395 were incarcerated (representing approximately 3% of the total federal inmate population), one has been deported, one has escaped, one was on temporary detention and 17 were being supervised in the community.
- There are currently no female offenders with a Dangerous Offender designation.
- Aboriginal offenders account for 24.0% of DOs and 17.2% of the total federal offender population.
Note:
*The number of Dangerous Offenders designated per year does not include overturned decisions.
The graph above is based on a snapshot of the population taken on April 12, 2009. On this date, there was an active offender who received his Dangerous Offender designation on April 3, 2009. This offender is not represented in the graph, but is included in the table on the next page.
Offenders who have died since receiving designations are no longer classified as "active"; however, they are still represented in the above graph, which depicts the total number of offenders '"designated".
Dangerous Offender legislation came into effect in Canada on October 15, 1977, replacing the Habitual Offender and Dangerous Sexual Offender provisions that were abolished. A Dangerous Offender (DO) is an individual given an indeterminate sentence on the basis of a particularly violent crime or pattern of serious violent offences where it is judged that the offender's behaviour is unlikely to be inhibited by normal standards of behavioural restraint (see section 752 of the Criminal Code of Canada). Until August 1997, a determinate sentence was possible for those designated as DOs. In addition to the DOs, there remain within federal jurisdiction 41 Dangerous Sexual Offenders and 9 Habitual Offenders.
Province/Territory of Designation |
All Designations (# designated since 1978) |
Active Dangerous Offenders |
||
|---|---|---|---|---|
# of Indeterminate Offenders |
# of Determinate Offenders |
Total |
||
Newfoundland & Labrador |
11 |
9 |
0 |
9 |
Nova Scotia |
17 |
15 |
0 |
15 |
Prince Edward Island |
0 |
0 |
0 |
0 |
New Brunswick |
8 |
7 |
0 |
7 |
Quebec |
55 |
50 |
1 |
51 |
Ontario |
199 |
166 |
1 |
167 |
Manitoba |
9 |
8 |
0 |
8 |
Saskatchewan |
40 |
34 |
1 |
35 |
Alberta |
38 |
31 |
0 |
31 |
British Columbia |
105 |
85 |
1 |
86 |
Yukon |
1 |
1 |
0 |
1 |
Northwest Territories |
5 |
5 |
0 |
5 |
Nunavut |
0 |
0 |
0 |
0 |
Total |
488 |
411 |
4 |
415 |
Source: Correctional Service Canada.
Note:
Numbers presented are as of April 12, 2009.
The number of Dangerous Offenders declared per year does not include overturned decisions.
Offenders who have died since receiving designations are no longer classified as "active"; however, they are still represented in the total number of offenders "designated".
Most long term supervision orders are for a 10-year period

Source: Correctional Service Canada.
- As of April 12, 2009, the courts have imposed 577 long term supervision orders. Of these, 71.4% were for a period of 10 years.
- There are currently 549 offenders with long term supervision orders, and of these, 394 (71.8%) have at least one current conviction for a sexual offence.
- There are six women with long term supervision orders.
- There are currently 290 offenders being supervised in the community on their long term supervision order. This includes 25 offenders temporarily detained, four offenders who have been deported and three offenders unlawfully at large.
Note:
Long Term Supervision Order (LTSO) legislation, which came into effect in Canada on August 1, 1997, allows the court to impose a sentence of two years or more for the predicate offence and order that the offender be supervised in the community for a further period not exceeding 10 years.
Seventeen offenders under these provisions have died, nine offenders have completed their long term supervision period and one has been declared a Dangerous Offender.
Province or Territory of Order |
Length of Supervision Order (years) |
Current Status |
||||||||||||
|---|---|---|---|---|---|---|---|---|---|---|---|---|---|---|
2 |
3 |
4 |
5 |
6 |
7 |
8 |
10 |
Total |
Incarcerated |
DP, FP |
LTSO period |
LTSO** interrupted |
Total |
|
Newfoundland |
0 |
0 |
0 |
0 |
0 |
0 |
0 |
5 |
5 |
1 |
0 |
3 |
1 |
5 |
Nova Scotia |
0 |
0 |
0 |
3 |
0 |
0 |
0 |
10 |
13 |
4 |
0 |
8 |
1 |
13 |
Prince Edward Island |
0 |
0 |
0 |
1 |
0 |
0 |
0 |
1 |
2 |
0 |
0 |
0 |
0 |
0 |
New Brunswick |
0 |
1 |
0 |
1 |
0 |
0 |
1 |
5 |
8 |
3 |
0 |
3 |
2 |
8 |
Quebec |
0 |
1 |
0 |
33 |
6 |
16 |
5 |
107 |
168 |
78 |
7 |
69 |
6 |
160 |
Ontario |
0 |
0 |
1 |
7 |
4 |
12 |
10 |
122 |
156 |
55 |
5 |
81 |
7 |
148 |
Manitoba |
0 |
0 |
0 |
1 |
1 |
2 |
1 |
21 |
26 |
9 |
1 |
14 |
1 |
25 |
Saskatchewan |
1 |
0 |
1 |
9 |
5 |
2 |
6 |
25 |
49 |
33 |
2 |
13 |
1 |
49 |
Alberta |
0 |
0 |
0 |
7 |
1 |
0 |
1 |
36 |
45 |
16 |
5 |
19 |
0 |
40 |
British |
0 |
0 |
0 |
7 |
3 |
4 |
4 |
73 |
91 |
41 |
5 |
39 |
2 |
87 |
Yukon |
0 |
0 |
0 |
1 |
0 |
2 |
0 |
3 |
6 |
1 |
1 |
4 |
0 |
6 |
Northwest Territories |
0 |
0 |
0 |
1 |
0 |
0 |
0 |
2 |
3 |
1 |
0 |
1 |
1 |
3 |
Nunavut |
0 |
0 |
0 |
2 |
0 |
0 |
1 |
2 |
5 |
3 |
0 |
2 |
0 |
5 |
Total |
1 |
2 |
2 |
73 |
20 |
38 |
29 |
412 |
577 |
245 |
26 |
256 |
22 |
549 |
Source: Correctional Service Canada.
Note:
*This category includes offenders whose current status is either supervised on day parole (DP), full parole (FP) or statutory release (SR).
**This category includes offenders convicted of a new offence while on the supervision portion of an LTSO. When this occurs, the LTSO supervision period is interrupted until the offender has served the new sentence to its warrant expiry date. At that time, the LTSO supervision period resumes where it left off.
These numbers are as of April 12, 2009.
Seventeen offenders under these provisions have died, 10 offenders have completed their long term supervision period and one has been declared a Dangerous Offender.
The number of pardon applications processed has increased

Source: National Parole Board.
- The number of pardon applications processed increased from 25,021 in 2007-08 to 40,428 in 2008-09.
- About 98% of the applications for pardons that were processed last year were granted.
- Approximately 3.8 million Canadians have a criminal record*, but less than 11% of people convicted have received a pardon. Since 1970, when the pardon process began, 417,105 pardons have been granted or issued.
Note:
*Source: Royal Canadian Mounted Police Criminal Records Division, 2009.
Pardons allow people who were convicted of a criminal offence but have completed their sentence and demonstrated that they are law-abiding citizens to have their criminal record sealed. A person convicted of a summary offence may apply for a pardon three years after the completion of the sentence, and a person convicted of an indictable offence may apply after five years.
Type of Decision |
2004-05 |
2005-06 |
2006-07 |
2007-08 |
2008-09 |
|---|---|---|---|---|---|
Granted |
17,800 |
3,951 |
7,076 |
14,514 |
30,317 |
Issued |
4,745 |
4,402 |
7,672 |
10,332 |
9,311 |
Denied |
375 |
196 |
103 |
175 |
800 |
Total Granted/Issued/Denied |
22,920 |
8,549 |
14,851 |
25,021 |
40,428 |
Percentage Granted/Issued |
98.4 |
97.7 |
99.3 |
99.3 |
98.0 |
Revocations* |
225 |
79 |
133 |
34 |
123 |
Cessations |
332 |
377 |
2,264 |
547 |
584 |
Total Revocations/Cessations |
557 |
456 |
2,397 |
581 |
707 |
Cumulative Granted/Issued** |
329,530 |
337,883 |
352,631 |
377,477 |
417,105 |
Cumulative Revocations/Cessations** |
11,151 |
11,607 |
14,004 |
14,585 |
15,292 |
Source: National Parole Board.
Note:
*Revocations fluctuate due to resource re-allocation to deal with backlogs.
**Cumulative data reflects pardon activity since 1970, when the pardon process was established under the Criminal Records Act.
Pardons are issued for summary offences, upon application, following a three-year conviction-free period after the completion of the sentence. In cases of indictable offences, pardons are granted at the discretion of the National Parole Board (NPB) following a five-year period of good conduct after the completion of the sentence. The cessation of a pardon automatically occurs following a subsequent conviction for an indictable offence or hybrid offence, with some exceptions, including impaired driving, driving with more than 80 mg of alcohol in the blood or fail to provide a breath sample. Revocations are at the discretion of the NPB following a subsequent summary conviction, or for lack of good conduct. The Board may also render a decision of cessation when it is convinced by new information that the person was not eligible for a pardon at the time it was awarded.
- Date modified: