Online safety and cyberbullying: youth and parent perspectives in Canada (2019 to 2024)
Table of contents
Plain language summary
This booklet provides a summary of youth and parent views on cyberbullying in Canada, based on a public opinion survey conducted in 2024 by Public Safety Canada. It raises awareness about the occurrence of cyberbullying and how it affects people. Key takeaways include:
- Youth feel less safe online—only about 3 in 10 say they feel safe, and even fewer parents think their kids are safe in digital spaces in 2024.
- Youth are learning about cyberbullying through personal experience—while schools and teachers are still the primary source of information on cyberbullying, more youth are encountering it directly as victims.
- More youth are admitting to cyberbullying others—the percentage has nearly doubled in recent years.
Introduction
This booklet shares findings from the Cyberbullying Public Awareness Research 2024 surveyFootnote 1 and report commissioned by Public Safety Canada. It includes data from 2019, 2022 and 2024, showing how youthFootnote 2 and parent knowledge, awareness and behaviours around cyberbullying have changed over time.
Youth aged 14 to 17 made up the largest group of respondents in all three data collection periods. Boys/young men and girls/young women were almost equally represented. Detailed information on the respondent profile is presented in Annex B.
This booklet contextualizes survey results within broader research on cyberbullying in Canada. Findings are organized into three themes:
- Perceptions of safety and online activities
- Views on cyberbullying
- Perpetrating cyberbullying
Findings
Perceptions of safety and online activities
Understanding online safety requires considering both youth perspectives and parents' perceptions of online risks and experiences. Research on cyberbullying indicates that caregivers often lack a clear understanding of their children's online activities, and in some cases, they perceive risks as greater than youth do.Footnote 3 This disconnect can influence how families respond to cyberbullying and affect the success of prevention strategies.
The next section presents key findings on youth and parent views of online safety, as well as how youth use the internet for socializing and other activities.
Online activities, including social interaction
In 2024, 55% of youth reported using the internet several times a day for social interactions—an increase of 3% since 2019. In contrast, few reported using it once a day (6%), a few times a week (2%), or once a week or less (1%).
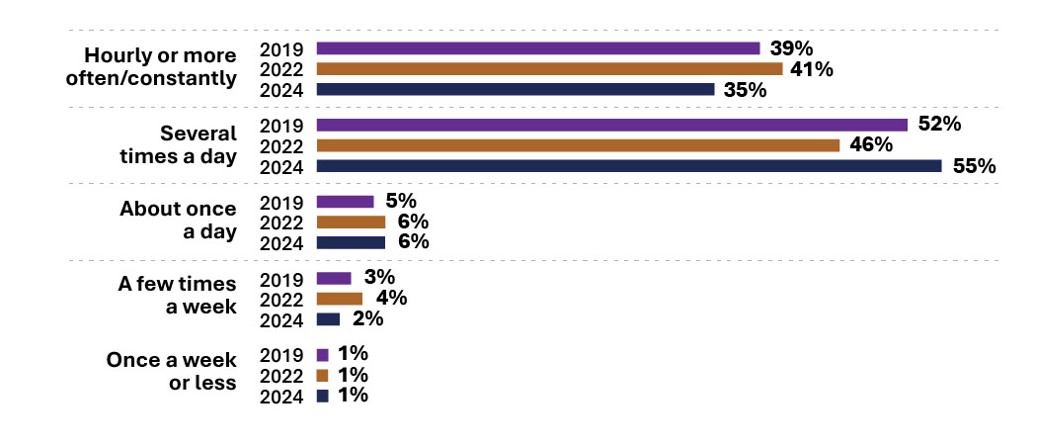
Figure 1: Image description
Grouped bar chart showing how often youth used the internet for social interaction in 2019, 2022, and 2024. Across all years, the most common frequency was using the internet several times a day, with the highest rate in 2024. The second most common was using it hourly or more often/constantly. Full data provided in Table 1 below.
Internet use |
2019 |
2022 |
2024 |
|---|---|---|---|
Hourly or more often/constantly |
39% |
41% |
35% |
Several times a day |
52% |
46% |
55% |
About once a day |
5% |
6% |
6% |
A few times a week |
3% |
4% |
2% |
Once a week or less |
1% |
1% |
1% |
While most online activities were viewed positively by youth, their experiences varied by platform. In 2024, texting and messaging were rated the most positive (82%), followed by gaming (69%), and using social media (60%).
Notably, reports of positive gaming experiences among youth increased from 57% in 2022 to 69% in 2024.
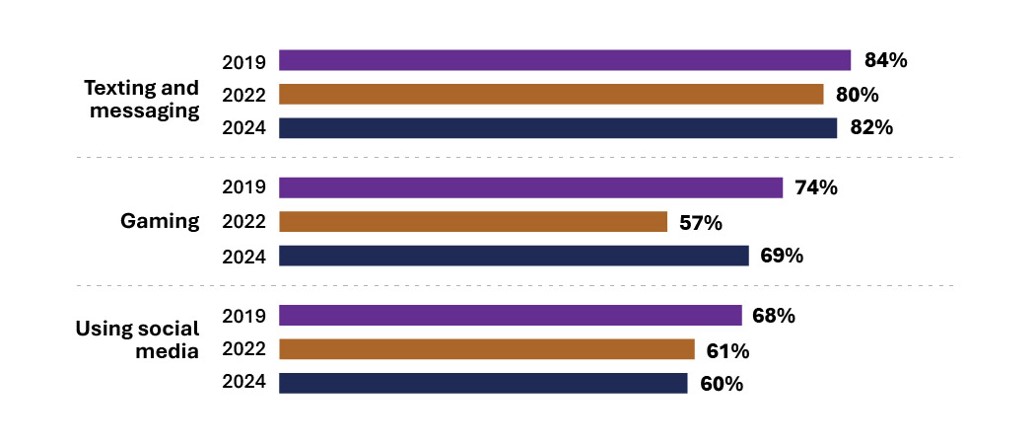
Figure 2: Image description
Grouped bar chart showing youth's positive impressions of online social activities in 2019, 2022, and 2024. Texting and messaging received the highest positive impressions across all years, followed by gaming, then social media. Full data provided in Table 2 below.
Location |
2019 |
2022 |
2024 |
|---|---|---|---|
Texting and messaging |
84% |
80% |
82% |
Gaming |
74% |
57% |
69% |
Using social media |
68% |
61% |
60% |
Safety by location
In 2024, fewer youth reported that they felt safe online (29%), compared to feeling safe in their neighborhood (34%), at work (37%), school (42%), and at home (84%).
Youth's feelings of safety have declined since 2019—most notably in schools and workplaces.
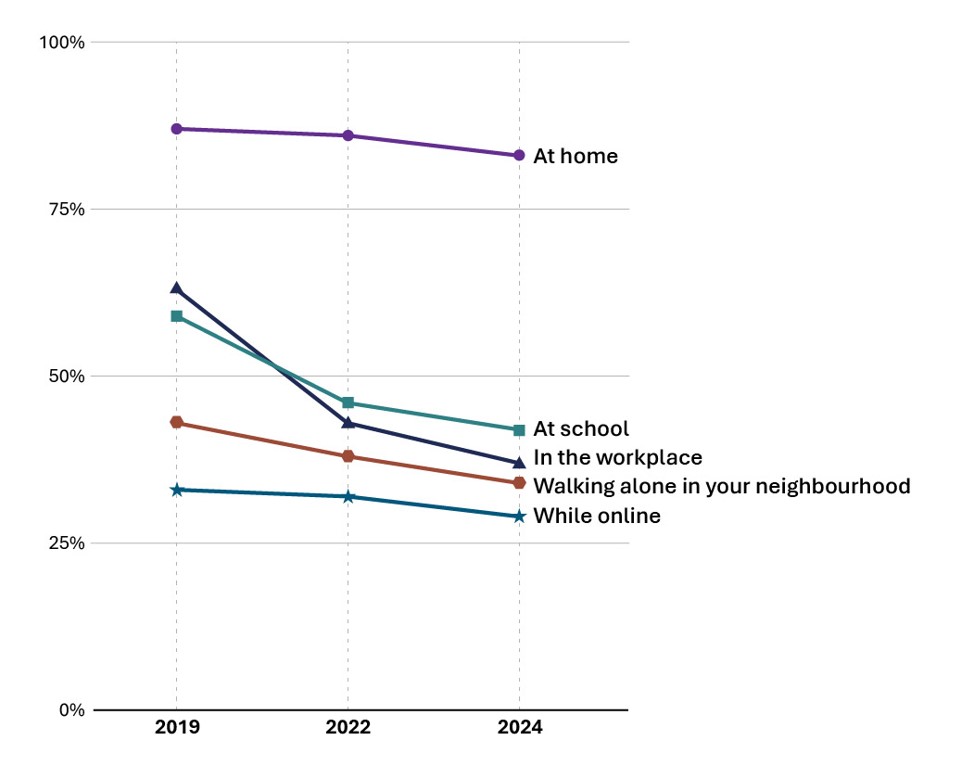
Figure 3: Image description
Line graph showing youth's perceptions of safety in various locations in 2019, 2022, and 2024. In all years, youth reported feeling safest at home and least safe while online. Full data provided in Table 3 below.
Location |
2019 |
2022 |
2024 |
|---|---|---|---|
At home |
87% |
86% |
83% |
At school |
59% |
46% |
42% |
In the workplace |
63% |
43% |
37% |
Walking alone in your neighbourhood |
43% |
38% |
34% |
While online |
33% |
32% |
29% |
In 2024, only 14% of parents believed that their child felt safe online. However, more parents believed their child felt safe in key environments like work (37%), in their neighbourhood (38%), at school (45%), and at home (88%).
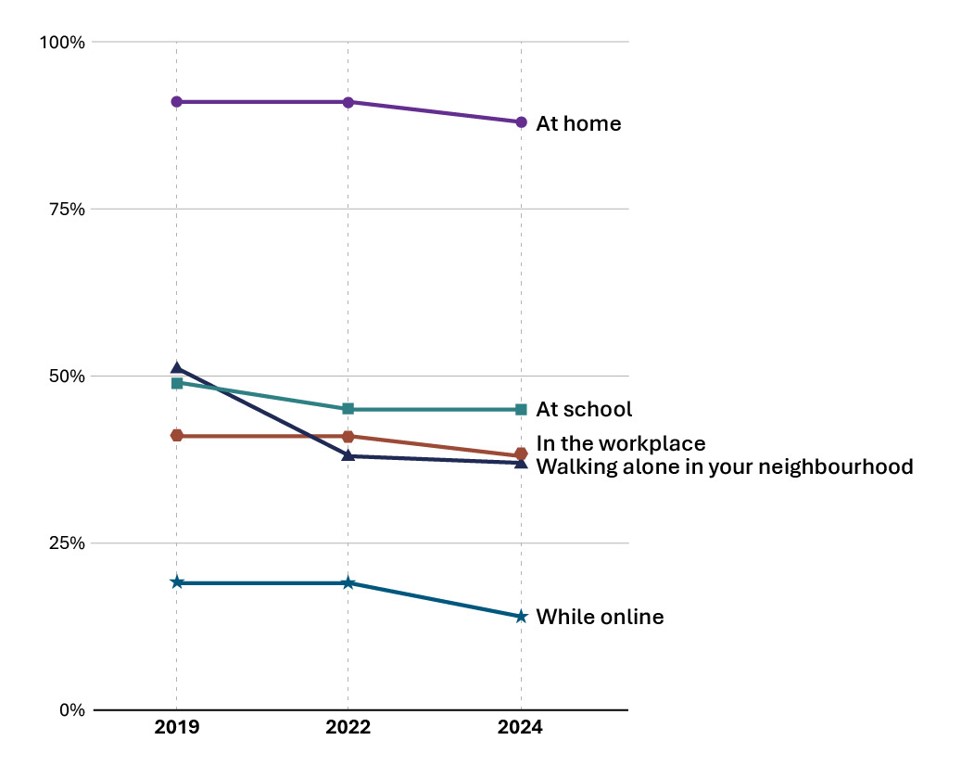
Figure 4: Image description
Line graph showing parents' perceptions of their children's safety in various locations in 2019, 2022, and 2024. Across all years, parents reported that their children were safest at home and least safe online. Full data provided in Table 4 below.
Location |
2019 |
2022 |
2024 |
|---|---|---|---|
At home |
91% |
91% |
88% |
At school |
49% |
45% |
45% |
In the workplace |
51% |
38% |
37% |
Walking alone in your neighbourhood |
41% |
41% |
38% |
While online |
19% |
19% |
14% |
Spotlight! Youth versus parent perceptions of online safety
Online spaces were perceived as the least safe location by both youth and their parents. Only 29% of youth reported feeling safe online, while just 14% of parents believed their children were safe in these spaces. Further research is needed to identify effective strategies for digital literacy programs, safety tools, and clear guidelines that support positive and secure online behaviour among youth.
Views on cyberbullying
Historically, the literature has shown that prevention programs were almost exclusively delivered in school settings, with minimal parental involvement and no initiatives specifically designed for families.Footnote 4 While schools remain an important source of information, youth have reported a decline in school-based education on cyberbullying over time.
This section explores how youth and parents perceive cyberbullying, with particular attention to youth awareness and their sources of information.
Awareness of cyberbullying
Awareness of cyberbullying was high in 2024, with 65% of youth and 51% of parents reporting strong familiarity with the issue; only 1% of youth and parents said they were unaware or had never heard of it. Youth who used the internet at least once an hour were especially likely to report high awareness.
Despite this awareness, perceptions of cyberbullying seriousness have shifted over time. While most youth still considered cyberbullying as a serious issue, fewer felt this way in 2024 (65%) compared to 2019 (73%). Parents, meanwhile, have consistently expressed higher concern over cyberbullying than youth, with 75% viewing it as serious in 2024.
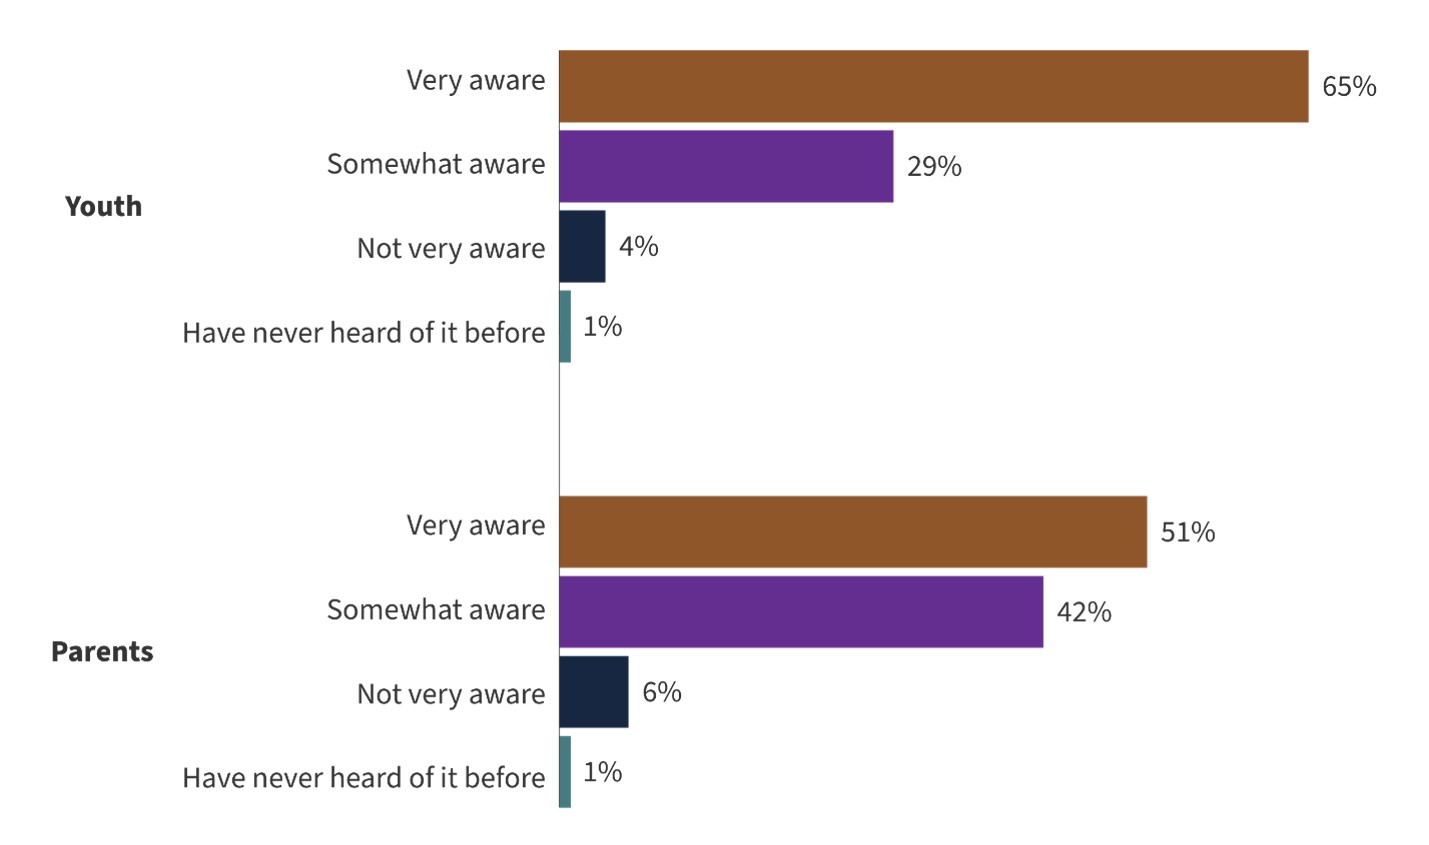
Figure 5: Image description
Two bar charts comparing 2024 survey results on awareness of cyberbullying among youth and parent groups. Youth reported higher awareness of cyberbullying compared to parents. Full data provided in Table 5 below.
Awareness of cyberbullying |
Youth |
Parents |
|---|---|---|
Very aware |
65% |
51% |
Somewhat aware |
29% |
42% |
Not very aware |
4% |
6% |
Have never heard of it before |
1% |
1% |
In 2024, fewer youth reported receiving information about cyberbullying from schools and teachers (69%), compared to 2019 (78%). Similarly, fewer youth were learning about cyberbullying from sources like news stories and public service announcements in 2024 (39%) than in 2019 (57%).
Over time, more youth have reported that their understanding of cyberbullying came from direct victimization. Between 2022 and 2024, this proportion increased from 20% to 25%, suggesting that awareness is increasingly linked to harmful personal experiences rather than proactive education.
Meanwhile, the proportion of youth who reported learning about cyberbullying from friends or acquaintances who had been cyberbullied fluctuated between 2019 and 2024.
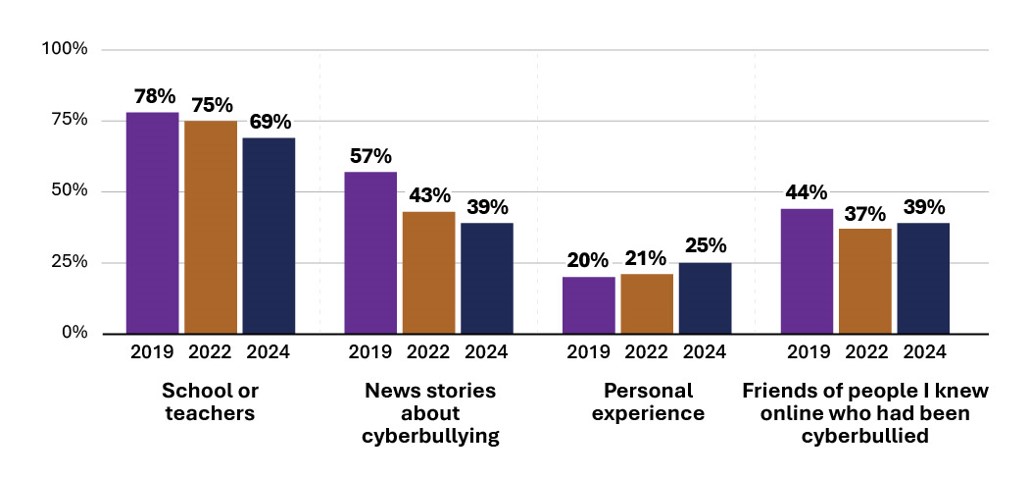
Figure 6: Image description
Grouped bar chart showing different sources of cyberbullying information among youth in 2019, 2022, and 2024. Across all years, schools and teachers were the most consistent source of information, followed by news stories. Full data provided in Table 6 below.
Location |
2019 |
2022 |
2024 |
|---|---|---|---|
School or teachers |
78% |
75% |
69% |
News stories about cyberbullying |
57% |
43% |
39% |
Personal experience |
20% |
21% |
25% |
Friends of people I knew online who had been cyberbullied |
44% |
37% |
39% |
Perpetrating cyberbullying
The following section looks at the proportion of youth survey respondents who may have perpetrated cyberbullying. It's important to note that definitions of cyberbullying vary between studies, making it difficult to determine rates of cyberbullying perpetration in Canada.Footnote 5
Some studies report that between 6% and 10% of youth admit to cyberbullying, while others report 24% to 26%.Footnote 6 While results of the current survey fall within this range (15% in 2024), the variability across studies makes it hard to determine the actual prevalence of cyberbullying perpetration by youth in Canada. The specific definition of cyberbullying used in the current study can be found in Annex A.
Increases in perpetration over time
The proportion of youth who reported cyberbullying perpetration has steadily increased over the years. In 2019, just 8% of youth reported cyberbullying perpetration. This proportion increased to 11% in 2022. By 2024, 15% of youth reported cyberbullying perpetration.
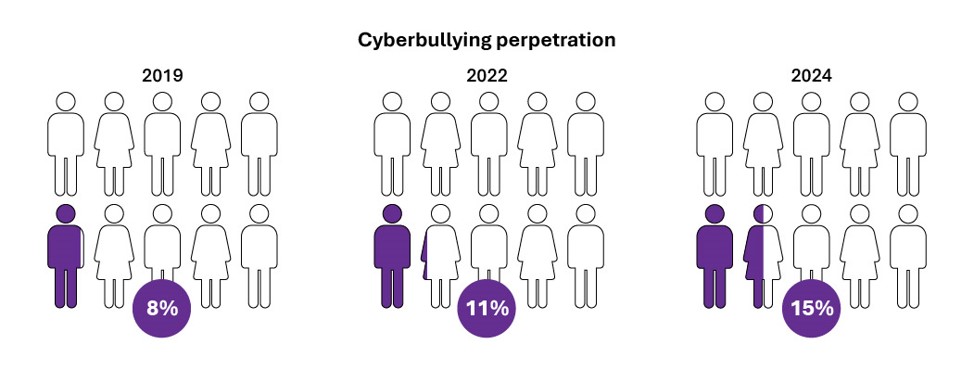
Figure 7: Image description
Three pictograms, one for each year—2019, 2022, and 2024—showing the proportion of youth who self-reported perpetrating cyberbullying. The proportion of cyberbullying perpetration increased steadily from 8% in 2019 to 15% in 2024. Full data provided in Table 7 below.
2019 |
2022 |
2024 |
|
|---|---|---|---|
Cyberbullying perpetration |
8% |
11% |
15% |
Key takeaways
Based on the Cyberbullying Public Awareness Research 2024 survey data and report, three key takeaways emerged:
- Youth feel less safe online: In 2024, only 29% of youth said they felt a sense of safety online (compared to 33% in 2019), while just 14% of parents believed their children were safe in online spaces (compared to 19% in 2019).
- More youth are learning about cyberbullying through victimization: While schools remain the main source of cyberbullying information in 2024 (69%), this has declined over time. Meanwhile, the amount of youth learning about cyberbullying through being victimized rose from 20% in 2022 to 25% in 2024.
- Cyberbullying perpetration is rising: Self-reported perpetration among youth nearly doubled from 8% in 2019 to 15% in 2024, which may indicate an increase in harmful online behaviours.
Annex A: Key terms
- Cyberbullying
- Refers to the use of computers, smart phones, and other devices to embarrass, harass, threaten, torment, or humiliate someone. Cyberbullying includes teasing; name-calling; flaming or bashing individuals; spreading rumours and/or private information (including intimate pictures), or fake information online; harassment; threatening messages; stalking; or pretending to be someone.Footnote 7
- Gender Diverse
- An umbrella term for people who embrace a wider and more flexible range of gender identity and/or expression possibilities that differ from their assigned sex at birth or those typically associated with the binary gender system (e.g., non-binary, gender fluid, gender creative, gender non-conforming).Footnote 8
- Victim
- In the context of cyberbullying, a victim is a person who has suffered physical or emotional harm, property damage, or economic loss as a result of being cyberbullied.Footnote 9
- Youth
- In the context of this survey, youth are young Canadians aged 10 to 24 years old.
Annex B: Respondent profile
Youth respondents
Age: Youth aged 14 to 17 made up the largest proportion of respondents (37%). The remaining participants were evenly distributed between ages 18 to 21 and 22 to 24.
Gender: Boys/young men (50%) and girls/young women (49%) were nearly equally represented. 1% of respondents identified as gender diverse.
Education: Most were in high school (34%) or had completed it (32%). Others were in college or technical school (17%), or university (15%).
Language: The majority of respondents (80%) reported English as their first language.
Parent respondents
Gender: Men (52%) and women (47%) were nearly equally represented. Fewer than 1% of respondents identified as gender diverse.
Education: 54% had a university degree (undergraduate or higher), 32% had a college diploma or technical certificate, and 13% had a high school diploma or less.
Income: 54% reported household incomes over $100,000; 32% between $40,000 and $100,000; and 6% less than $40,000.
Language: The majority of respondents (78%) reported English as their first language.
- Date modified: