Annual National Data Report to Inform Trends and Patterns in Drug-Impaired Driving 2022

Table of contents
- Tables and Figures
- Executive Summary
- Introduction
- The Legislative and Programmatic Context
- Trends and Patterns in Drug-Impaired Driving
- What is Being Done to Address Drug-Impaired Driving
- Prevention and Detection
- Law Enforcement Capacity Building
- Standardized Field Sobriety Test (SFST) Training
- Drug Recognition Expert (DRE) Training and Certification
- Approved Drug Screening Equipment (ADSE)
- Law Enforcement Interventions
- Standard Field Sobriety Testing
- Drug Recognition Evaluation
- Approved Drug Screening Equipment
- Blood Analyses
- Results
- Analysis and Conclusions
- References
Tables and Figures
- Table 1 - Driven a vehicle within 2 hours of smoking or vaping cannabis among past 12-month users, by province/territory, Canada, 2019-2021
- Table 2 - Driven a vehicle within 4 hours of using ingested cannabis products among past 12-month users, by province/territory, Canada, 2020 and 2021
- Table 3 - Trends in annual, police-reported, impaired-driving incidents in Canada (total, alcohol and drugs), 2009 - 2021
- Table 4 – Prevalence of Injured Drivers by Substance and Province (2018-2021; updated September 2022; n=7,019 drivers)
- Table 5 – Prevalence of injured drivers by Number of Substance and Province (2018-2021; updated September 2022; n=7,019 drivers)
- Table 6 – Number of SFST trained officers per year and average cost of training by province/territory, Canada, 2018-2021
- Table 6a – Total number and percentage of SFST trained officers by province/territory, Canada, 2019-2021
- Table 7 – Number of DRE trained and certified officers 2018 to 2021
- Table 7a – Number of active DREs in 2020 and 2021
- Table 8 – Number of ADSE purchased, 2018-2021
- Table 9 –Frequency of DRE Opinion Category by Province, RCMP national DEC data, 2018
- Table 10 – Frequency of DRE Opinion Category by Province, RCMP national DEC data, 2019
- Table 11 – Frequency of DRE Opinion Category by Province, RCMP national DEC data, 2020
- Table 12 – Frequency of DRE Opinion Category by Province, RCMP national DEC data, 2021
- Table 13 – Number of DID Laboratory Blood Analysis Requests by Type and Province, 2019-2021
- Table 14 – Per Se Limit Drug Frequency, 2019-2020
- Table 15 – THC Blood Drug Concentration, 2019-2021
- Table 16 – Drug Category Frequency 2019-2021
- Table 17 – Drug-Impaired Driving Charges in Canada, Pre-Legalization (2015-2017) and Post-Legalization (2019-2021), By Age Group
- Table 18 – Administrative Sanctions, Ontario, 2018-2021
- Figure 1 – Trends in annual, police-reported, impaired-driving incidents in Canada (alcohol and drugs)
- Figure 2 – Total Drug Recognition Expert (DRE) Operational Evaluations (annual)
- Figure 3 – Average Number of Evaluations per DRE (annual)
- Figure 4 - DRE Evaluations: Frequency of Opinion Categories, Canada, 2021
Executive Summary
In the context of cannabis legalization, the Government of Canada introduced legislation to create new offences and provide additional tools to law enforcement to detect and deter drug-impaired driving (DID). Furthermore, to support the implementation of this new legislative framework, the Government invested $161M over five years initially to enhance training of frontline law enforcement officers in how to recognize the signs and symptoms of drug-impaired driving, build law enforcement capacity across the country, provide access to approved drug screening equipment (ADSE), develop policy, bolster research, and raise public awareness about the dangers of drug-impaired driving. An important part of this initiative is to inform Canadians on activities undertaken to address DID and their results. It is the purpose of this annual report.
This is the third annual report on trends and patterns in DID. It is produced in cooperation with the provinces and territories, the RCMP, CBSA, and other partner agencies and stakeholders.
Whenever possible, it updates data from the 2021 report. However, as in 2020, the COVID-19 pandemic resulted in a significant reduction in planned activities, in particular the training of law enforcement officers. Nevertheless, the report's findings show that the federal initiative has continued to enhance law enforcement capacity to detect and deter DID. It has also continued to change Canadians' attitudes towards driving after cannabis use. Furthermore, data from police and border-reported incidents as well as toxicological analyses among injured and fatally injured drivers indicates that the number of incidents involving drivers with drugs in their system, including cannabis, has been constantly increasing since 2008 as a proportion of all impaired driving incidents.
Work to improve the completeness and comparability of data has continued in 2021. As a result, more data is now collected on the use and results of standardized field sobriety testing, more data on injured drivers is now available, and data from the use of approved drug screening equipment as well as coroners and medical examiners is also gradually improving.
Introduction
In spite of significant declines over the past 30 years, impaired driving, whether by alcohol or drugs, continues to kill or injure more Canadians than any other crime (Moreau, 2021). It also remains the single most important factor contributing to serious road crashes (CCSA, 2019). Furthermore, while the number of police reported drug-impaired driving (DID) incidents was stable between 2020 and 2021, they had increased by 19% from 2019 to 2020.
It is no surprise then that with the legalization of cannabis, Canadians expressed concerns over road safety. Public opinion surveys showed that well over 80% of Canadians believed that DID would likely increase as a result of cannabis legalizationFootnote 1.
Canadians continue to be concerned over road safety as a result of cannabis legalization. Public Safety Canada has commissioned public opinion research on Canadians' attitudes, perceptions and behavior relating to cannabis and driving since 2017. The 2022 reportFootnote 2 shows that over half (56%; an increase from 49% in 2020) of Canadians perceive that the rate of driving while under the influence of cannabis has increased since legalization, and most are concerned (41%) or moderately concerned (31%) about others on the road who are driving under the influence of cannabis. However, alcohol remains a greater concern, with 95% agreeing that drinking alcohol impairs driving. Nearly nine in ten (86%; consistent with 2020 and an increase from 81% in 2017) agree that using cannabis also impairs one's driving ability. Four in five (80%) say that cannabis impacts reaction time and ability to concentrate and nearly two in three (67%) say that cannabis makes the user a worse driver. Nearly one in four (24%) continue to say that driving under the influence of cannabis is less dangerous than driving under the influence of alcohol.
In a survey conducted in March-April 2022 with a sample of 1567 Albertans, including 637 who had used cannabis in the past 12 months, 52% of respondents said they were concerned about drug-impaired driving, with older persons (55+) being significantly more concerned (68%) than younger ones (18-34; 36%).Footnote 3 Furthermore, only 28% of past 12-month cannabis users indicated being concerned about drug-impaired driving. Some 83% consider that cannabis impairs driving abilities (90% among non-users, 75% among users).
In part as a result of concerns over road safety at the time of cannabis legalization, Criminal Code provisions were enacted in 2018 to criminalize driving with prohibited levels of certain drugs, strengthen penalties and provide additional tools and means to law enforcement to detect and deter impaired driving, including DID. Furthermore, in September 2017, in response to Canadians' concerns over impaired driving, the federal government announced $161 million in funding for training frontline officers in how to recognize the signs and symptoms of drug-impaired driving, building law enforcement capacity across the country, providing access to approved drug screening equipment (ADSE), developing policy, bolstering research, and raising public awareness about the dangers of drug-impaired driving.
Part of this initiative included a commitment to report to Canadians on trends in DID, activities undertaken to address the issue, and their results; it is the purpose of this report.
The report focuses on three broad questions:
- What can we say about trends and patterns in DID?
- What is being done to address DID?
- What are the results of these actions?
This report is the result of a collective effort undertaken in 2018 by the Federal/Provincial and Territorial (FPT) working group (WG) on DID. Comprised of representatives from all jurisdictions, as well as key stakeholders from the Department of Justice Canada (DOJ), the Royal Canadian Mounted Police (RCMP), the Canada Border Services Agency (CBSA) and Transport Canada, the WG set out to work on identifying a series of indicators to help address these questions. The WG also engaged with Statistics Canada (STC) and with key expert organizations such as the Canadian Centre on Substance Use and Addictions (CCSA) as well as selected academics, to assess the relevance, reliability, availability and accessibility of data for these various indicators. In conducting this analysis, the WG benefitted from a comprehensive exercise undertaken by the CCSA to identify a set of national indicators on DID. The WG agreed on a preliminary set of indicators in spring 2019, which was further refined in September 2019. Subsequently, jurisdictions were asked to collect, collate, and report data on as many of these indicators as possible. The first annual trends and patterns report was published in 2020 and covered the 2019 calendar year.
This report presents data provided by provinces and territories, the RCMP and the CBSA for calendar year 2021. Data from reports and research studies from other sources (e.g., STC; CCSA) is also used.
The first section presents the key aspects of the legislative regime on DID adopted in 2018 and the accompanying federal initiative. The following sections present available data on trends and patterns in DID, action undertaken to prevent, detect and deter. DID, and results achieved. The conclusion summarizes the key findings and discusses next steps.
As every Canadian knows, the COVID-19 pandemic has profoundly affected our lives and activities since early 2020. It was no different for activities planned under this initiative. Although 2021 saw a gradual return to some normalcy, numerous activities continued to suffer the impacts of the pandemic. As a result, almost no training of law enforcement officers including border services officers (BSOs) was delivered during 2021. It is also likely that patterns in DID were affected by the general reduction in professional and social activities that required Canadians to use their vehicles. In addition, the closure of the Canada-United States land border, for at least a part of 2021, to all but essential traffic, has also presumably impacted enforcement data. In other words, albeit to a lesser degree than 2020, 2021 was another unusual year.
The Legislative and Programmatic Context
Driving while impaired by a drug has been a criminal offence since 1925, but this offence has always been challenging to prove in court.
Detecting and proving impairment caused by drugs is different and more complex than detecting and proving impairment caused by alcohol. Alcohol is a simple molecule with predictable impairing effects. As alcohol is consumed, blood alcohol concentration (BAC) rises; the higher the BAC, the more profound the impairment and the greater the risk of a serious road crash. The same correlation does not always exist for other drugs since their impairing effects and impacts on driving behaviour may vary depending on the substance, method of ingestion, and characteristics of the person and their consumption habits. In the case of cannabis, it is generally agreed that it can impair a person's ability to drive. However, there is no scientific consensus on the relationship between the concentration of Tetrahydrocannabinol (THC), its main psychoactive substance, in blood and the degree of impairment.Footnote 4
In 2008, new tools were authorized to facilitate the investigation of drug-impaired driving. These include the Standardized Field Sobriety Tests (SFST) used at the roadside (a three-pronged test consisting of walk and turn, one leg stand, and horizontal gaze nystagmus) and the Drug Recognition Evaluation conducted at the police station by a certified drug recognition expert (DRE). The Drug Recognition Evaluation is a 12–step evaluation that is designed to determine if the individual is impaired by a drug. To use either of these tools, the officer has to be specially trained in accordance with standards developed by the International Association of Chiefs of Police (IACP).
In the context of cannabis legalization, it was determined that more needed to be done to strengthen the criminal law regime with respect to drug-impaired driving. This was done as part of An Act to amend the Criminal Code (offences relating to conveyances) and to make consequential amendments to other Acts, which enacted new offences, and authorized new tools to enhance the detection and prosecution of drug-impaired drivers.
Specifically, the new measures:
- Authorize the police to use "approved drug screening equipment" (e.g., oral fluid drug screeners) at the roadside;
- Enact three new offences of having a prohibited blood drug concentration (BDC) within two hours of driving;
- Facilitate the ability of a police officer to demand a blood sample from a driver; and
- Permit a DRE to testify without requiring them to be qualified as an expert in every case, consistent with the 2017 Supreme Court of Canada decision in R v Bingley.
With the addition of the new offences, the text of the Criminal Code impaired driving offences currently reads as follows:
320.14 (1) Everyone commits an offence who
(a) operates a conveyance while the person's ability to operate it is impaired to any degree by alcohol or a drug or by a combination of alcohol and a drug;
(b) subject to subsection (5), has, within two hours after ceasing to operate a conveyance, a blood alcohol concentration that is equal to or exceeds 80 mg of alcohol in 100 mL of blood;
(c) subject to subsection (6), has, within two hours after ceasing to operate a conveyance, a blood drug concentration that is equal to or exceeds the blood drug concentration for the drug that is prescribed by regulation; or
(d) subject to subsection (7), has, within two hours after ceasing to operate a conveyance, a blood alcohol concentration and a blood drug concentration that is equal to or exceeds the blood alcohol concentration and the blood drug concentration for the drug that are prescribed by regulation for instances where alcohol and that drug are combined.
320.14 (4) Subject to subsection (6), everyone commits an offence who has, within two hours after ceasing to operate a conveyance, a blood drug concentration that is equal to or exceeds the blood drug concentration for the drug that is prescribed by regulation and that is less than the concentration prescribed for the purposes of paragraph (1)(c).
The prohibited BDC levels are not found in the Criminal Code, but instead, are set by regulation.Footnote 5 For paragraph 320.14(c), the prohibited BDC levels are 5 ng or more of THC per ml of blood, 5 mg of Gamma Hydroxybutyrate (GHB) per L of blood, and any detectable level of lysergic acid diethylamide (LSD), 6-Monoacetylmorphine (a metabolite of heroin), Ketamine, Phencyclidine (PCSP), Cocaine, Psilocybin, Psilocin and Methamphetamine in blood. For paragraph 320.14(d), the prohibited levels are a blood alcohol concentration of 50 mg of alcohol per 100 ml of blood in combination with 2.5 ng of THC per mL of blood. Finally, for subsection 320.14(4), the prohibited blood drug concentration (BDC) level is between 2 ng and 5 ng THC per ml of blood.
As noted, the Government authorized the use of approved drug screening equipment (ADSE) at the roadside.
ADSE can be used by police to detect the presence of some drugs in oral fluid, including THC. The police and BSOs can demand an oral fluid sample, if they have reasonable grounds to suspect a drug is in a driver's body. Reasonable suspicion that the driver has drugs in their body can be developed based on evidence of recent consumption of drugs and other objective facts, such as: red eyes, muscle tremors, agitation, or abnormal speech patterns.
If a driver tests positive on an ADSE the positive result confirms the presence of the drug, and combined with other signs of impairment or drug use observed by the police at the roadside, may provide grounds for the investigation to proceed further by making a demand for a blood sample or a drug recognition evaluation. Similar screeners are used in other countries including the United Kingdom and Australia.
Currently, there are two approved devices available for use by law enforcement in Canada: the Dräger DrugTest® 5000 (which includes the Dräger DrugTest® 5000 STK-CA), and SoToxa™ (which is an Abbott SoToxa™ Test Cartridge and an Abbott SoToxa™ Oral Fluid Collection Device).
The Federal Initiative
In September 2017, the Government of Canada announced that it was investing $161 million over five years to support the implementation of the new legislative regime on DID and build law enforcement capacity across Canada to recognize the signs and symptoms of DID, provide access to ADSE, develop policy, bolster research, and raise public awareness about the dangers of DID.
Of this funding envelope, $81 million was set aside specifically for Provinces and Territories (PTs) to ensure that they would be able to provide police officers with the training and tools they need. In particular, this funding was designed to increase training for Standard Field Sobriety Testing (SFST) and the Drug Recognition Expert (DRE) program; support the acquisition of ADSE; and collect standardized national data on DID trends and patterns. In addition, $12 million was allocated to the CBSA to provide BSOs with the training and tools to interdict impaired driving at land borders.
At the time when the federal initiative was launched, there were approximately 13,000 SFST trained law enforcement officers and close to 600 DREs across the country. Prior to this initiative, the CBSA did not train BSOs on detecting drug-impaired driving; officers were only trained in detecting alcohol-impaired driving. The CBSA committed to training 1,425 BSOs in the administration of the SFST. The objective is that 33% of front-line law enforcement officers and 30% of BSOs working at the land border will have been trained in SFST, and there will be 1250 active DREs by the end of the initiative, which is currently set to end in March 2025. Currently available statistics indicate that there are now approximately 20,000 SFST trained officersFootnote 6 and over 1,200 DREs. Public Safety Canada continues to work with PTs to help meet their training and capacity needs; close to $16 million in funding was available in FY 2021-2022.
A significant part of this initiative, in the context of cannabis legalization, is to monitor trends and patterns in DID. As such, Public Safety Canada (PS) is expected to:
- Produce annual reports on the scope and trends in DID, law enforcement capacity and action, impacts on public safety, successes and challenges, and impacts of cannabis legalization on road safety;
- Conduct research, including on the impairing effects of smoked and edible cannabis;
- Lead a horizontal evaluation of the initiative; and
- Contribute data on DID for the mandatory three-year review of the new impaired driving legislation led by Justice Canada.
As noted earlier, a FPT DID working group (DID WG) comprised of data analysts hired by PTs with the contribution program funding, PS representatives, and key stakeholders (e.g., RCMP, CBSA, Justice) has been created. In 2019, the WG developed a common framework and set of indicators which have since been used for the preparation of the annual data report. The WG continues to share information on current data collection practices, gaps and challenges, and next steps to improve data coverage and completeness. Recognizing the need to address outstanding data gaps on DID, PS enhanced the scope of the initiative in 2020 to allow provinces and territories to include data collection and research as reimbursable activities in the funding agreements.
Provincial and Territorial Initiatives
In response to cannabis legalization, all provinces and territories modified their existing legislation, including on drug-impaired driving. Most jurisdictions have adopted some form of zero tolerance policy for some categories of drivers including: young, novice, and commercial motor vehicle drivers. Sanctions are generally graduated and can include administrative license suspensions (e.g., immediate, 30, 45, or 60 days), fines or license reinstatement fees, ignition interlock requirements, and vehicle impoundment. The Canadian Centre on Substance Use and Addiction (CCSA) has prepared an overview of administrative sanctions in provinces and territories which can be consulted online.
Trends and Patterns in Drug-Impaired Driving
There are various ways of measuring DID occurrences and incidents: population surveys asking a sample of Canadians to report on their driving behaviour after drug use; roadside surveys collecting oral fluid samples from a sample of voluntary drivers generally at night time and during summer months; police and border services officer (BSO) reported incidents; and toxicological analyses of injured drivers in hospitals and trauma centres, and of fatally injured drivers by coroners and medical examiners.
No single source is sufficient on its own and each has its limitations. Self-reported behaviour is hampered by accuracy and/or unwillingness to disclose behaviour. Roadside surveys' limitations include: the drug detection method (oral fluid) only indicates presence or absence of drugs; they are conducted in a small number of locations and at very specific and limited points in time; and they only involve drivers who agree to participate. Police and border service officer reported incidents only include incidents detected by or which come to the attention of law enforcement and may significantly under-estimate the true prevalence of impaired driving. Toxicological data on injured drivers is limited to only those drivers whose condition requires a visit to the hospital and the recency of blood sample collection. Coroners' toxicological data is limited by factors such as the level of toxicological analyses conducted (e.g., in some cases once alcohol is detected at an impairing level, they will not proceed with drug analysis), variable methodology between jurisdictions, and issues related to the unique characteristics of THC in blood in the case of cannabis.
The following sections present available data from each of these various sources.
Self-Reported Behaviour
Conducted by Health Canada, the Canadian Cannabis Survey (CCS) measures a variety of indicators related to cannabis, including self-reported driving behaviour following cannabis use among a sample of Canadians. The latest figures show that a little less than 21% of past 12-month users with a valid driver's license reported driving a vehicle within two hours of cannabis use, a reduction from 26% in 2019 and 22% in 2020.Footnote 7 Results by jurisdiction are as follows:Footnote 8
Province and Territories |
% of people who drove within 2 hours of smoking cannabis |
How long ago did this happen? |
|||||||
|---|---|---|---|---|---|---|---|---|---|
Within the past 30 days |
Within the past 12 months |
||||||||
2019 |
2020 |
2021 |
2019 |
2020 |
2021 |
2019 |
2020 |
2021 |
|
BC |
32% |
27.5% |
24.1% |
41.3% |
39.4% |
36.5% |
33.8% |
35.8% |
- |
AB |
30.5% |
22.1% |
20.7% |
43.0% |
35.9% |
42.5% |
34.5% |
34.0% |
- |
SK |
34.6% |
32.9% |
34.1% |
- |
- |
- |
- |
- |
- |
MB |
- |
29.2% |
- |
- |
- |
- |
- |
- |
- |
ON |
22.3% |
20.8% |
19.9% |
38.7% |
38.1% |
28.8% |
28.8% |
28.0% |
29.8% |
QC |
26.5% |
17.0% |
13.3% |
54.9% |
39.5% |
- |
26.9% |
39.2% |
- |
NB |
24.8% |
22.4% |
29.1% |
- |
- |
- |
- |
- |
- |
NS |
25.1% |
17.4% |
24.2% |
- |
- |
- |
- |
- |
- |
PEI |
27.9% |
25.4% |
- |
- |
- |
- |
- |
- |
- |
NL |
27.3% |
25.3% |
- |
- |
- |
- |
- |
- |
- |
Territories |
- |
- |
- |
- |
- |
35.2% |
- |
- |
- |
Canada |
26.4% |
22.0% |
20.6% |
43.5% |
39.2% |
- |
31.3% |
32.0% |
28.6% |
In 2021, Public Safety Canada commissioned Ekos Research Associates to conduct a public opinion research (POR) on DID. This POR, based on a sample of 2,193 surveys, replicated similar studies conducted since 2017 to monitor the evolution of patterns over time. Consistent with 2020 and 2017 results, over one-quarter (26%) of cannabis users reported having operated a vehicle while under the influence in the past 12 months, which is somewhat higher than CCS results. Additionally, nearly one in three Canadians also reported that they have ridden in a vehicle operated by a driver who was under the effects of cannabis.
Starting in 2020, the CCS added a question on driving behaviour after using ingested cannabis products. This is an important addition since the effects of edible cannabis products on driving behaviour are likely different from those of smoked or vaped cannabis. The table below shows that the proportion of respondents who reported driving within four hours of ingesting cannabis declined from 13.4% in 2020 to 12.5% in 2021.
Province and Territories |
% of people who drove within 4 hours of ingesting cannabis |
How long ago did this happen? |
||||
|---|---|---|---|---|---|---|
Within the past 30 days |
Within the past 12 months |
|||||
2020 |
2021 |
2020 |
2021 |
2020 |
2021 |
|
BC |
17.5% |
16.0% |
- |
- |
41.7% |
- |
AB |
13.2% |
14.0% |
- |
- |
- |
- |
SK |
- |
- |
- |
- |
- |
- |
MB |
- |
- |
- |
- |
- |
- |
ON |
13.0% |
12.1% |
30.7% |
- |
41.3% |
40.2% |
QC |
9.9% |
9.5% |
- |
- |
40.7% |
- |
NB |
- |
- |
- |
- |
- |
- |
NS |
- |
- |
- |
- |
- |
- |
PEI |
- |
- |
- |
- |
- |
- |
NL |
- |
- |
- |
- |
- |
- |
Territories |
- |
- |
- |
- |
- |
|
Canada |
13.4% |
12.5% |
31.6% |
29.4% |
39.7% |
39.0% |
In 2021, BC, Alberta and Québec have conducted their own population-based surveys.
The BC surveyFootnote 9 was conducted by telephone for 10 weeks between August and October of 2021. It was administered in English, Punjabi, Cantonese, and Mandarin, and only those aged 19 and older were eligible to participate. Respondents who had consumed cannabis in the past 12 months were invited to complete a supplementary online survey. In total, 24,794 people responded to the telephone survey, and 8,473 reported having used cannabis at least once during the past 12 months. Of those who reported using cannabis, 2,420 completed the online survey. Those who use cannabis and had a valid driver's license were asked to indicate whether they had ever driven a motor vehicle within 2 hours of inhaling or 4 hours of eating cannabis. One in five people in British Columbia who use cannabis reported having driven a motor vehicle shortly after using cannabis at some point in their lifetime (22%). Most people reported that this happened within the past 30 days (39%), or that it happened more than 30 days ago but within the past year (30%). In addition, 27% of these respondents who reported having driven after using cannabis also reported that they had driven shortly after using cannabis in combination with alcohol or another drug (other than tobacco). There was a decrease from 2018 to 2021 in self-reported driving after using cannabis (from 27% to 14%). This amounts to an estimated 4.9% of adults in British Columbia who report having driven shortly after using cannabis at least once within the past year, which is a decrease from 7.7% in 2018. Also, compared to 2018, fewer people who use cannabis reported having been a passenger of a driver who recently used cannabis (from 41% to 29%). Riding as a passenger with a driver who recently used cannabis was reported much more often among respondents who use cannabis (64% in lifetime, 28% within the past year) than those who do not (23% in lifetime, 3% within the past year).
The Alberta survey (referred to earlier in this report) found that 8% of all respondents indicated having driven within two hours of using cannabis, but the proportion rose to 20% among cannabis users.Footnote 10
In 2021, Québec conducted a survey of 24,617 persons fifteen years and over, with 14,034 persons completing the survey, for a 59% response rateFootnote 11. The survey covered patterns of cannabis use, characteristics of users, sources of cannabis products and perceptions about cannabis and its use. Over 85% of respondents indicated that they had not driven within two hours of using cannabis; the proportion was 83% in the 2019 survey. However, 14.8% indicated having done so at least once, including 8.1% less than once a month, 2.6% every month, 2.4% every week, and 1.8% almost every day. Similar to findings from other surveys, including the CCS, regular cannabis users are less likely to report not having driven within two hours of using cannabis: 68% of daily and 74% of regular (every week) users, compared to 90% among occasional (every month) users and 97% among those who used cannabis less than once per month. The proportions were respectively 50%, 71%, 90% and 96% in 2019.
Roadside Surveys
No province or territory conducted a roadside survey in 2020 or 2019. However, five jurisdictions conducted surveys prior to cannabis legalization, providing a baseline against which to measure post-legalization change. These include Manitoba (2016), Ontario (2017), British Columbia (2018), Yukon (2018), and Northwest Territories (2018). The Canadian Council of Motor Vehicle Administrators (CCMTA) has produced a synthesis of these surveys' findings.Footnote 12
Of the total 7,265 drivers randomly selected, 80.7% accepted to participate, 97.7% provided a breath sample to detect alcohol and 90.2% an oral fluid sample to detect the presence of drugs.
Key findings include:
- 10.2% of drivers tested positive for drugs (compared to 4.4% for alcoholFootnote 13);
- 7.6% of drivers were positive for cannabis (THC);
- Overall, 12.9% of drivers were positive for alcohol, drugs, or both;
- Drug use was most prevalent among drivers aged 20 to 24 (14.0%) and decreased with increasing age;
- Only 2.1% of drivers aged 16 to 19 tested positive for alcohol; however, 10.4% of this age group tested positive for cannabis;
- Alcohol use was most common on Friday and Saturday nights (4.6% and 6.2%, respectively); and cannabis use did not differ across survey nights, varying between 6.9% and 9.0%.
Compared to data from previous surveys, there has been a significant reduction in the prevalence of alcohol use among drivers, but a significant increase in the prevalence of drug use, cannabis in particular. Similar to other types of prevalence data, roadside surveys show that male drivers are more likely than female drivers (12% and 7.4% respectively) to test positive for drugs.
BC, Manitoba and Ontario, as well as some Atlantic Canada provinces, have indicated that they are considering conducting roadside surveys in 2022 or 2023.
The Yukon has recently completed their roadside surveys in July 2022 for both commercial and non-commercial vehicles. This is the first time the Yukon has included commercial vehicles in their survey. Due to a backlog at the lab, the results of these surveys will not be available until end of October 2022.
Law Enforcement-Reported Incidents
Law enforcement officers typically come in contact with impaired drivers through a traffic stop. Officers can also encounter with impaired drivers when attending traffic collisions, conducting roadside checks randomly at various times during the year (e.g., Christmas and New Year), or other means. CBSA officers may come into contact with impaired driving through border processing. In coming into contact with a driver, law enforcement and border officers may do a number of things depending on the circumstances: demand a preliminary breath sample, conduct a standardized field sobriety test (SFST), or collect a sample of oral fluid using ADSE. If the officer has reasonable grounds to believe that the operator of the vehicle has committed an offence, the person can be required to provide a blood sample or submit to a DRE, or imposed an administrative penalty (e.g. fine or license suspension) under the relevant provincial/territorial legislation.
Various data may be collected at each of these stages, but whether and how it is collected varies significantly both between jurisdictions and type of tool used. Data on police-reported incidents is collected systematically and reported annually through Statistics Canada's Uniform Crime Reporting (UCR) Survey. Similarly, data is systematically collected when a DRE is conducted or blood analysis are requested. However, data is not systematically collected when a preliminary breath test or SFST is conducted or when ADSE is used. Data on CBSA enforcement actions at the border is maintained in Agency systems.
In addition to being limited to incidents that come to their attention, police data on DID incidents may under-represent their occurrence for a variety of reasons. Whenever the presence of alcohol is established, officers will typically pursue the alcohol-related charge and will not further investigate for the presence of drugs.Footnote 14 Other factors may explain under-detection and under-reporting such as the number or availability of detection capacity, or the fact that information may be lost since it is mostly manually entered.
UCR data indicates that the proportion of DID incidents reported by police has significantly increased relative to alcohol-impaired driving incidents over time. This is likely due to a combination of factors including changes in the legislation that facilitated investigation and charging of DID incidents, a significant increase in law enforcement awareness raising and training on how to detect and investigate DID, while at the same time several jurisdictions have been strengthening their administrative sanctions regime (e.g., BC's immediate roadside prohibition policy) and using it more frequently than the Criminal Code route.
CBSA enforcement data shows a parallel between drug and alcohol impaired driving arrests. In 2021, the Agency made 103 DID arrests, compared to 119 alcohol impaired driving arrests; 78% of the DID arrests were based on the results of SFST.
In 2020, CBSA made 126 DID arrests, compared to 128 arrests for alcohol impaired driving; 88% of the DID arrests were based on the results of the SFST. In 2019, there were 223 DID arrests and 285 for alcohol impaired driving.
Police-reported data for 2021 indicated that in all of Canada, police reported 71,495 impaired driving incidents, a decrease of almost 6,000 incidents from 2020 (Statistics Canada, 2022). The highest rates (i.e., number per 100,000 population) were reported in Prince Edward Island, Yukon, the Northwest Territories and Nunavut, and the lowest in Ontario and Quebec. While the overall volume of impaired driving incidents declined, DID incidents reported by police continued to increase as a proportion of all impaired driving incidents, as they have since 2009. In 2021, there were 7,454 DID police-reported incidents, an increase from 7,411 in 2020 and 6,285 in 2019. Provincially, Ontario (+686) and Quebec (+316) account for almost the entirety of this increase in DID. The Atlantic provinces reported the highest rates of DID among provinces, Ontario, British Columbia, and Quebec the lowest.
Figure 1 – Trends in annual, police-reported, impaired-driving incidents in Canada (alcohol and drugs) Footnote 15
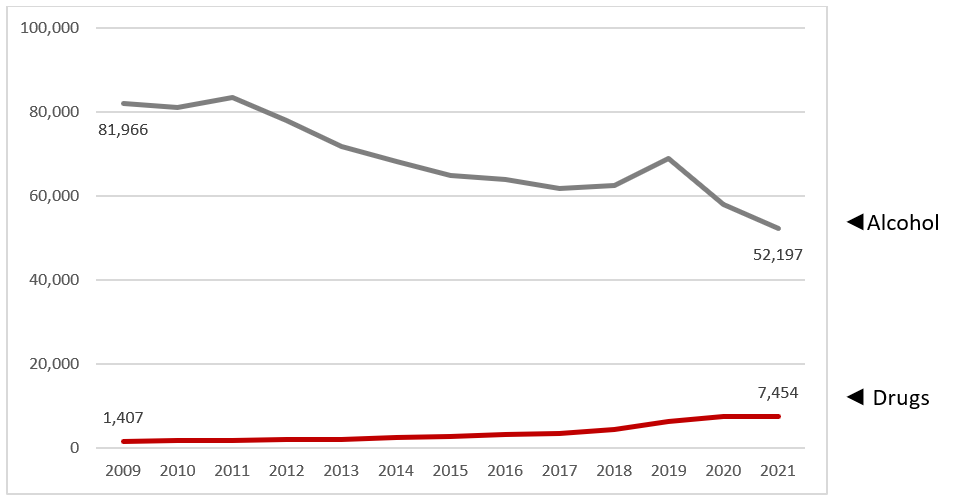
Image description
The graph illustrates that the total number of drug-impaired driving incidents reported by police has significantly increased over time compared to alcohol-impaired driving incidents, which have significantly decreased (with the exception of 2019).
Year |
Type of Offense |
||
|---|---|---|---|
Impaired Driving (Total) |
Operation while Impaired (Alcohol) |
Operation while Impaired (Drugs) |
|
2009 |
88,303 |
81,966 |
1,407 |
2010 |
87,231 |
80,958 |
1,679 |
2011 |
89,607 |
83,337 |
1,836 |
2012 |
84,149 |
77,947 |
1,912 |
2013 |
77,558 |
71,720 |
1,937 |
2014 |
74,577 |
68,178 |
2,460 |
2015 |
71,870 |
64,781 |
2,698 |
2016 |
71,304 |
63,968 |
3,073 |
2017 |
69,108 |
61,711 |
3,416 |
2018 |
70,832 |
62,366 |
4,356 |
2019 |
85,804 |
68,823 |
6,285 |
2020 |
77,838 |
57,996 |
7,411 |
2021 |
71,495 |
52,197 |
7,454 |
Source: Statistics Canada |
|||
Alcohol-impaired driving incidents represented 79% of all impaired driving incidents in 2021; the rate of incidents per 100,000 population declined from 183 in 2019 to 146 in 2021. DID incidents represented 11% (an increase from 9% the previous year), a rate of 20 per 100,000 population, while those involving a combination of alcohol and drugs represented 8%, a rate of 15 per 100,000. (Statistics Canada 2022).
It is also interesting to note that the proportion of alcohol-impaired driving cases cleared by charge has tended to decline over the years: 56.4% in 2019, compared to 51.7% in 2021. Conversely, in the case of DID, the proportion has increased from 47.4% in 2019, to 59.2% in 2021.
As was noted by PerreaultFootnote 16:
The decrease in the proportion of incidents either cleared by charge or without charge is mainly because of an increase in the proportion of incidents not cleared, which rose from 22% in 2018 to 33% of all police-reported incidents of impaired driving in 2019. Of these uncleared incidents, the vast majority (97%) could not be cleared because of insufficient evidence. Incidents that were still under investigation when the data were submitted to Statistics Canada represented 2% of impaired driving incidents that were not cleared. Changes to the definitions of founded and unfounded criminal incidents may have led to an increase in the number of uncleared incidents, which could, in large part, account for the decrease in the relative proportion of cleared incidents.
Perreault had also observed that alcohol-impaired driving incidents take less time to be cleared by charge than DID incidents: while more than 76% of analyzed alcohol-impaired driving incidents were cleared by charge within a day or less, the proportion for DID cases was 59%. Furthermore, 37% of DID incidents took 31 days or more to clear by charge, compared to 17% of alcohol-impaired driving cases.
Toxicological Data from Injured Drivers
One of the most reliable methods to measure the prevalence and level of various substances in traffic incidents is to analyze blood samples among injured drivers presenting in hospitals and trauma centres. A team of researchers from the University of British Columbia under the direction of professor J.F. Brubacher is currently conducting an innovative study in Canada.
This prospective observational study obtains data from injured drivers treated in the emergency departments (EDs) in fifteen Canadian cities (Calgary, Edmonton, Halifax, Kelowna, Montreal, New Westminster, Ottawa, Quebec City, Regina, Saskatoon, Saint John, St John's, Toronto, Vancouver, and Victoria). The study is currently enrolling approximately 2500 participants per year. This number will allow the investigators to report the prevalence of drug driving according to substance (cannabis, impairing medications, etc.) disaggregated by injury severity, region, sex, and age group. Continuous data will collection will identify changes in in the prevalence of drug-impaired driving over time. Eligibility criteria include moderately or severely injured drivers of motorized vehicles (e.g. cars, motorcycles, trucks) who visit the ED of a participating hospital and have blood samples obtained within six hours of the crash. Blood samples are for clinical decision making and are not obtained for the purpose of toxicology testing. Drivers of off-road vehicles, cases where no excess blood remains after clinical use and cases that expire in the emergency department are excluded. Injury severity is defined pragmatically as the need to obtain blood for clinical purposes (moderate injury) or need for overnight hospital admission (severe injury). The methodology overcomes many limitations of previous research. It measures drugs in blood, which for most drugs, correlates better with impairment than drug levels measured in saliva or urine. Rather than merely detecting presence or absence of drugs, the methods quantify alcohol, THC, COOH-THC and 83 other impairing drugs and medications. Additional "newly emerging" substances can be added to the toxicology panel in response to new information. This is a marked improvement over most roadside surveys because more substances can be detected and drug levels in blood are reported, which allow to comment on probable impairment. Additionally, blood is obtained shortly after the crash, in most cases within 1.5 h, so the toxicology results closely approximate drug levels at time of crash, simplifying interpretation of toxicology findings. The decision to obtain blood in this study is not based on suspicion of drug use. Blood obtained for the study is collected when clinically indicated for managing the patient's injuries, based on crash mechanism and/or physical examination. Clinicians do not receive drug testing results from this study. This process eliminates the selection bias that would occur if drug testing were based on suspicion of drug use. Also, as this study has ethics approval for waiver of consent, it avoids the bias that would arise if drivers who used drugs were less likely to consent for testing, as might be the case in roadside surveys.
In a paper published in early 2022Footnote 17, Brubacher and team report on results from a sample of 4,339 injured drivers from British Columbia, – 3,550 before legalization (January 2013 to October 2018) and 789 after legalization (November 2018 to March 2020) – thus offering a unique opportunity to examine the potential impacts of cannabis legalization on the prevalence of cannabis use among injured drivers.
The study found that, after cannabis legalization, the prevalence of moderately injured drivers with a THC level of at least 2 ng per milliliter had more than doubled. The increase was largest among older drivers and male drivers. More specifically, before legalization, a THC level greater than 0 was detected in 9.2% of drivers, a THC level of at least 2 ng per milliliter in 3.8%, and a THC level of at least 5 ng per milliliter in 1.1%. The values after legalization were 17.9%, 8.6%, and 3.5%, respectively. After legalization, the adjusted prevalence ratio of drivers with a THC level greater than 0 was 1.33; 2.29 for those presenting a THC level of at least 2 ng per milliliter, and 2.05 for those with a THC level of at least 5 ng per milliliter. The largest increases in a THC level of at least 2 ng per milliliter were among drivers 50 years of age or older (adjusted prevalence ratio, 5.18) and among male drivers (adjusted prevalence ratio, 2.44). Notably, there were no significant changes in the prevalence of drivers testing positive for alcohol.
The data is also available for each jurisdiction participating in the study. The following table presents findings on the total number of injured drivers by type of substance. Note that the data are not broken down by year at this time.
National |
BC |
AB |
SK |
ON |
QC |
AP |
||||||||
|---|---|---|---|---|---|---|---|---|---|---|---|---|---|---|
n |
% |
n |
% |
n |
% |
n |
% |
n |
% |
n |
% |
n |
% |
|
Total injured drivers |
7019 |
100.0% |
2365 |
100% |
1600 |
100.0% |
508 |
100.0% |
1351 |
100.0% |
724 |
100.0% |
471 |
100.0% |
Alcohol |
||||||||||||||
BAC > 0 |
1163 |
16.7% |
269 |
11.5% |
271 |
17.0% |
101 |
20.0% |
246 |
18.3% |
139 |
19.2% |
137 |
29.1% |
0 < BAC < 0.05% |
204 |
2.9% |
55 |
2.3% |
30 |
1.9% |
14 |
2.8% |
31 |
2.3% |
39 |
5.4% |
35 |
7.4% |
0.05% ≤ BAC < 0.08% |
86 |
1.2% |
22 |
0.9% |
16 |
1.0% |
8 |
1.6% |
22 |
1.6% |
13 |
8% |
5 |
1.1% |
BAC ≥ 0.08% |
873 |
12.5% |
192 |
8.2% |
225 |
14.1% |
79 |
15.6% |
193 |
14.4% |
87 |
12.0% |
97 |
20.6% |
Cannabinoids |
||||||||||||||
COOH-THC > 0 |
2112 |
30.2% |
602 |
25.5% |
454 |
28.4% |
178 |
35.2% |
463 |
34.4% |
190 |
26.4% |
225 |
48.0% |
THC > 0 |
1283 |
18.3% |
357 |
15.1% |
255 |
15.9% |
112 |
22.2% |
250 |
18.6% |
171 |
23.8% |
138 |
29.4% |
THC ≥ 2 ng/mL |
557 |
8.0% |
140 |
5.9% |
110 |
6.9% |
57 |
11.3% |
104 |
7.7% |
69 |
9.6% |
77 |
16.4% |
THC ≥ 5 ng/mL |
246 |
3.5% |
51 |
2.2% |
54 |
3.4% |
29 |
5.7% |
40 |
3.0% |
35 |
4.9% |
37 |
7.9% |
Other recreational drugsFootnote 18 |
828 |
11.9% |
241 |
10.2% |
201 |
12.6% |
63 |
12.6% |
141 |
10.5% |
88 |
12.4% |
94 |
20.2% |
Sedating medicationsFootnote 19 |
1838 |
26.3% |
508 |
21.5% |
452 |
28.4% |
157 |
31.3% |
335 |
24.8% |
191 |
26.9% |
195 |
41.8% |
Opiates |
788 |
11.3% |
193 |
8.2% |
218 |
13.7% |
72 |
14.4% |
171 |
12.7% |
64 |
9.0% |
70 |
15.0% |
Any substance |
3777 |
53.8% |
1049 |
44.4% |
926 |
57.9% |
310 |
61.0% |
734 |
54.3% |
416 |
57.5% |
342 |
72.6% |
The following table presents data by number of substances found among injured drivers.
National |
BC |
AB |
SK |
ON |
QC |
AP |
||||||||
|---|---|---|---|---|---|---|---|---|---|---|---|---|---|---|
n |
% |
n |
% |
n |
% |
n |
% |
n |
% |
n |
% |
n |
% |
|
Total injured drivers |
7019 |
100% |
2365 |
100% |
1600 |
100% |
508 |
100% |
1351 |
100% |
724 |
100% |
471 |
100% |
Number of substancesFootnote 20 |
||||||||||||||
1 |
2230 |
31.8% |
654 |
27.6% |
568 |
35.5% |
170 |
33.5% |
438 |
32.4% |
245 |
33.8% |
156 |
33.1% |
2 |
1071 |
15.3% |
287 |
12.1% |
260 |
16.2% |
95 |
18.7% |
202 |
15.0% |
124 |
17.1% |
103 |
21.8% |
3 or more |
476 |
6.8% |
108 |
4.6% |
98 |
6.1% |
45 |
8.8% |
94 |
7.0% |
47 |
6.5% |
84 |
17.8% |
Alcohol and THC |
||||||||||||||
BAC > 0 & THC > 0 |
362 |
5.2% |
76 |
3.2% |
83 |
5.2% |
41 |
8.1% |
63 |
4.7% |
49 |
6.8% |
50 |
10.6% |
BAC ≥ 0.05% & THC ≥ 2 ng/mL |
114 |
1.6% |
24 |
1.0% |
23 |
1.4% |
17 |
3.3% |
21 |
1.6% |
16 |
2.2% |
13 |
2.8% |
Alcohol and other substances |
||||||||||||||
BAC > 0 & Other recreational drugs |
272 |
3.9% |
60 |
2.5% |
54 |
3.4% |
21 |
4.1% |
57 |
4.2% |
34 |
4.7% |
46 |
9.8% |
BAC > 0 & Sedating medications |
351 |
5.0% |
74 |
3.1% |
83 |
5.2% |
26 |
5.1% |
68 |
5.0% |
39 |
5.4% |
61 |
13.0% |
BAC > 0 & Opiates |
146 |
2.1% |
26 |
1.1% |
31 |
1.9% |
14 |
2.8% |
38 |
2.8% |
15 |
2.1% |
22 |
4.7% |
THC and other substances |
||||||||||||||
THC > 0 & Other recreational drugs |
252 |
3.6% |
59 |
2.5% |
46 |
2.9% |
30 |
5.9% |
48 |
3.6% |
36 |
5.0% |
33 |
7.1% |
THC > 0 & Sedating medications |
367 |
5.2% |
87 |
3.7% |
68 |
4.2% |
41 |
8.1% |
69 |
5.1% |
46 |
6.4% |
56 |
12.0% |
THC > 0 & Opiates |
172 |
2.5% |
35 |
1.5% |
37 |
2.3% |
17 |
3.4% |
37 |
2.7% |
22 |
3.1% |
24 |
5.1% |
Coroners' Toxicological Data
Coroners and medical examiners report data from toxicological analyses of different specimens (e.g., blood, urine, hair, etc.) from fatally injured drivers. However, similar to police investigations, many coroners will not conduct further analyses if alcohol is present and can clearly be established as a probable cause of death. Furthermore, if the cause of death is obvious, many will not conduct toxicological analyses; this decision is, in part, related to the time and costs of conducting such analyses. Furthermore, methods may vary between jurisdictions, making it difficult to compare data.
No new national coroners' toxicological data is available. For more information relating to research from the Traffic Injuries Research Foundation in 2017, please refer to the previous Annual National Data Report to Inform Trends and Patterns in Drug-Impaired Driving.
However, in its 2021 report, Quebec provides a series of data from the Laboratoire de sciences judiciaires et de médecine légale (LSJML) and the Coroners Office. LSJML cases are analyses of urine or blood samples from impaired drivers. One should remember that while blood samples indicate recent use, such is not the case for urine samples since traces of THC can remain in urine for days, up to 30 days among regular users. 2019 LSJML data show that methamphetamines are most frequently detected, followed by cannabis and cocaine. (LSJML, 2021). When cannabis was present, 20% had a THC blood concentration between 0.5 and 1.9 ng/mL, 44% between 2.0 and 4.9 ng/mL, and 36% over 5 ng/mL. A THC rate below 2 ng/ml does not necessarily indicate recent use, while a rate over 5 ng/ml is associated with impaired driving and recent use. In addition, a rate over 5 ng/ml increases the likelihood of a responsible crash. Poly drug use was found in 79% of cases.
Coroners data for 2019-2021 do not represent all deceased drivers since only about 72% are tested for the presence of drugs. Furthermore, 2019 data are 98% complete and 2020 data are 92% complete, but 2021 data are only 58% complete due to delays in concluding analyses and reporting data. Drugs most often detected since 2019 are cannabis, cocaine and methamphetamines; this is similar to LSJML data. Substances most often detected since 2019 are cannabis, cocaine, and methamphetamines, which is aligned with LSJML data. This data does not appear to change over time, other than a reduction in poly drug us and cocaine. On the other hand, poly drug use among cannabis users is not diminishing. Among those who tested positive for cannabis, 41.6% had used at least one other substance in 2019, 36.9% in 2020, and 50% in 2021. 2021 data show that drug were most often detected among the 15 to 44, and among males.
What is Being Done to Address Drug-Impaired Driving
Similar to other crimes, DID can be addressed through a gradation of interventions including prevention, detection, and deterrence. Upstream, efforts are made to prevent its very occurrence, in particular through awareness raising and education which can be universal or targeted to specific at-risk groups of the population. Detection will be done through traditional policing methods including road checks and the use of screening tools such as ADSE and SFST. When impaired driving behaviour is detected, additional investigation may be conducted by making a DRE and/or blood sample demand. If the officer has reasonable grounds to believe that the driver is impaired, criminal charges can be laid and/or administrative sanctions imposed, to deter future similar behaviour, either of a specific individual or of the larger community (general deterrence). This section presents activities undertaken by the jurisdictions under these various approaches.
Prevention and Detection
Most jurisdictions have conducted various forms of preventative and detection interventions both before and after cannabis legalization. These interventions included public awareness campaigns on all types of media but mostly on social media channels, as well as targeted education campaigns in high schools, directed at drivers or at cannabis users in cannabis retail stores.
British Columbia
In British Columbia, there were no general preventative media campaigns or interventions specific to the DID in the year of 2021. However, for spring of 2022, The Liquor Distribution Branch (LDB) is developing a public educational campaign called "Don't Drive High" highlighting the risks and consequences of cannabis-impaired driving. Additionally, B.C. has conducted over the past 35 years a police-run roadblock tactic "CounterAttack", which aims to catch drug and alcohol impaired drivers and reduce injuries and fatalities. B.C. ran two CounterAttack campaigns, one in July and one in December of 2021. Based on preliminary data, 528 impaired driving infractions were issued (Criminal Code and Administrative Sanctions), including 24 violations specific to DID.
Alberta
Alberta sees many preventative interventions by different police services, targeting varying groups such as youth drivers, student drivers, city and neighbourhood street drivers, highway drivers, truck drivers, etc. These measures are enforced at different times and occasions including, but not limited to long weekends, holiday seasons, school zones constructions sites or sports and entertainment events. For example, the Edmonton Police Service (EPS) enforces what they call 'Big Ticket' events, where at various times of the year numerous roadblocks are mounted and tickets issued to offending drivers. Speed limits throughout the school year are rigidly enforced and lastly, police sometimes maintain presence at both road construction sites and in areas where 'speed fine doubles' signs are visible, to deter dangerous driving and promote safety.
On December 4, 2021, the Alberta RCMP removed 91 impaired drives from provincial roadways during their National Impaired Driving Enforcement Day. This Canada-wide initiative promotes safe, sober driving, where members patrolled highways targeting motorist under the influence of drugs and/or alcohol. In addition to this, Alberta held various notable events during the year of 2021. The St. Paul traffic services held enforcement and education check stops in collaboration with detachment members, St. Paul Community Peace Officers, and MADD volunteers. Of these 91 impaired motorists, 47 drivers received Immediate Roadside Sanction (IRS) FAILs and 26 received IRS WARNs. In addition to these, 14 drivers holding a GDL licenses were issues suspensions and vehicle seizures, due to their blood alcohol concentration being greater than zero.
Saskatchewan
In Saskatchewan, stakeholders, police services, Saskatchewan Government Insurance (SGI), Students Against Drinking and Driving (SADD) and Mothers Against Drinking and Driving (MADD) held various events and awareness to increase awareness the effects of the effects of impaired driving throughout 2021. Although COVID-19 created many barriers and some in-person events could not go forth, SGI utilized media campaigns to increase awareness of traffic safety, establish consistent and continuous presence within the market and reduce traffic violations/injuries/fatalities/collisions. Furthermore, in 2021, MADD Canada held a Crashed Car Awareness Campaign where crashed cars were exhibited in Regina, Saskatoon, Prince Albert, Estevan and Meadow Lake to increase awareness of the realities of car accidents. In addition, The Campaign 911 Mobile RID Program set up 120 signs alongside roads where impaired drivers were caught throughout Saskatchewan. Among all initiatives, MADD Canada held various events throughout 2021 such as Positive Ticketing Campaign where 23 checkpoints were set up throughout the year rewarding sober drivers with gift cards and air refreshers. MADD Canada was active in educational awareness and held various presentations such as The SmartWheels presentation presenting 397 times at 139 school for grades 4-6, The MADD School Program presentation presenting 120 times at 42 schools for grades 7-12 and Weed Out The Risk presentation presented 80 times at 23 schools for grades 7-12. Lastly, MADD Canada started the SmartWheels Bus program in Saskatchewan which utilized virtual reality to stimulate the virtual experience of driving under the influence of cannabis or alcohol.
Manitoba
Similar to 2021, Manitoba's Liquor, Gaming & Cannabis Authority promoted various public education campaigns on cannabis focusing on cannabis laws, low-risk usage, and products. However, during 2021, these campaigns have not focused specifically on drug impaired driving.
Ontario
During 2021, Ontario raised public awareness and knowledge of the effects of drugs and alcohol through several media campaigns. These efforts ranged from webinars to YouTube videos, to social media campaigns and educational programs. They included, for example: Arrive Alive Drive Sober; MADD Durham #MakeThePledge Campaign; CAA "Do anything but drive" Campaign; Thunder Bay Indigenous Injury Prevention Strategies (TIIPS); Ontario Students Against Impaired Driving Drug and Driving Webinar and Students Against Impaired Driving (SAID) Day.
Quebec
Quebec saw a growing concern around drunk driving in 2002, and every year since 2013, Québec's automobile insurance body (SAAQ) has carried out drug-driving campaigns and conducts an annual evaluation of its Cannabis and Alcohol Campaigns (CCA) campaigns. The CCA campaign measures perceptions and performance around drunk driving. The first campaign of 2021 took place between April and May digitally (TV and Internet) promoting awareness of the strong negative effects of cannabis and driving through a video; "Cannabis is stronger than you think". The second campaign took place at the end of the year, where SAAQ posted a Facebook video called "No Drugs and Driving". For the 2021-2023 road safety prevention strategy, SAAQ established guidelines around impaired driving, and will promote prevention activities for the next few years, in hopes to deter individuals from driving after moderate consumption and reinforcing the perception that driving with impaired abilities is not limited to a single typical driver profile or only to repeating offenders and by reinforcing "the perception that there is no safe threshold that allows taking, without risk (of accident or being arrested), alcohol or drugs before driving on the roads". Social media has also been utilized by some police to promote the prevention of CCA. Throughout 2021, Quebec's police force utilized Twitter and Facebook to promote the efforts of the police force, where a total of 116 publications regarding drug-impaired capacities were found. The most notable campaign was the National Concerted Operation Alcohol-Drugs which occurred November and December of 2021, campaigning for various themes related to road safety, including impaired driving. The Road Safety Coordination Committee is responsible for the (COPS) is responsible for the organization of the annual national operation. This committee raises awareness through activities and public campaigns from the SAAQ, and more then 3,500 road checks took place. This operation concentrated on action from Quebec territory was organized as part of a partnership between the Sûreté du Québec, the Service de police de la Ville de Montréal, the Association of Quebec Police Directors and the SAAQ (Sûreté du Québec, 2022).
New Brunswick
New Brunswick is continuing its 2018 initiative with the Department of Health on a public education and awareness campaign regarding cannabis called 'I'm in Control" whose objective is to raise awareness on DID and its risks associated with legalized cannabis and aims to minimize its harm. This campaign targets youth to know the facts and understand the risk associated with consuming cannabis, and for them to make informed decisions within their personal use. The second portion of this campaign was launched in 2019. These campaigns were delivered through various types of forums such as social media and traditional media i.e., blogs, smartphone apps, posters, etc. This ongoing campaign is comprised of several modes of delivery, with presence at festivals, awareness weeks, schools and campuses, and its evaluations are tailored to each specific tactic. Lastly the GNB maintains a website "Take the Legal Route" (Cannabis in New Brunswick (gnb.ca), providing factual informative links to the GoC website by promoting 'Don't Drive High" programs.
Nova Scotia
The Government of Nova Scotia continues to maintain the following website to educate members of the public on cannabis related issues. While there were no formal media campaigns in Nova Scotia, police agencies regularly released information on Drug Impaired Driving and charges laid in efforts to educate the public and deter individuals from driving impaired.
Prince-Edward Island
In 2021, PEI launched an impaired driving public awareness campaign that included radio advertisements, signs on bus shelters, billboards, social media content and rink boards to demonstrate the adverse effects alcohol and drug impaired driving has on first responders in the community. Stemming from the 2018 legalization of Cannabis, PEI continues with their public awareness campaign on laws surrounding cannabis, health risks, responsible usage, how to talk to youth and dangers around driving impaired. This campaign is found on social media, radio channels, newspapers, digital advertisements, posters, and can be further explored on the provincial website. In addition, the PEI Cannabis Management Corporation runs two year-round public education campaigns; "Don't drive impaired" targeting both the general public and post-secondary students, consisting of various forms of signage, branding at local sports facilities and radio advertising, and "Stash your Stash" targeting to the general public through radio advertising and on sports venue tickets. Lastly, within 2021, the Department of Justice and Public Safety funded an Impaired Driving Initiative with local law enforcement agencies where police provided patrols of areas that are not typically surveilled by law enforcement. This initiative was a success, garnering positive feedback from the general public, and will be extending into 2022
Newfoundland and Labrador
Newfoundland and Labrador continues to run billboards, print, and media campaigns; target audiences vary depending on the platform, but are inclusive of young people, legal cannabis consumers, as well as parents, educators, and outreach personnel. RNC Community Services officers promote drug education and awareness among school‐aged youth and children. The Government of Newfoundland and Labrador continues to maintain the following website to educate members of the public on cannabis related issues.
The RCMP of Newfoundland and Labrador saw no formal campaigns in relation to DID. However, the Strategic Communications & Media Relations Unit regularly promoted news releases to social media outlets and channels on both DID and arrests. These efforts were to not only educate the public but deter individuals from partaking in DID.
Northwest Territories
In 2021, the Northwest Territories focused on drug and alcohol impaired driving, promoting advertisements against DID; 'Don't Drive Impaired" were endorsed on radio stations, newspapers and web pages. This campaign took on further forums such as on smartphone applications, bus advertisements and on coasters and posters at restaurants across the province. Further, the GNWT's Department of Infrastructure did not conduct impaired driving campaigns similar to the past. AS of now, the Department of Infrastructure is collaborating with a vendor on evaluating safe driving campaigns and proposing a new initiative that promotes informative and impactful messages to their target audience. The evaluation was complete in late 2021 and is entering its new proposal phase to be launched in 2022.
Yukon
In 2021, the Yukon RCMP Traffic Services collaborated with enforcement officers from Highway and Public Works (HPW) – Carrier Compliance and National Safety Code to conduct a four-day commercial vehicle enforcement across northern Yukon. During this 4-day project "Operation Corridor" officers travelled over 3,800 kilometers, checking more than 50 commercial vehicles, resulting in an average violation rate of 40%. Furthermore, the Whitehorse chapter of MADD routinely released media campaigns such as the Project Red Ribbon promoted during the holiday season to promote sober driving. As COVID-19 posed as a barrier for campaigns to be in full-force, Project Red Ribbon was unable to be practices to its full extent, which consists of check stops by the RCMP and other government officials to highlight the dangers of impaired driving. Currently, in 2022, HPW has coordinated with the Department of Justice to create new media campaigns pertaining to drug and alcohol-impaired driving. These new campaigns also cover holiday themes to promote the importance of driving sober.
In addition, in most jurisdictions, local and regional law enforcement organizations also conduct targeted awareness and education campaigns at selected periods of the year such as Christmas and the New Year, and highly publicized roadside checks operations, such as the Reduced Impaired Driving Everywhere (R.I.D.E.) operations conducted by the OPP.
Public Safety Canada's campaign, Don't Drive High, continued to raise awareness amongst young Canadians from April 2020 to March 2021, featuring:
- A new animated video, developed for the pandemic context, showing that the decision to not drive high is an easy one to make
- 64 million digital advertising impressions. including 5 million on Facebook and Instagram, 25 million on Snapchat, 13.5 million on TikTok, 19.5 million on YouTube, and 1 million on other websites
- 20.7 million completed views of the new video, with a completion rate of 86% on YouTube, far surpassing the Government of Canada benchmark of 15%
- Over 2,000 engagements with the dedicated campaign Facebook and Instagram accounts
- 634,000 visits to the Don't Drive High campaign landing page
Law Enforcement Capacity Building
As previously mentioned, key tools available to law enforcement include using the approved drug screening equipment (ADSE) and the SFST to detect DID, and DRE and blood drawsFootnote 21 to support the prosecution of DID offences. The federal government's initiative to support the implementation of the new DID legislative regime by law enforcement provides the opportunity for enhanced training in SFST and DRE, increased capacity to procure ADSE, and increased funding for the RCMP laboratory to conduct toxicological analyses.
Standardized Field Sobriety Test (SFST) Training
Originally designed for the detection of alcohol-impaired driving, SFST is an observational test consisting of three key components: Walk and Turn, One Leg Stand, and Horizontal Gaze Nystagmus. While used to detect impaired driving, including DID, in the USA since 1981, SFST was formally authorized as a screening tool for law enforcement to detect impaired driving in Canada in 2008, and training offered on its use in all provinces and territories. Although research is still ongoing to determine SFST's scientific validity for drugs (Porath & Beirness, 2014), extensive Canadian case law has recognized its use.
SFST training takes different forms. In some jurisdictions, it is only delivered in police colleges (e.g., Quebec's École nationale de police), but in most cases it is delivered by a combination of colleges and local law enforcement organizations (e.g., BC, Ontario). In Quebec, training on SFST is mandatory and is part of the initial training program for police officers at the police school. Also, SFST training is available to police officers on duty (course lasting 24 hours).
As part of the federal initiative to support the implementation of the new DID legislative regime, the national target is that 33% (or approximately 21,000) of all frontline law enforcement officers will have been trained in SFST over five years.Footnote 22 The CBSA initiated SFST training in 2018 as part of the DID initiative.
As can be seen in Table 6, the number of officers trained in SFST continued to decline in 2021, given the restrictions imposed by public health agencies across the country related to the COVID-19 pandemic.
Province and Territories |
# of SFST officers trained in |
Average cost per officer |
|||||
|---|---|---|---|---|---|---|---|
2018 |
2019 |
2020 |
2021 |
2019 |
2020 |
2021 |
|
BC |
329 |
402 |
116 |
141 |
- |
$1,737 |
$3,580 |
AB |
356 |
348 |
39 |
35 |
- |
$886 |
$1, 134 |
SK |
46 |
83 |
22 |
16 |
$1,709 |
$1,652 |
$2, 487 |
MB |
98 |
101 |
37 |
0 |
- |
- |
- |
ON |
2,083 |
1,584 |
512 |
475 |
$1,149 |
$2,110 |
$1, 873 |
QC |
NR |
NR |
NR |
NR |
- |
- |
- |
NB |
279 |
419 |
11 |
0 |
- |
$365.00 |
0 |
NS |
350 |
106 |
18 |
- |
- |
$750.00 |
- |
PEIFootnote 23 |
51 |
2 |
0 |
11 |
- |
- |
- |
NL |
45 |
13 |
9 |
- |
$131 |
- |
$543 |
YT |
19 |
18 |
2 |
- |
- |
$3,494 |
- |
NT |
32 |
37 |
- |
- |
$3,000 |
- |
$3, 500 |
NU |
6 |
7 |
- |
- |
- |
- |
- |
Canada |
3,694 |
3,120 |
766 |
678 (excluding cadets) |
- |
- |
- |
CBSA |
- |
567 |
149 |
- |
- |
$2,479 |
- |
Including Quebec which trains 100% of its police officers in SFST, there were almost 20,000 SFST trained officers overall across the country at the end of 2021, representing almost 21% of all police officers in the country. The distribution across jurisdictions is as follows:
Province and Territories |
Total # of officers trained in SFST as of December 31 |
% frontline police officers trained in SFST |
||||
|---|---|---|---|---|---|---|
2019 |
2020 |
2021 |
2019 |
2020 |
2021 |
|
BC |
1,445 |
1,560 |
1,701 |
30% |
33% |
35.4% |
AB |
1,435 |
1,360 |
1,332 |
25% |
24% |
23% |
SK |
251 |
273 |
289 |
21% |
23% |
73% |
MB |
455 |
492 |
492 |
25% |
28% |
- |
ON |
5,291 |
6,392 |
4,178 |
35% |
25% |
- |
10,241 |
10,468 |
10,229 |
100% |
100% |
100% |
|
NB |
430 |
430 |
430 |
41% |
41% |
41% |
NS |
609 |
627 |
184 |
90% |
34% |
- |
PEI |
108 |
118 |
125 |
55% |
61% |
60.5% |
NL |
244 |
364 |
136 |
- |
44% |
38.66% |
YT |
- |
39 |
32 |
- |
30% |
- |
NT |
- |
27 |
- |
- |
18% |
53% |
NU |
12 |
- |
- |
- |
- |
- |
Canada |
10,280 excl. QC |
11,682 excl. QC |
8,899 excl. QC |
- |
- |
- |
CBSA |
- |
716 |
716 |
- |
24% |
50.2% |
The average cost of SFST training varies significantly across jurisdictions from a few hundred dollars to a few thousand. This may depend on such factors as the method of course delivery, geographical location (e.g., need to travel), course duration, class size, etc.
Drug Recognition Expert (DRE) Training and Certification
Drug Recognition Experts (DRE) receive training on how to use the Drug Evaluation Classification (DEC) Program. The DEC is a systematic and standardized 12-step procedure used by trained officers to recognize and evaluate behaviours and physiological indicators associated with the seven different drug categories: central nervous system depressants and stimulants, inhalants, dissociative anesthetics, cannabis, hallucinogens, and narcotic analgesics. The results of the 12-step evaluation, when corroborated by toxicological evidence of drug use, provide sufficient evidence to proceed with DID charges (Porath & Beirness, 2019).
The Criminal Code recognizes the International Association of Chiefs of Police (IACP) DEC Program as the sole approved training for SFST and DID for Canadian police and, since 2005, the program has been under the stewardship of the RCMP National Traffic Programs and Operational Technologies. The national DEC program is managed by the RCMP which collects yearly statistics on training, certification, and re-certification of officers across Canada. Data from the RCMP national office indicates that 39 officers were trained in DRE in 2021, a reduction from 91 in 2020 and almost 400 in each of 2018 and 2019. The national total of active DRE officers at the end of 2021 was 1,211, a slight reduction from 2020. This represents almost 97% of the 5-year target (n=1,250) established by the provinces and territories as part of the funding agreements under the federal initiative. The decrease in officers trained, and in the total number of active DREs, is due in large part to the inability to hold training and recertification sessions resulting from the COVID-19 pandemic.
Provinces and Territories |
DREs Trained in 2018 |
DREs Trained in 2019 |
DREs Trained in 2020 |
DREs Trained in 2021 |
|---|---|---|---|---|
BC |
55 |
63 |
13 |
17 |
AB |
53 |
76 |
0 |
- |
SK |
17 |
32 |
0 |
- |
MB |
9 |
12 |
0 |
- |
ON |
123 |
127 |
42 |
- |
QC |
56 |
34 |
21 |
22 |
NB |
23 |
11 |
4 |
- |
NS |
31 |
15 |
6 |
- |
PEI |
6 |
1 |
1 |
- |
NL |
9 |
14 |
3 |
- |
YT |
0 |
1 |
1 |
- |
NT |
2 |
1 |
0 |
- |
NU |
0 |
0 |
0 |
- |
CANADA |
384 |
387 |
91 |
39 |
Provinces and Territories |
Active DREs as of end of 2020Footnote 25 |
Active DREs as of end of 2021 |
|---|---|---|
BC |
186 |
185 |
AB |
172 |
160 |
SK |
80 |
74 |
MB |
43 |
40 |
ON |
450 |
390 |
QC |
160 |
186 |
NB |
51 |
47 |
NS |
78 |
67 |
PEI |
12 |
19 |
NL |
41 |
36 |
YT |
2 |
4 |
NT |
4 |
3 |
NU |
0 |
0 |
Canada |
1,279 |
1,211 |
Approved Drug Screening Equipment (ADSE)
The RCMP has rolled-out a national master "train-the-trainer" curriculum on the approved drug screeners for police services across the country.
Eleven provinces and territories have purchased and deployed ADSE as follows:
Provinces and Territories |
2018 |
2019 |
2020 |
2021 |
Total |
|---|---|---|---|---|---|
BC |
15 |
15 |
32 |
- |
62 |
AB |
6 |
- |
0 |
63 |
69 |
SK |
- |
30 |
0 |
15 |
45 |
MB |
20 |
0 |
0 |
25 |
45 |
ON |
154 |
24 |
10 |
6 |
194 |
NS |
5 |
0 |
17 |
- |
|
PEI |
- |
3 |
3 |
15 |
20 |
NL |
- |
- |
21 |
23 |
44 |
NT |
2 |
- |
- |
21 |
23 |
NU |
- |
1 |
- |
13 |
14 |
YK |
- |
- |
6 |
- |
3 |
Total Canada |
48 |
206 |
107 |
166 |
537 |
Law Enforcement Interventions
Collecting data on law enforcement interventions to address DID has been challenging for all jurisdictions for a variety of reasons. When this initiative started in 2017, collecting this data was a new requirement in most instances for law enforcement organizations across the country. As such, there was a need to work closely with provinces and territories to ascertain the feasibility and capacity to collect data on law enforcement interventions in DID cases. Started in late 2018, further to the enactment of cannabis legalization, this work continued well into 2019. Agreement was reached with all jurisdictions in December 2019 on the list of national indicators and data sources. Once agreement was reached on the list of indicators and data sources, jurisdictions needed to develop data collection tools and establish protocols with law enforcement agencies. Given that data collection takes time, and law enforcement priority responsibility is to respond to calls and conduct investigations, discussions with law enforcement agencies on appropriate and efficient ways to collect the required data are ongoing.
Standard Field Sobriety Testing
Prior to this federal initiative, data on the use (e.g., frequency, circumstances such as day of the week or time of day, and results) of SFST was not collected by police. Given that this tool was available for use by law enforcement since 2009, and that it is in many cases a key detection tool, addressing this absence was a key priority for FPT senior officials and for the FPT working group on DID.
Since 2019, some jurisdictions have started testing the implementation of a log of SFST results. The RCMP and CBSA have also started implementing processes for tracking each time the SFST is administered to a driver.
In 2021, significantly more data is available on SFST. Due to a different data collection system used by the RCMP in BC, no data on the use and results of SFST is currently available. In all jurisdictions but Ontario and Quebec, data includes results from both RCMP and non-RCMP (e.g., municipal) police forces, except for the three territories where the RCMP is the only police. The data presented below report all known cases where SFST was used as a screening tool, and reports on poor performance only in cases where drugs are involved. The data are as follows:
Alberta:
SFST was used a total of 123 times, and the driver performed poorly in 88 cases (71%)
Saskatchewan:
SFST was used 45 times, and the driver performed poorly in 35 cases (69%)
Manitoba:
SFST was used 19 times, and the driver performed poorly in 13 cases (68%) of which 6 were for drugs
Ontario (OPP only):
SFST was used in 523 cases, and the driver performed poorly in 411 cases (78%), of which 371 were for drugs
Quebec (SQ only):
SFST was used 767 times, and 24% led to arrests
New Brunswick:
SFST was use 36 times (17 by municipal police and 19 by RCMP) with 47% performing poorly (32% of the municipal and 71% of the RCMP)
Nova Scotia:
SFST was used 29 times (20 by municipal police and 9 by RCMP), all leading to a DRE evaluation
Prince Edward IslandFootnote 27:
Of the 39 SFST evaluations reported, 32 were conducted by municipal police forces with all drivers performing poorly, and 7 by the RCMP, 6 of which (85%) performed poorly
Newfoundland and Labrador
SFST was used 26 times, with 17 (65%) performing poorly
Nunavut:
SFST used 5 times, with 2 (40%) performing poorly
Northwest Territories:
SFST used 6 times, with 2 (33%) performing poorly
Yukon:
SFST used 5 times with 4 (80%) performing poorly
It is interesting to note the wide variation in the proportion of cases where the driver performed poorly. This is most likely due to the still incomplete reporting of frequency of use and results. Nevertheless, there is clearly significant progress in data coverage across the country.
Drug Recognition Evaluation
The RCMP National DEC program and the Sûreté du Québec in cooperation with the École nationale de police in Quebec collect DRE data. Certified drug recognition experts complete a drug influence evaluation sheet (known as the facesheet), a narrative report, and the DRE report (the tracking form). The facesheet may contain large amounts of qualitative information, but none is systematically captured in electronic records. Furthermore, the database is still largely paper-based, and likely incomplete as DRE facesheets may only be transmitted to the data collectors once toxicology reports are completed and collected, which can take months.
Despite a small decline in 2021 compared to 2020 (5,548 vs 5,948), the number of DRE evaluations conducted yearly has almost doubled since 2018 (from 2,937 to 5,548). Similarly, there has been a significant increase in the average number of evaluations per DRE officer, and this trend continued in 2021.
Figure 2 – Total Drug Recognition Expert (DRE) Operational Evaluations (annual)

Image description
Year |
Total DRE Operational Evaluations |
|---|---|
2018 |
2,937 |
2019 |
4,169 |
2020 |
5,948 |
2021 |
5, 548 |
Figure 3 – Average Number of Evaluations per DRE (annual)

Image description
Year |
Average Evaluations per DRE |
|---|---|
2018 |
2.70 |
2019 |
3.16 |
2020 |
4.28 |
2021 |
4.58 |
Most opinion categoriesFootnote 28 saw an increase in 2021 compared to 2020. However, cannabis as an opinion category decreased from 1,249 to 1,136, and is in fourth position, behind stimulants, narcotics analgesics, and depressants. Figure 3 below displays the DRE opinion categories for 2021.
Figure 4 - DRE Evaluations: Frequency of Opinion Categories, Canada, 2021

Image description
Opinion Categories |
Percentage (%) |
|---|---|
Stimulants |
39.42% |
Narcotic analgesics |
42.54% |
Cannabis |
20.44% |
Depressants |
22.62% |
Not impaired |
10.98% |
Alcohol |
2.54% |
Refusal |
4.38% |
Medical |
1.35% |
Dissociative anesthetics |
0.56% |
Hallucinogens |
0.37% |
Inhalants |
0.25% |
It is important to note that the tables below represent the total number of times the drug category was opined during an evaluation, not the total number of occurrences. Additionally, there can be multiple categories opined per individual occurrence.
BC |
AB |
SK |
MB |
ON |
NB |
NS |
PEI |
NFLD |
YK |
NWT |
NU |
Total |
||
|---|---|---|---|---|---|---|---|---|---|---|---|---|---|---|
Depressants |
111 |
76 |
34 |
18 |
100 |
22 |
32 |
7 |
29 |
0 |
0 |
0 |
429 |
|
Stimulants |
247 |
66 |
25 |
9 |
87 |
NR |
15 |
15 |
5 |
15 |
0 |
0 |
0 |
484 |
Hallucinogens |
0 |
0 |
2 |
0 |
4 |
NR |
0 |
1 |
0 |
1 |
0 |
0 |
0 |
8 |
Dissociative Anesthetics |
4 |
1 |
1 |
1 |
4 |
NR |
0 |
0 |
0 |
0 |
0 |
0 |
0 |
11 |
Narcotic Analgesics |
199 |
69 |
32 |
6 |
100 |
NR |
28 |
20 |
15 |
13 |
1 |
0 |
0 |
483 |
Cannabis |
113 |
95 |
28 |
12 |
120 |
NR |
22 |
35 |
7 |
18 |
0 |
1 |
0 |
451 |
Inhalants |
1 |
0 |
0 |
0 |
1 |
NR |
0 |
0 |
0 |
0 |
1 |
0 |
0 |
3 |
Medical |
9 |
1 |
2 |
0 |
6 |
NR |
1 |
4 |
1 |
2 |
0 |
0 |
0 |
26 |
Alcohol |
14 |
8 |
7 |
1 |
15 |
NR |
4 |
9 |
0 |
7 |
0 |
0 |
0 |
65 |
Not Impaired |
25 |
40 |
6 |
6 |
66 |
NR |
16 |
16 |
6 |
9 |
1 |
0 |
0 |
191 |
Refusal |
28 |
36 |
1 |
4 |
8 |
NR |
1 |
3 |
0 |
1 |
0 |
0 |
0 |
82 |
Total |
751 |
392 |
138 |
57 |
511 |
- |
109 |
135 |
41 |
95 |
3 |
1 |
0 |
2,333 |
BC |
AB |
SK |
MB |
ON |
QC |
NB |
NS |
PEI |
NFLD |
YK |
NWT |
NU |
Total |
|
|---|---|---|---|---|---|---|---|---|---|---|---|---|---|---|
Depressants |
167 |
84 |
12 |
15 |
222 |
388 |
12 |
24 |
3 |
18 |
0 |
0 |
0 |
945 |
Stimulants |
329 |
86 |
19 |
7 |
260 |
499 |
13 |
12 |
2 |
10 |
1 |
0 |
0 |
1,238 |
Hallucinogens |
4 |
0 |
0 |
0 |
1 |
7 |
0 |
0 |
0 |
0 |
0 |
0 |
0 |
12 |
Dissociative Anesthetics |
6 |
0 |
0 |
0 |
10 |
13 |
1 |
2 |
0 |
0 |
0 |
0 |
0 |
32 |
Narcotic Analgesics |
279 |
68 |
15 |
1 |
346 |
90 |
21 |
21 |
7 |
17 |
1 |
0 |
0 |
866 |
Cannabis |
187 |
79 |
17 |
6 |
277 |
299 |
28 |
51 |
8 |
16 |
0 |
0 |
0 |
968 |
Inhalants |
1 |
1 |
1 |
1 |
3 |
7 |
0 |
0 |
0 |
0 |
1 |
0 |
0 |
15 |
Medical |
8 |
4 |
3 |
NR |
34 |
NR |
3 |
NR |
1 |
2 |
0 |
0 |
0 |
55 |
Alcohol |
33 |
7 |
4 |
1 |
27 |
NR |
1 |
NR |
NR |
0 |
0 |
0 |
0 |
73 |
Not Impaired |
28 |
29 |
9 |
8 |
278 |
227 |
19 |
60 |
7 |
11 |
0 |
1 |
0 |
677 |
Refusal |
20 |
29 |
3 |
NR |
45 |
32 |
5 |
11 |
NR |
0 |
0 |
0 |
0 |
145 |
Total |
1,062 |
387 |
83 |
39 |
1,503 |
1,562 |
103 |
181 |
28 |
74 |
3 |
1 |
0 |
5,026 |
Poly Category |
356 |
28 |
12 |
NR |
433 |
247 |
21 |
23 |
6 |
17 |
1 |
0 |
0 |
1,144 |
BC |
AB |
SK |
MB |
ON |
QC |
NB |
NS |
PEI |
NFLD |
YK |
NWT |
NU |
Total |
|
|---|---|---|---|---|---|---|---|---|---|---|---|---|---|---|
Depressants |
219 |
55 |
39 |
9 |
371 |
441 |
27 |
33 |
6 |
40 |
- |
0 |
0 |
1,240 |
Stimulants |
541 |
85 |
52 |
11 |
474 |
591 |
41 |
18 |
15 |
22 |
- |
0 |
0 |
1,850 |
Hallucinogens |
0 |
1 |
0 |
1 |
9 |
13 |
0 |
0 |
0 |
0 |
- |
0 |
0 |
24 |
Dissociative Anesthetics |
7 |
1 |
0 |
0 |
22 |
27 |
1 |
1 |
0 |
0 |
- |
0 |
0 |
59 |
Narcotic Analgesics |
497 |
108 |
38 |
9 |
829 |
86 |
35 |
34 |
11 |
27 |
- |
0 |
0 |
1,674 |
Cannabis |
205 |
74 |
61 |
11 |
445 |
356 |
32 |
24 |
13 |
28 |
- |
0 |
0 |
1,249 |
Inhalants |
1 |
0 |
0 |
0 |
6 |
1 |
0 |
0 |
0 |
0 |
- |
0 |
0 |
8 |
Medical |
21 |
5 |
2 |
NR |
49 |
21 |
5 |
0 |
1 |
0 |
- |
0 |
0 |
104 |
Alcohol |
21 |
20 |
15 |
0 |
30 |
157 |
5 |
9 |
0 |
0 |
- |
0 |
0 |
257 |
Not Impaired |
56 |
52 |
33 |
6 |
380 |
217 |
30 |
11 |
9 |
13 |
- |
0 |
0 |
807 |
Refusal |
NR |
37 |
0 |
NR |
106 |
65 |
6 |
4 |
0 |
5 |
- |
0 |
0 |
223 |
Total |
- |
0 |
0 |
7,495 |
||||||||||
Poly Category |
541 |
26 |
31 |
9 |
865 |
334 |
42 |
32 |
15 |
33 |
NR |
0 |
0 |
1,928 |
BC |
AB |
SK |
MB |
ON |
QC |
NB |
NS |
PEI |
NFLD |
YK |
NWT |
NU |
Total |
|
|---|---|---|---|---|---|---|---|---|---|---|---|---|---|---|
Depressants |
224 |
60 |
14 |
5 |
503 |
375 |
19 |
25 |
14 |
15 |
1 |
NR |
NR |
1,255 |
Stimulants |
668 |
58 |
17 |
2 |
847 |
505 |
36 |
17 |
10 |
21 |
7 |
NR |
NR |
2,188 |
Hallucinogens |
4 |
1 |
0 |
1 |
6 |
7 |
0 |
1 |
0 |
1 |
0 |
NR |
NR |
21 |
Dissociative Anesthetics |
7 |
1 |
0 |
0 |
15 |
7 |
0 |
0 |
0 |
1 |
0 |
NR |
NR |
31 |
Narcotic Analgesics |
713 |
131 |
47 |
7 |
1278 |
97 |
26 |
22 |
14 |
18 |
8 |
NR |
NR |
2,361 |
Cannabis |
222 |
43 |
32 |
7 |
524 |
225 |
21 |
27 |
11 |
22 |
2 |
NR |
NR |
1,136 |
Inhalants |
0 |
0 |
0 |
0 |
5 |
5 |
0 |
4 |
0 |
0 |
- |
NR |
NR |
14 |
Medical |
7 |
7 |
0 |
0 |
28 |
24 |
4 |
2 |
0 |
3 |
0 |
NR |
NR |
75 |
Alcohol |
20 |
2 |
3 |
1 |
30 |
77 |
2 |
3 |
1 |
2 |
0 |
NR |
NR |
141 |
Not Impaired |
47 |
25 |
4 |
3 |
316 |
146 |
13 |
18 |
14 |
23 |
1 |
NR |
NR |
610 |
Refusal |
47 |
28 |
4 |
1 |
106 |
44 |
8 |
NR |
1 |
4 |
1 |
NR |
NR |
244 |
Total |
1,959 |
356 |
121 |
27 |
3,858 |
1,512 |
129 |
119 |
55 |
113 |
20 |
NR |
NR |
8,269 |
Poly Category |
701 |
25 |
30 |
4 |
1007 |
240 |
26 |
19 |
10 |
47 |
7 |
NR |
NR |
2,116 |
When considered alone, cannabis represented 19% of opinion categories in 2018 and 2019, 16% in 2020, and 14% in 2021.
Approved Drug Screening Equipment
As mentioned earlier, eleven jurisdictions have procured ADSE since their approval, but not all have actually used them. Data on the use of ADSE by law enforcement for 2021 was reported by seven provinces (Alberta, Saskatchewan, Manitoba, Ontario, Nova Scotia, PEI, and Newfoundland and Labrador)Footnote 35:
- Alberta: used 8 times, 4 positive (50%);
- Saskatchewan: 485 times, 257 positive (53%)
- Manitoba: used 44 times (39 by RCMP, 5 by Winnipeg Police Service), 39 (89%) positive for cannabis alone or in combination with cocaine
- Ontario: used 30 times, 20 (67%) positive
- Nova Scotia: used 67 times by RCMP, with 67 (100%) positive for THC (alone or in combination);
- PEI: used 17 times (including 4 RCMP), 12 (71%) positive
- Newfoundland: used 32 times, 100% positive
There appears to be an increasing level of use of ADSE in provinces that have procured the devices. The proportion of positive results (i.e., an impairing drug detected above authorized levels) ranged from 50% to 100%.
Blood Analyses
Data on the number of times blood samples were demanded in cases involving suspected DID was provided by the RCMP where it delivers provincial or municipal police services (all but Ontario and Quebec). Data for 2021 are lower due to the fact that toxicology laboratories were focusing their resources on the COVID-19 pandemic. Additionally, given lack of resources and time to obtain results, it is likely that a significant amount of data may be missing.
Table 12 below displays the total number of blood analysis by type of analysis requested and the number of toxicological results received from the RCMP labs only (excludes the Ontario and Quebec labs). In many cases, the toxicological analysis result reports are outstanding.
Alcohol and Drug Analysis Requested |
Drug Only Analysis Requested |
Total |
|||||||
|---|---|---|---|---|---|---|---|---|---|
2019 |
2020 |
2021 |
2019 |
2020 |
2021 |
2019 |
2020 |
2021 |
|
BC |
48 |
47 |
18 |
63 |
60 |
41 |
111 |
107 |
59 |
AB |
56 |
55 |
7 |
122 |
122 |
20 |
178 |
177 |
27 |
SK |
33 |
19 |
6 |
28 |
24 |
22 |
61 |
43 |
28 |
MB |
23 |
27 |
9 |
56 |
33 |
10 |
79 |
60 |
19 |
NB |
17 |
18 |
4 |
8 |
8 |
7 |
25 |
26 |
11 |
NS |
8 |
9 |
7 |
51 |
11 |
18 |
59 |
20 |
25 |
PE |
5 |
3 |
0 |
18 |
19 |
6 |
23 |
22 |
6 |
NL |
6 |
8 |
6 |
9 |
12 |
14 |
15 |
20 |
20 |
YT |
1 |
1 |
0 |
0 |
0 |
1 |
1 |
1 |
1 |
NU |
1 |
0 |
0 |
0 |
0 |
0 |
1 |
0 |
0 |
NT |
0 |
0 |
0 |
0 |
1 |
0 |
0 |
1 |
0 |
Total |
198 |
187 |
57 |
355 |
290 |
139 |
553 |
477 |
196 |
*11 cases were removed as the type of analysis requested was not specified.
Of the cases that were submitted for a blood analysis request, the below table displays the frequency of the per se drugs that were found in the blood analysis. In the cases where the blood analysis was found to be negative for drugs, it's possible that those cases were alcohol and drug cases, and could have tested positive for alcohol.
2019 |
2020 |
|||
|---|---|---|---|---|
n |
% |
n |
% |
|
THC |
140 |
44.7% |
49 |
38.3% |
Methamphetamine |
89 |
28.4% |
49 |
38.3% |
Cocaine |
29 |
9.3% |
14 |
10.9% |
Negative - No drugs found |
25 |
8.0% |
8 |
6.3% |
GHBFootnote 37 |
14 |
4.5% |
5 |
3.9% |
THC Metabolite |
11 |
3.5% |
0 |
0.0% |
Ketamine |
4 |
1.3% |
2 |
1.6% |
LSD |
1 |
0.3% |
1 |
0.8% |
Total |
313 |
100% |
128 |
100% |
Of the cases where THC was found in the blood analysis, the table below displays the prevalence of each blood drug concentration delineated between the hybrid and summary offence categories. The results in the table are not specific to ADSE usage and are only displaying the frequency of each category of THC concentration. There can be multiple per se drugs found per incident.
2019 |
2020 |
|||
|---|---|---|---|---|
n |
% |
n |
% |
|
≥ 5 ng/mL |
72 |
51.4% |
27 |
55.1% |
≥ 2 ng/mL and < 5 ng/mL |
44 |
31.4% |
12 |
24.5% |
< 2 ng/mL |
24 |
17.1% |
10 |
20.4% |
Total |
140 |
100.0% |
49 |
100% |
The table below displays the frequency of drug categories found in the blood analysis results. The table only includes frequencies of drugs that are outside of those included in the per se limit offences. For example, since cocaine is a per se limit drug, but it is also a stimulant, it has been excluded from the below table since it would be accounted for in Table 8. There can be multiple per se limit drugs and drug categories per incident.
2019 |
2020 |
|||
|---|---|---|---|---|
n |
% |
n |
% |
|
Stimulants |
86 |
41.7% |
5 |
55.6% |
Depressants |
46 |
22.3% |
3 |
33.3% |
Narcotic Analgesic |
34 |
16.5% |
1 |
11.1% |
Alcohol |
35 |
17.0% |
0 |
0.0% |
Hallucinogens |
2 |
1.0% |
0 |
0.0% |
Dissociative Anesthetics |
2 |
1.0% |
0 |
0.0% |
Inhalants |
1 |
0.5% |
0 |
0.0% |
Total |
206 |
100.0% |
9 |
100.0% |
Results
Charges Footnote 41
Statistics Canada's 2021 Juristat article on Impaired Driving (Perreault, 2021) indicates that the rate of all impaired driving incidents cleared by charge is generally declining: it was almost 90% in 1989, about 71% in 2015, 63% in 2018, and 56% in 2019. An even smaller proportion of DID incidents are cleared by charge: 57% in 2018 and 49% in 2019. This may be due in part to increased use of administrative sanctions in alcohol-impaired driving cases as opposed to criminal charges, as well as the challenges associated with investigating and prosecuting a DID offence, as previously discussed.
Given that the legislation was only adopted in the later part of 2018 and that bringing charges to prosecution may be a long process, data presented below from provincial and territorial annual reports for 2021 may not reflect the full extent of the DID charges. The DID charges being analysed in this section include: 320.14(1)(a), (c), (d), and 320.14(4). Furthermore, and most importantly, P/T data on 320.14(1)(a) includes cases of alcohol impaired driving, which obviously skews the findings. Data provided by jurisdictions for 2021 is as follows:
- In BC , 2,577 incidents were cleared by charge or cleared by charge recommended under 320.14(1)(a), (c), (d), or 320.14(4). Of those, 574 were specific to drug impaired driving or drug and alcohol impaired driving in combination.
- In Alberta, 540 charges were laid under 320.14(1)(a), (c), (d), or 320.14(4).
- In Saskatchewan, 3,190 charges were laid under 320.14(1)(a), (c), (d), or 320.14(4).
- In Manitoba, 194 charges were laid under 320.14(1)(a), (c), (d), or 320.14(4).
- In Ontario 4,382 charges were laid under 320.14(1)(a), (c), (d), or 320.14(4).
- In New Brunswick, 59 total charges were laid under 320.14(1)(a), (c), (d), or 320.14(4), 49 of which were on behalf of the RCMP.
- In Nova Scotia, 1,495 charges were laid under 320.14(1)(a), (c), (d), or 320.14(4).
- In NWT, there were 105 charges laid under 320.14(1)(a), (c), (d) or 320.14(4).
- In Yukon there was 1 charge laid under 320.14(1)(a), (c), (d) or 320.14(4).
Youth Charged with Impaired Driving
A research team conducted a study commissioned by the CCSA to examine the impacts of cannabis legalization on youth, and vulnerable youth in particular.Footnote 42 One of the elements examined was drug-impaired driving.
The authors conducted an analysis using Statistics Canada data, the authors examining charges related to driving while impaired on drugs. Pre-legalization charges included operation of a vehicle while impaired by drugs. Post-legalization charges included: 1) operation of a vehicle while impaired by drugs; 2) operation of a vehicle while impaired by drugs and alcohol; and 3) operation of a vehicle while impaired (unspecified).
The data indicate that driving while impaired charges (note that this includes all drugs, not just cannabis, as well as the combination of alcohol and drugs), in Canada, increased significantly after cannabis legalization. In 2015, only 2,549 impaired charges were issued. By 2019, this figure had risen to 11,958 charges, an increase of 369%.
Age group of the accused |
Year |
Percent change 2015 - 2021 |
|||||
|---|---|---|---|---|---|---|---|
Pre-legalization |
Post-legalization |
||||||
2015 |
2016 |
2017 |
2019 |
2020 |
2021 |
||
12-17 |
56 |
54 |
59 |
77 |
57 |
49 |
-12.50 |
18-24 |
578 |
698 |
711 |
673 |
885 |
638 |
10.38 |
25-34 |
826 |
957 |
1,085 |
1,242 |
1,882 |
1,734 |
109.93 |
35+ |
1,134 |
1,230 |
1,305 |
1,927 |
2,476 |
2,658 |
134.49 |
Total |
2,594 |
2,939 |
3,160 |
3,919 |
5,300 |
5,079 |
95.80 |
All provinces and territories, except for the Yukon and Nunavut, experienced a significant post-legalization rise in DID charges.Footnote 44 However, the magnitude of this increase varied dramatically by region and age group. Three provinces (Newfoundland and Labrador, New Brunswick and Manitoba) experienced increases of less than 100%. Five regions (Prince Edward Island, Quebec, Saskatchewan, British Columbia and the Northwest Territories) experienced increases of between 100% and 200%. Two provinces (Nova Scotia and Alberta) experienced increases in impaired charges between 200% and 500%. Ontario experienced – by far – the greatest post-legalization increase in impaired driving charges: from only 439 cases in 2015 to 6,334 cases in 2019; this represents a 1,185% increase in driving while impaired (on drugs) charges over this five-year period.
Youth 12-17 years represent a small minority of those charged with driving while impaired offences (less than 3% across the study period). While they also experienced a significant increase in impaired-driving charges following cannabis legalization, the increase was far less than for older adults. In 2015, prior to cannabis legalization, only 54 impaired driving charges were laid against young offenders. This figure rises to only 127 charges in 2019 – a 135% increase. In comparison, the rate increased by 258% for young people aged 18-24.
Only seven of the thirteen provinces and territories – PEI, Nova Scotia, Quebec, Ontario, Manitoba, Alberta, and the Northwest Territories – experienced a post-legalization increase in youth impaired driving charges. All other regions remained stable or experienced a post-legalization decline. Post-legalization, the Northwest Territories has the highest youth impaired driving charge rate (59.1 per 100,000). Prince Edward Island, Nova Scotia, Quebec, and Alberta also have a post-legalization youth charge rate above the national average (5.2 per 100,000). The charge rates for all other provinces and territories fall below the national average
Convictions
Over the period examined in Statistics Canada's 2019 Juristat on impaired driving (2010/11 to 2018/19) (Perreault, 2021) DID cases (64%) were less likely to result in a guilty finding (whether by plea or decision) than alcohol-impaired driving incidents (82%). However, the proportion of DID cases resulting in a guilty finding has risen over the same period from 64% in 2010/11 to 70% in 2018/19.
Given the length of time required to process DID charges in court (median of 115 days in 2018-2019; Perreault, 2021:22), few jurisdictions presented data on convictions for DID cases in their annual report, and it was incomplete in most cases. One of the factors contributing the lower proportion of DID incidents resulting in a guilty finding compared to alcohol impaired driving cases is the amount of time it takes to complete an investigation (including getting toxicology results). It is very rare for a case to be completely adjudicated in the same year that the offence occurred, except in cases where a guilty plea is entered. The longer processing time for DID cases means that many cases will be adjudicated in the following year and may still result in a finding of guilt.
It should also be noted that convictions under 320.14(a) include a number of cases (likely the majority) where alcohol was also involved.
Court data compiled by jurisdictions for 2021 is as follows:
- In BC, there were 2,141 convictions under section 320.14(a), (c), or (d), with a 89% conviction rate.
- In Alberta, there were 86 convictions under section 320.14(a), (c), or (d), with a 15.93% conviction rate.
- In Saskatchewan, there were 694 convictions under section 320.14(a), (c), or (d), with a 29% conviction rate.
- In Ontario, there were 4,276 cases where the accused entered a plea of guilt, or was found guilty under sections 320.14(a), (c), or (d).Footnote 45
- In Nova Scotia, there were 171 convictions under section 320.14(a), (c), or (d), with a 12% conviction rate.
- In NWT, there were 4 convictions, all under 320.14(1)(a).
- In the Yukon there were 16 convictions under section 320.14(1)(a), (c), or (d).
Penalties and Sentences
The Juristat on impaired driving (Perreault, 2021:21) indicates that over the 9-year period from 2010 to 2019, the sentences most often imposed for impaired driving were fines and driving prohibitions, with the amount of fines for DID cases being slightly lower than for alcohol-impaired driving cases on average.
The following jurisdictions provided data on sentences and administrative sanctions imposed under either the criminal or administrative regime in 2021:
- In BC, 1% of convictions resulted in a custodial sentence, while 32% resulted in fines and 9% in probational order. All administrative sanctions imposed resulted in a combination of measures (drivers license suspension, vehicle impoundment, and/or fine).
- In Alberta, 52 convictions resulted in a custodial sentence, 36 in a fine, and 18 probational orders.
- In Saskatchewan 101 received a custodial sentence, 587 fines, 279 probational orders, and 684 driving suspensions.
- In Ontario, fines remained the most serious sentence imposed, making up 73% of all sentencing cases. Probation was included in 14% of all sentenced cases, conditional sentencing orders made up 10%, and custody alone represented 7% of all sentence in 2021. In total, 281 were sentenced to custody, and 3,135 were sentenced to fine. There were 21,563 administrative sanctions imposed on drivers relating to drug-impaired driving.
Type of Suspension |
Description |
Total |
|||
|---|---|---|---|---|---|
2018 |
2019 |
2020 |
2021 |
||
Administrative Driver's Licence Suspension |
90-day licence suspension for those detected driving with BAC > 0.08% |
12,644 |
13,473 |
12,277 |
12,908 |
Suspend Driver Warn Range BAC |
3, 7, or 30-day licence suspension for those detected with BAC > 0.05% |
7,287 |
6,683 |
4,904 |
4,946 |
90-day ADLS - DRE |
90-day suspension for those found to be impaired by drugs by a Drug Recognition Expert/Evaluator |
864 |
1,230 |
2,197 |
2,555 |
Short Term - SFST |
3, 7, 30-day license suspension for drivers who fail the SFST at roadside |
165 |
140 |
111 |
179 |
Zero BAC Admin Suspension - Novice |
3, 7, 30-day suspension for Novice drivers with presence of alcohol |
301 |
526 |
542 |
638 |
Zero BAC Admin Suspension - Under 22 Years |
3, 7, 30-day suspension for young (<22 years) non-novice drivers with presence of alcohol |
63 |
139 |
108 |
89 |
Zero Drug Admin Suspension - Novice |
3, 7, 30-day suspension for Novice drivers with presence of drugs detected via approved drug screening equipment* |
6 |
63 |
104 |
110 |
Zero Drug Admin Suspension - Under 22 Years |
3, 7, 30-day suspension for young (< 22 years) non-novice drivers with presence of drugs detected via approved drug screening equipment* |
6 |
15 |
16 |
15 |
Zero BAC Admin Suspension - Commercial |
3-day suspension for commercial drivers with presence of alcohol |
43 |
110 |
103 |
97 |
Zero Drug Admin Suspension - Commercial |
3-day suspension for commercial drivers with presence of drugs as detected by approved drug screening equipment* |
4 |
11 |
20 |
26 |
Total |
21,383 |
22,390 |
20,382 |
21,563 |
|
*Note: Approved drug screen equipment was first approved by the federal Minister of Justice on August 22, 2018.
- In Nova Scotia, license suspension was also the most common sentence imposed resulting in 156 instances. Additionally, there were 141 fines, 10 conditional sentences, 38 probation orders, and 24 custodial sentences. There were 119 administrative sanctions imposed on drivers relating to drug impaired driving in 2021.
- In Yukon, the most common sentence for alcohol/drug driving convictions was 1-2 years driving prohibitions and fines ranging from $1000 to $3000. There were 134 fines imposed, 51 custodial sentences, 41 conditional and suspended sentences, 18 probation orders, and 9 other court outcomes.
Analysis and Conclusions
In most jurisdictions across Canada, data sources (population surveys, roadside surveys, police-reported incidents, as well as coroners' toxicological analyses) tend to indicate an ongoing trend over the past 10-12 years of DID incidents increasing as a proportion of all impaired-driving incidents, with cannabis being one the most frequently detected class of drug among drivers.
On one hand, there are some concerning indicators. Cannabis users, especially daily or almost daily users, are more likely to think that cannabis use does not impair driving. In addition, despite increased public awareness campaigns and new and enhanced tools for police to enforce DID laws, only 25% of Canadians believe that it is very likely that they will get caught if they drive under the influence of cannabis. And while police-reported data show a significant decline in the overall number of impaired driving incidents over the past ten years, the proportion of DID incidents reported by police has significantly increased from about 2% of the total in 2009, to approximately 11% in 2021. It is possible that the increase in the proportion of police-reported DID incidents may be related more to enhanced awareness, and the increase in training and new detection and investigation capacities among law enforcement personnel, than to trends in the actual behaviour of driving after cannabis and/or other drug use. Another preoccupying result was provided by the Brubacher study showing an increased prevalence of injured drivers with levels of THC in blood at or higher than prescribed levels following legalization. Future years of data in self-reported and detected behaviour may help determine if there is indeed an increase in actual drug-driving behaviour.
On the other hand, survey data tend to indicate that public education and awareness campaigns conducted nationally by Public Safety Canada and in provinces and territories may have contributed to changing Canadians' perceptions around driving after cannabis use, with an increasing number of respondents agreeing that cannabis use impairs driving abilities. In particular, the proportion of Canadians reporting driving after cannabis use has continued to decline in 2021.
Whether the current levels of law enforcement capacity to effectively detect and deter DID are sufficient cannot be determined. Nevertheless, despite the COVID-19 pandemic halting progress in 2020, there has been a significant increase in law enforcement capacity building through enhanced training in SFST, DRE and the use of ADSE. There are almost 20,000 officers trained in SFST, a lower number than in 2020, due to the continued impacts of the pandemic on training activities. Data on the use of SFST is now collected by more jurisdictions than in previous years, showing significant results at screening drivers who may have recently used cannabis. Eleven of thirteen jurisdictions have now procured ADSEs and their use is increasing, yielding generally high correlation with further investigations of drivers whether through blood sample analysis or a DRE. It can be expected that their use will continue increasing as law enforcement becomes more and more familiar with these tools. Data indicates that there were 1,211 active DREs at any point in time in 2021, compared to 1,150 in 2020. Furthermore, data on use of DRE shows that it has continued to increase in 2021 at a rate faster than the increase in the number of trained officers: use of DRE has doubled since 2018, while the number of certified DRE officers has increased by approximately 51% between 2018 and 2021. Officers conducted 5,548 DRE evaluations in 2021, a slight decrease form 2020. The proportion of DRE category opinions is variable but tends to be higher for "drugs" in general than for cannabis specifically.
Furthermore, available data indicate that these tools are highly reliable: when a DRE and/or blood sample are requested further to a failed SFST, there tends to be a high level of correlation (i.e., a poor result on SFST tends to be confirmed by a DRE and/or blood analysis).
Given that processing time for DID cases by police and courts tends to be significantly longer than in cases of alcohol-impaired driving, data on charges and their results remains preliminary. There is a long-standing and continuing trend where charges are laid more frequently and lead to higher levels of convictions for alcohol than for DID cases. There also appears to be a trend where administrative penalties under provincial/territorial legislation may be used more often than proceeding with criminal charges. However, future year data and additional analyses will be required to validate these early trends.
Finally, work is continuing at the FPT table and with key stakeholders such as the Canadian Association of Chiefs of Police to further improve the completeness and accuracy of available data.
References
Brubacher, J.R., et. al. (2019) Cannabis use as a risk factor for causing motor vehicle crashes: a prospective study
Conseil canadien des administrateurs en transport motorisé (2019) A Compilation of Jurisdictional Roadside Surveys Conducted prior to Cannabis Legalization. (anglais seulement) Ottawa.
Compton, R. (2017) Marijuana-impaired driving: A report to Congress. Washington, National Highway Traffic Safety Administration.
Owusu-Bempah, A., Wortley, S. and Schlapak, R., (2021) What's changed? Cannabis Legalization and Youth Contact with the Justice System. Ottawa: Canadian Centre on Substance Use and Addictions.
Moreau, G. (2021) Police-Reported Crime Statistics in Canada, 2020. Statistics Canada
Perreault, S. (2021) Impaired Driving in Canada, 2019. Statistics Canada.
Perreault, S. (2016) Impaired Driving in Canada. Statistics Canada, Statistics Canada.
Porath-Waller, A.J. et D.J. Beirness (2014) « An examination of the validity of the Standardized Field Sobriety Test in detecting drug impairment using data from the Drug Evaluation and Classification Program. » Traffic Injury Prevention, 15, 125-131.
Porath, A.J. et D.J. Beirness (2019) « Predicting categories of drugs used by suspected drug-impaired drivers using the Drug Evaluation and Classification Program Tests. » Traffic Injury Prevention.
Robertson, R.D. et coll. (2017) « Prevalence and Trends of Drugged Driving in Canada. » Accident Analysis and Prevention. Vol.99, partie A.
- Date modified: