Annual National Data Report to Inform Trends and Patterns in Drug-Impaired Driving 2021

Table of contents
- Executive Summary
- Introduction
- The Legislative and Programmatic Context
- Trends and Patterns in Drug-Impaired Driving
- What is Being Done to Address Drug-Impaired Driving
- Preventative Interventions
- Law Enforcement Capacity Building
- Standardized Field Sobriety Test (SFST) Training
- Drug Recognition Expert (DRE) Training and Certification
- Approved Drug Screening Equipment (ADSE)
- Law Enforcement Interventions
- Standard Field Sobriety Testing
- Drug Recognition Evaluation
- Approved Drug Screening Equipment
- Blood Analyses
- Results
- Analysis and Conclusions
- References
Executive Summary
In the context of cannabis legalization, the Government of Canada introduced legislation to create new offences and provide additional tools to law enforcement to detect and deter drug-impaired driving (DID). Furthermore, to support the implementation of this new legislative framework, the Government invested $161M over five years initially to enhance training of frontline law enforcement officers in how to recognize the signs and symptoms of drug-impaired driving, build law enforcement capacity across the country, provide access to approved drug screening equipment (ADSE), develop policy, bolster research, and raise public awareness about the dangers of drug-impaired driving. An important part of this initiative is to inform Canadians on activities undertaken to address DID and their results. It is the purpose of this annual report.
This is the second annual report on trends and patterns in DID. It is produced in cooperation with the provinces and territories, the RCMP, CBSA, and other partner agencies and stakeholders.
Whenever possible, it updates data from the 2020 report. However, the COVID-19 pandemic resulted in a significant reduction in planned activities, in particular the training of law enforcement officers. Nevertheless, the report's findings show that the federal initiative has continued to enhance law enforcement capacity to detect and deter DID. It has also continued to change Canadians' attitudes towards driving after cannabis use. Furthermore, data from police and border-reported incidents as well as toxicological analyses from coroners and medical examiners indicates that the number of incidents involving drivers with drugs in their system, including cannabis, has been constantly increasing since 2008 as a proportion of all impaired driving incidents.
Work to address outstanding data gaps (e.g., lack of some law enforcement or toxicology data) as well as issues with the completeness and comparability of data has continued in 2020.
Introduction
In spite of significant declines over the past 30 years, impaired driving, whether by alcohol or drugs, continues to kill or injure more Canadians than any other crime (Moreau, 2021). It also remains the single most important factor contributing to serious road crashes (CCSA, 2019). Furthermore, recent statistics show that the number of police reported drug-impaired driving (DID) incidents have increased by 19% from 2019 to 2020 (Moreau, 2021).
It is no surprise then that with the legalization of cannabis, Canadians expressed concerns over road safety. Public opinion surveys showed that well over 80 percent of Canadians believed that DID would likely increase as a result of cannabis legalizationFootnote 1. This is why new Criminal Code provisions were enacted in 2018 to criminalize driving with prohibited levels of certain drugs in blood, strengthen penalties and provide additional tools and means to law enforcement to detect and deter impaired driving, including DID. Furthermore, in September 2017, the federal government announced $161 million for training frontline officers in how to recognize the signs and symptoms of drug-impaired driving, building law enforcement capacity across the country, providing access to approved drug screening equipment (ADSE), developing policy, bolstering research, and raising public awareness about the dangers of drug-impaired driving.
Part of this initiative included a commitment to report to Canadians on activities undertaken to address the issue of DID and their results; it is the purpose of this report.
The report focuses on three broad questions:
- What can we say about trends and patterns in DID?
- What is being done to address DID?
- What are the results of these actions?
This report is the result of a collective effort undertaken in 2018 by the Federal/Provincial and Territorial (FPT) working group (WG) on DID. Comprised of representatives from all jurisdictions, as well as key stakeholders from the Department of Justice Canada, the Royal Canadian Mounted Police (RCMP), the Canada Border Services Agency (CBSA) and Transport Canada, the WG set out to work on identifying a series of indicators to help address these questions. The WG also engaged with key expert organizations such as Statistics Canada (STC) and the Canadian Centre on Substance Use and Addictions (CCSUA) as well as selected academics, to assess the relevance, reliability, availability and accessibility of data for these various indicators. In conducting this analysis, the WG benefitted in particular from a comprehensive exercise undertaken by the CCSUA to identify a set of national indicators on DID. The WG agreed on a preliminary set of indicators in spring 2019, which was further refined in September 2019. Subsequently, jurisdictions were asked to collect, collate and report data on as many of these indicators as possible. The first annual trends and patterns report was published in 2020, and covered the 2019 calendar year.
This report synthesizes the data for calendar year 2020 provided by jurisdictions in their annual reports, as well as data from the RCMP and the CBSA. Data from reports and research studies from other sources (e.g., STC; CCSUA) is also used.
The first section of this report, sets the context by describing the new legislative regime on DID and the accompanying federal initiative. The following section presents available data on trends and patterns in DID. The final two sections present data on what is done to address DID and results achieved. The conclusion summarizes the key findings and discusses next steps.
As every Canadian knows, the COVID-19 pandemic profoundly affected our lives and activities in 2020. It was no different for activities planned under this initiative. For the most part, no training of law enforcement officers including border services officers (BSOs) was delivered during 2020. It is also likely that, in addition to law enforcement interventions, patterns in DID were affected by the general reduction in professional and social activities requiring Canadians to use their vehicles. In addition, the closure of the Canada-United States land border to all but essential traffic has also presumably impacted enforcement data. As such, while the annual report is designed to monitor the evolution of trends and patterns in DID year-over-year, 2020 is most likely an unusual year.
The Legislative and Programmatic Context
Driving while impaired by a drug has been a criminal offence since 1925, but this offence has always been challenging to prove.
Detecting and proving impairment caused by drugs is different and more complex than detecting and proving impairment caused by alcohol. Alcohol is a simple molecule with predictable impairing effects. As alcohol is consumed, blood alcohol concentration (BAC) rises; and the higher the BAC, the more profound the impairment and the greater the risk of a serious road crash. The same correlation does not always exist for other drugs since their impairing effects and impacts on driving behaviour may vary depending on the substance, method of ingestion, and characteristics of the person and their consumption habits. In the case of cannabis, it is generally agreed that it can impair a person's ability to drive. However, there is no scientific consensus on the relationship between the concentration of THC, its main psychoactive substance, in blood and the degree of impairment.Footnote 2
In 2008, new tools were authorized to facilitate the investigation of drug-impaired driving. These include the Standardized Field Sobriety Tests (SFST) used at the roadside (a three-pronged test consisting of walk and turn, one leg stand and horizontal gaze nystagmus) and the Drug Recognition Evaluation conducted at the police station by a certified drug recognition expert (DRE). The Drug Recognition Evaluation is a 12–step evaluation that is designed to determine if the individual is impaired by a drug. In order to use either of these tools, the officer has to be specially trained in accordance with standards developed by the International Association of Chiefs of Police (IACP).
In the context of cannabis legalization, it was determined that more needed to be done to strengthen the criminal law regime with respect to drug-impaired driving. This was done as part of An Act to amend the Criminal Code (offences relating to conveyances) and to make consequential amendments to other Acts, which enacted new offences, and authorized new tools to enhance the detection and prosecution of drug-impaired drivers.
Specifically, the new measures:
- Authorize the police to use “approved drug screening equipment” (e.g., oral fluid drug screeners) at the roadside;
- Enact three new offences of having a prohibited blood drug concentration (BDC) within two hours of driving;
- Facilitate the ability of a police officer to demand a blood sample from a driver; and
- Permit a DRE to testify without requiring them to be qualified as an expert in every case, consistent with the 2017 Supreme Court of Canada decision in R v Bingley.
With the addition of the new offences, the text of the Criminal Code impaired driving offences currently reads as follows:
320.14 (1) Everyone commits an offence who
(a) operates a conveyance while the person's ability to operate it is impaired to any degree by alcohol or a drug or by a combination of alcohol and a drug;
(b) subject to subsection (5), has, within two hours after ceasing to operate a conveyance, a blood alcohol concentration that is equal to or exceeds 80 mg of alcohol in 100 mL of blood;
(c) subject to subsection (6), has, within two hours after ceasing to operate a conveyance, a blood drug concentration that is equal to or exceeds the blood drug concentration for the drug that is prescribed by regulation; or
(d) subject to subsection (7), has, within two hours after ceasing to operate a conveyance, a blood alcohol concentration and a blood drug concentration that is equal to or exceeds the blood alcohol concentration and the blood drug concentration for the drug that are prescribed by regulation for instances where alcohol and that drug are combined.
320.14 (4) Subject to subsection (6), everyone commits an offence who has, within two hours after ceasing to operate a conveyance, a blood drug concentration that is equal to or exceeds the blood drug concentration for the drug that is prescribed by regulation and that is less than the concentration prescribed for the purposes of paragraph (1)(c).
The prohibited BDC levels are not found in the Criminal Code, but instead, are set by regulation.Footnote 3 For paragraph 320.14(c), the prohibited BDC levels are 5 ng or more of THC per ml of blood, 5 mg GHB per L of blood, and any detectable level of LSD, 6-Monoacetylmorphine (a metabolite of heroin), Ketamine, Phencyclidine (PCSP), Cocaine, Psilocybin, Psilocin and Methamphetamine in blood. For paragraph 320.14(d), the prohibited levels are a blood alcohol concentration of 50 mg of alcohol per 100 ml of blood in combination with 2.5 ng of THC per mL of blood. Finally, for subsection 320.14(4), the prohibited blood drug concentration (BDC) level is between 2 ng and 5 ng THC per ml of blood.
As noted, the Government authorized the use of approved drug screening equipment (ADSE) at the roadside.
ADSE can be used by police to detect the presence of some drugs in oral fluid, including THC. The police and BSOs can demand an oral fluid sample, if they have reasonable grounds to suspect a drug is in a driver's body. Reasonable suspicion that the driver has drugs in their body can be developed based on evidence of recent consumption of drugs and other objective facts, such as:
- red eyes
- muscle tremors
- agitation
- abnormal speech patterns
If a driver tests positive on an ADSE the positive result confirms the presence of the drug and, combined with other signs of impairment or drug use observed by the police at the roadside, may provide grounds for the investigation to proceed further by making a demand for a blood sample or a drug recognition evaluation. Similar screeners are used in other countries including the United Kingdom and Australia.
Currently, there are two approved devices available for use by law enforcement in Canada: the Dräger DrugTest® 5000 and a Dräger DrugTest® 5000 STK-CA, when used together, and SoToxa™, an Abbott SoToxa™ Test Cartridge and an Abbott SoToxa™ Oral Fluid Collection Device. They will be referred to as the Dräger and SoToxa in the remainder of this report.
The Federal Initiative
In September 2017, the Government of Canada announced that it was investing $161 million over five years to support the implementation of the new legislative regime on DID and build law enforcement capacity across Canada to recognize the signs and symptoms of DID, provide access to ADSE, develop policy, bolster research, and raise public awareness about the dangers of DID.
Of this funding envelope, $81 million was set aside specifically for Provinces and Territories (PTs) to ensure that they would be able to provide police officers with the training and tools they need. In particular, this funding was designed to enhance training on the Standard Field Sobriety Test (SFST) and the Drug Recognition Expert (DRE) program; support the acquisition of ADSE; and collect standardized national data on DID trends and patterns. In addition, $12 million was allocated to the CBSA to provide BSOs with the training and tools to interdict impaired driving at the land border.
At the time when the federal initiative was launched, there were approximately 13,000 SFST trained law enforcement officers and close to 600 DREs across the country. Prior to this initiative, the CBSA did not train BSOs on detecting drug-impaired driving; officers were only trained in detecting alcohol-impaired driving. The CBSA committed to training 1,425 BSOs in the administration of the SFST. The objective is that 33% of front-line law enforcement officers and 30% of BSOs working at the land border will have been trained in SFST, and there will be 1250 active DREs by the end of the initiative, which is currently set to end in March 2025. Currently available statistics indicate that there are now approximately 27,300 SFST trained officersFootnote 4 and over 1,100 DREs. Public Safety Canada continues to work with PTs to help meet their training and capacity needs; over $16 million in funding was available in FY 2020-2021.
A significant part of this initiative, in the context of cannabis legalization, is to monitor trends and patterns in DID. As such, Public Safety Canada (PS) is expected to:
- Produce annual reports on the scope and trends in DID, law enforcement capacity and action, impacts on public safety, successes and challenges, and impacts of cannabis legalization on road safety;
- Conduct research, including on the impairing effects of smoked and edible cannabis;
- Lead a horizontal evaluation of the initiative; and
- Contribute data on DID for the mandatory three-year review of the new impaired driving legislation led by Justice Canada.
As noted earlier, a FPT DID working group (DID WG) comprised of data analysts hired by PTs with the contribution program funding, PS representatives, and key stakeholders (e.g., RCMP, CBSA, Justice) has been created. In 2019, the WG developed a common framework and set of indicators which have since been used for the preparation of the annual data report. The WG continues to share information on current data collection practices, gaps and challenges, and next steps to improve data coverage and completeness.
Provincial and Territorial Initiatives
In response to cannabis legalization, all provinces and territories modified their existing legislation, including on drug-impaired driving. Most jurisdictions have adopted some form of zero tolerance policy for some categories of drivers: young, novice, and commercial motor vehicle drivers. Sanctions are generally graduated and can include administrative license suspensions (e.g. immediate, 30, 45, or 60 days), fines or license reinstatement fees, ignition interlock requirements, and vehicle impoundment. The Canadian Centre on Substance Use and Addiction (CCSA) has prepared an overview of administrative sanctions in provinces and territories which can be consulted online.
Trends and Patterns in Drug-Impaired Driving
There are various ways of measuring DID occurrences and incidents: population surveys asking a sample of Canadians to report on their driving behaviour after drug use; roadside surveys collecting oral fluid samples from a sample of voluntary drivers generally at night time and during summer months; police and border services officer (BSO) reported incidents; and toxicological analyses of fatally injured drivers by coroners and medical examiners.
No single source is sufficient on its own and each has its limitations. Self-reported behaviour is hampered by accuracy and/or unwillingness to disclose behaviour. Roadside surveys' limitations include: the drug detection method (oral fluid) only indicates presence or absence of drugs; they are conducted in a small number of locations and at very specific and limited points in time; and they only involve drivers who agree to participate. Police and border service officer reported incidents only include incidents detected by or which come to the attention of law enforcement and may significantly under-estimate the true prevalence of impaired driving. Finally, coroners' toxicological data is limited by factors such as the level of toxicological analyses conducted (e.g., in some cases once alcohol is detected at an impairing level, they will not proceed with drug analysis), variable methodology between jurisdictions, and insofar as cannabis specifically, issues related to the unique characteristics of THC in blood.
The following sections present available data from each of these various sources.
Self-Reported Behaviour
Conducted by Health Canada, the Canadian Cannabis Survey (CCS) measures a variety of indicators related to cannabis, including self-reported driving behaviour following cannabis use among a sample of Canadians. The latest figures show that some 22% of past 12-month users with a valid driver's license reported driving a vehicle within two hours of cannabis use, a reduction from 26% in 2019.Footnote 5 Results by jurisdiction are as follows:Footnote 6
| Province and Territories | % of people who drove within 2 hours of smoking cannabis | How long ago did this happen? | ||||
|---|---|---|---|---|---|---|
| Within the past 30 days | Within the past 12 months | |||||
| 2019 | 2020 | 2019 | 2020 | 2019 | 2020 | |
| BC | 32% | 27.5% | 41.3% | 39.4% | 33.8% | 35.8% |
| AB | 30.5% | 22.1% | 43.0% | 35.9% | 34.5% | 34.0% |
| SK | 34.6% | 32.9% | - | - | - | - |
| MB | - | 29.2% | - | - | - | - |
| ON | 22.3% | 20.8% | 38.7% | 38.1% | 28.8% | 28.0% |
| QC | 26.5% | 17.0% | 54.9% | 39.5% | 26.9% | 39.2% |
| NB | 24.8% | 22.4% | - | - | - | - |
| NS | 25.1% | 17.4% | - | - | - | - |
| PEI | 27.9% | 25.4% | - | - | - | - |
| NL | 27.3% | 25.3% | - | - | - | - |
| Territories | - | - | - | - | - | - |
| Canada | 26.4% | 22.0% | 43.5% | 39.2% | 31.3% | 32.0% |
Starting in 2020, the CCS has added a similar question but focussing on ingested cannabis products. This is an important addition since the effects of edible cannabis products on driving behaviour are likely different from those of smoked or vaped cannabis.
| Province and Territories | % of people who drove within 4 hours of ingesting cannabis | How long ago did this happen? | |
|---|---|---|---|
| Within the past 30 days | Within the past 12 months | ||
| BC | 17.5% | - | 41.7% |
| AB | 13.2% | - | - |
| SK | - | - | - |
| MB | - | - | - |
| ON | 13.0% | 30.7% | 41.3% |
| QC | 9.9% | - | 40.7% |
| NB | - | - | - |
| NS | - | - | - |
| PEI | - | - | - |
| NL | - | - | - |
| Territories | - | - | - |
| Canada | 13.4% | 31.6% | 39.7% |
It appears that no province or territory conducted population surveys of self-reported behaviour in 2020. Readers interested in the findings of previous years' provincial and territorial surveys may wish to consult the 2020 annual data report.
Roadside Surveys
No province or territory conducted a roadside survey in 2020 or 2019. However, five jurisdictions conducted surveys in 2018, prior to cannabis legalization, providing a baseline against which to measure post-legalization change. These include: Manitoba (2016), Ontario (2017), British Columbia (2018), Yukon (2018), and Northwest Territories (2018). The Canadian Council of Motor Vehicle Administrators (CCMTA) has produced a synthesis of these surveys' findings.Footnote 7
Of the total 7,265 drivers randomly selected, 80.7% accepted to participate, 97.7% provided a breath sample to detect alcohol and 90.2% an oral fluid sample to detect the presence of drugs.
Key findings include:
- 10.2% of drivers tested positive for drugs (compared to 4.4% for alcoholFootnote 8);
- 7.6% of drivers were positive for cannabis (THC);
- Overall, 12.9% of drivers were positive for alcohol, drugs, or both;
- Drug use was most prevalent among drivers aged 20 to 24 (14.0%) and decreased with increasing age;
- Only 2.1% of drivers aged 16 to 19 tested positive for alcohol; however, 10.4% of this age group tested positive for cannabis;
- Alcohol use was most common on Friday and Saturday nights (4.6% and 6.2%, respectively); and cannabis use did not differ across survey nights, varying between 6.9% and 9.0%.
Compared to data from previous surveys, there has been a significant reduction in the prevalence of alcohol use among drivers, but a significant increase in the prevalence of drug use, cannabis in particular. Similar to other types of prevalence data, roadside surveys show that male drivers are more likely than female drivers (12% and 7.4% respectively) to test positive for drugs.
All these jurisdictions, as well as Quebec, have indicated that they are considering conducting roadside surveys post-legalization.
Law Enforcement-Reported Incidents
Law enforcement officers typically come in contact with impaired drivers through a traffic stop. Officers can also come in contact with impaired drivers when attending to a traffic collision or conduct roadside checks randomly at various times during the year (e.g., Christmas and New Year). In coming into contact with a driver, police officers may do a number of things depending on the circumstances: demand a preliminary breath sample, conduct a standardized field sobriety test (SFST), or collect a sample of oral fluid using ADSE. If the officer has reasonable grounds to believe that the operator of the vehicle has committed an offence, the person can be required to provide a blood sample or submit to a DRE, or imposed an administrative penalty (e.g. fine or license suspension) under the relevant provincial/territorial legislation.
CBSA officers come in contact with impaired drivers through border processing and may arrest a driver when grounds to believe impairment have been met. These grounds can be reached either directly by observing a driver who is displaying the characteristic of impairment or an officer may screen a driver when they have suspicion of a drug or alcohol (or both) in the body, in order to reach the threshold of belief. Once an arrest occurs, the responding police agency of jurisdiction is called to come to the port of entry (POE) to take custody of the driver.
Various data may be collected at each of these stages, but whether and how it is collected varies significantly both between jurisdictions and type of tool used. Data on police-reported incidents is collected systematically and reported annually through Statistics Canada's Uniform Crime Reporting (UCR) Survey. Similarly, data is systematically collected when a DRE or blood analysis are conducted. However, data is not systematically collected when a preliminary breath test or SFST is conducted or when ADSE is used. Data on CBSA enforcement actions at the border is maintained in Agency systems.
In addition to being limited to incidents that come to their attention, police data on DID incidents may under-represent their occurrence for a variety of reasons. In particular, whenever the presence of alcohol is established, officers will typically pursue the alcohol-related charge and will not further investigate for the presence of drugs.Footnote 9 Other factors may explain under-detection and under-reporting such as the number or availability of detection capacity, or the fact that information may be lost since it is mostly manually entered.
UCR data indicates that the proportion of DID incidents reported by police has significantly increased relative to alcohol-impaired driving incidents over time. This is likely due to a combination of factors including a significant increase in law enforcement awareness raising and training on how to detect and investigate DID, while at the same time a number of jurisdictions have been strengthening their administrative sanctions regime (e.g., BC's immediate roadside prohibition policy) and using it more frequently than the criminal law route.
CBSA enforcement data shows a parallel between drug and alcohol impaired driving arrests. In 2020, the Agency made 126 drug impaired arrests, compared to 128 arrests for alcohol impaired; 88% were based on the strength of the SFST. In 2019, there were 285 arrests for alcohol impairment compared to 223 for drug impairment.
Police-reported data for 2020 indicated that in all of Canada, police reported just over 77,600 impaired driving incidents, a decrease of over 8,200 incidents from 2019 (Statistics Canada, 2021). Not surprisingly, British Columbia, Alberta, Ontario and Quebec reported the highest number of incidents. However, the highest rates (i.e., number per 100,000 population) were reported in Prince Edward Island, Yukon, the Northwest Territories and Nunavut, and the lowest in Ontario and Quebec. While the overall volume of impaired driving incidents declined, DID incidents reported by police increased by 15%, to 7,310, from 2019 to 2020. Provincially, Ontario (+686) and Quebec (+336) account for almost the entirety of this increase in DID. The Atlantic provinces reported the highest rates of DID among provinces, Ontario, British Columbia, and Quebec the lowest.
Figure 1 – Trends in annual, police-reported, impaired-driving incidents in Canada (total, alcohol and drugs)Footnote 10

Source: Statistics Canada.
Image description
The graph illustrates that the total number of drug-impaired driving incidents reported by police has significantly increased over time compared to alcohol-impaired driving incidents, which have significantly decreased (with the exception of 2019).
| Year | Type of Offense | ||
|---|---|---|---|
| Impaired Driving (Total) | Operation while Impaired (Alcohol) | Operation while Impaired (Drugs) | |
| 2009 | 88,303 | 81,966 | 1,407 |
| 2010 | 87,231 | 80,958 | 1,679 |
| 2011 | 89,607 | 83,337 | 1,836 |
| 2012 | 84,149 | 77,947 | 1,912 |
| 2013 | 77,558 | 71,720 | 1,937 |
| 2014 | 74,577 | 68,178 | 2,460 |
| 2015 | 71,870 | 64,781 | 2,698 |
| 2016 | 71,304 | 63,968 | 3,073 |
| 2017 | 69,108 | 61,711 | 3,416 |
| 2018 | 70,832 | 62,366 | 4,356 |
| 2019 | 85,804 | 68,823 | 6,285 |
| 2020 | 77,603 | 57,795 | 7,310 |
While still representing 85% of all reported impaired driving incidents, alcohol impaired driving cases have significantly declined since 2009, except in 2019 when they were at their highest level since 2011 (577 per 100,000 population, corresponding to a 19% increase from 2018; Moreau 2021). Conversely, DID incidents reported by police over the same period have increased significantly. In 2009, the first full-year when DID incidents were reported on their own, there were 1,407 such incidents, representing 2% of all impaired driving incidents. Their number had almost doubled to 2,698 by 2015, representing 4% of all impaired driving incidents, and represented 7% of all impaired driving incidents in 2019. In 2019 there were 6,285 incidents of driving while impaired by drugs, an increase of 43% from 2018.
It is also interesting to note that the proportion of impaired driving cases cleared by charge has declined from 89% in 1998 to 71% in 2015, 64% in 2018 and 56% in 2019. Compared with 2009, the rate of alcohol impaired driving incidents cleared by charge fell by 27% and 11% for DID incidents (Perreault, 2021).
As noted by Perreault (2021: 14):
The decrease in the proportion of incidents either cleared by charge or without charge is mainly because of an increase in the proportion of incidents not cleared, which rose from 22% in 2018 to 33% of all police-reported incidents of impaired driving in 2019. Of these uncleared incidents, the vast majority (97%) could not be cleared because of insufficient evidence. Incidents that were still under investigation when the data were submitted to Statistics Canada represented 2% of impaired driving incidents that were not cleared. Changes to the definitions of founded and unfounded criminal incidents may have led to an increase in the number of uncleared incidents, which could, in large part, account for the decrease in the relative proportion of cleared incidents.
In addition, while more than 76% of alcohol-impaired driving incidents are cleared by charge within a day or less, the proportion for DID cases is 59%. Furthermore, 37% of DID incidents took 31 days or more to clear by charge, compared to 17% of alcohol-impaired driving cases.
Coroners' Toxicological Data
Coroners and medical examiners report data from toxicological analyses of different body specimens (e.g., blood, urine, hair, etc.) in fatally injured drivers. However, similar to police investigations, many coroners will not conduct further analyses if alcohol is present and can clearly be established as a probable cause of death. Furthermore, if the cause of death is obvious, many will not conduct toxicological analyses; this decision is, in part, related to the time and costs of conducting such analyses. Furthermore, methods may vary between jurisdictions, making it difficult to compare data.
No new coroners' toxicological data is available at this time. For more information relating to research from the Traffic Injuries Research Foundation in 2017, please refer to the previous Annual National Data Report to Inform Trends and Patterns in Drug-Impaired Driving.
In Nova Scotia, the annual data report for 2019 indicated that the number of total fatal collisions dropped by 54% between 2012 and 2017; however, the proportion of total fatal collisions that were THC positive increased nearly every year. There was a 7% decrease in the proportion of fatal collisions that were THC positive between 2017 and 2018. Another important observation to make from this data is that while there was a spike in total fatal collisions in 2018 (n=53), the percentage of total THC positive fatal collisions (26%) comprises a much greater proportion than seen in other years with high total fatalities. From 2010 to 2013 there was an average of 55 total fatal collisions and the average proportion of THC positive total fatal collisions was 16%.Footnote 11
Figure 2 - Proportion of total fatal collisions by type of toxicology result and number of total fatal collisions in Nova Scotia from 2010 to 2018
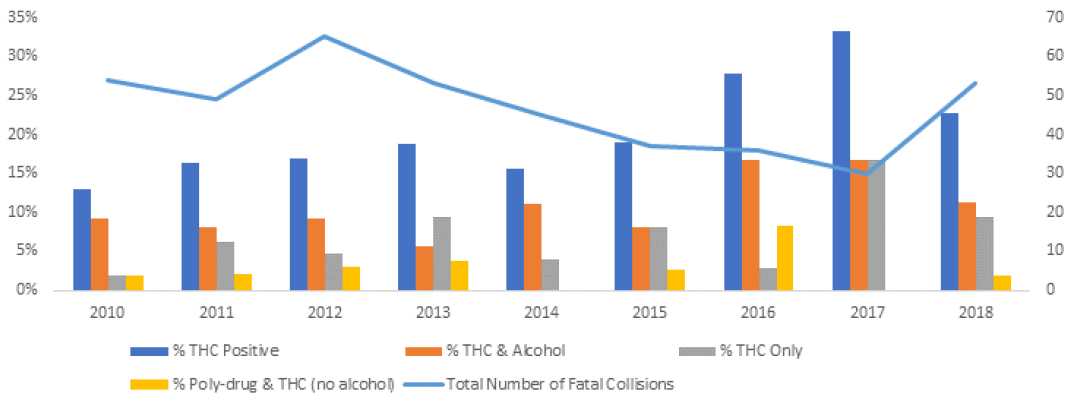
Image description
This graph illustrates that in Nova Scotia, the number of total fatal collisions, dropped by 54% between 2012 and 2017; however, the proportion of total fatal collisions that were THC positive increased nearly every year (with the exception of 2014 and 2018). There was a 7% decrease in the proportion of THC positive fatal collisions between 2017 and 2018.
- Moving from left to right, the bars represent the following:
- Total percentage of fatal collisions where the driver tested positive for THC.
- Percentage of fatal collisions where the driver tested positive for THC and alcohol.
- Percentage of fatal collisions where the driver tested positive for THC only.
- Percentage of fatal collisions where the driver tested positive for poly-drug use and THC (no alcohol).
- The horizontal line represents the total number of fatal collisions, with or without the presence of alcohol/drugs.
What is Being Done to Address Drug-Impaired Driving
Similar to other crimes, DID can be addressed through a gradation of interventions including prevention, detection, and deterrence. Upstream, efforts are made to prevent its very occurrence, in particular through awareness raising and education which can be universal or targeted to specific at-risk groups of the population. Detection will be done through traditional policing methods including road checks and the use of tools such as ADSE and SFST. When impaired driving behaviour is detected, additional investigation may be conducted through requesting a DRE and/or blood samples. If the officer has reasonable grounds to believe that the driver is impaired, criminal charges can be laid and/or administrative sanctions imposed, in order to deter future similar behaviour, either of a specific individual or of the larger community (general deterrence). This section presents activities undertaken by the jurisdictions under these various approaches.
Preventative Interventions
Most jurisdictions have conducted various forms of preventative interventions both before and after cannabis legalization. These interventions included public awareness campaigns on all types of media but mostly on social media channels, as well as targeted education campaigns in high schools, directed at drivers or at cannabis users in cannabis retail stores.
- No general preventative media campaigns or interventions specific to DID were held in 2020 in British Columbia (BC); however, there are plans for a campaign in 2021, pending the approval of funding. For the last 35 years, BC has conducted CounterAttack campaigns, which are intended to communicate that impaired driving laws are tough, impose harsh penalties on impaired drivers and make it likely impaired drivers will be identified and removed from B.C.'s roads. Two campaigns ran in July and December. Based on preliminary data, during the 2020 CounterAttack campaign, 372 impaired driving infractions were issued (Criminal Code and Administrative Sanctions), including 30 violations specific to drug-impaired driving.
- In Alberta, during long weekends and the holiday season when road travel is significantly high, there is a high visibility of police presence on Alberta's highways and a record number of speeding tickets is issued. As part of the annual, nation-wide initiative of the National Impaired Driving Enforcement Day, Alberta RCMP held a checkstops event on Saturday, December 5, 2020 during which they patrolled the provincial highways, ensuring that impaired drivers were apprehended and removed from the roads. Curb the Danger is a police-community collaboration to "curb" impaired driving in Edmonton. This program was launched in October 2006 by the Edmonton Police Service. The program aims to increase community participation in the detection of impaired drivers by asking citizens to call 911 if they suspect a driver is impaired, resulting in 378 arrests in 2020.
- In Saskatchewan, police services, Saskatchewan Government Insurance (SGI), Students Against Drinking and Driving (SADD) and Mothers Against Drinking and Driving (MADD) provide public education and impaired driving awareness campaigns. SGI data shows that online and out of home channels have reached a total of 79M impressions 64K clicks collectively for all the campaigns. As a result, almost all participants reported to have avoided driving impaired during the holiday season. The number of presentations and students reached in 2020 was significantly impacted by COVID-19 restrictions. In 2020, MADD unveiled a new Saskatchewan provincial memorial monument in Saskatoon to honour those who died due to impaired driving in 2019. The Mobile Testing Unit, a van equipped with the tools and technology needed to test drivers for impairment was deployed by the Saskatoon Police Services (SPS) in September 2020. The Mobile Testing Unit makes use of the Dräger Drug Test 5000 that was provided for by the DID initiative through federal funding from Public Safety Canada. Over the span of September to December 2020 the Dräger was used 37 times and resulted in 29 positive cases for drugs. Twenty-nine cases were positive for THC and three of those cases tested positive for cocaine as well.
- Manitoba's Liquor, Gaming & Cannabis Authority has conducted a number of public education campaigns on cannabis. The focus has been primarily on education around cannabis laws, low-risk usage and products. The campaigns have not focused on drug impaired driving.
- With support from law enforcement, private organizations, and academia, public awareness campaigns have been deployed in Ontario to inform the public of the risks of impaired driving prior to and during the time since legalization. These campaigns have taken place through social media posting, presentations in schools, as well as dissemination of resources both traditionally and online.
- In Québec, the Société de l'assurance automobile du Québec has conducted public awareness campaigns to improve road safety and promote safe driving related to drug use and driving since 2013. In 2020, campaigns included: awareness messages on the French and English radio and on Spotify; a poster campaign in public washrooms in restaurants and bars; a short video on the Web and Social Media, including on YouTube; a publication on Facebook; and short articles and videos on Narcity and Urbania. In addition, some law enforcement organizations use social media, including Twitter, to disseminate prevention messages related to driving impaired by drugs or alcohol.
- The New Brunswick (NB) Department of Health reports that it launched the first phase of a public education and awareness campaign regarding cannabis in the spring of 2018, titled “I'm In Control”. Although this campaign does not specifically target drug impaired driving, its objective it to raise awareness of the potential risks associated with legalized recreational-use cannabis and aims to minimize harm. The second phase of the campaign was launched on October 17, 2019 which marked the second wave of cannabis legalization, with the introduction of cannabis edibles. Additionally, The GNB also maintains a web site “Take the Legal Route” (Cannabis in New Brunswick (gnb.ca) ) which provides information links to the GOC website concerning the “Don't Drive High” public education and awareness program.
- In Prince Edward Island, elements of the of the ‘Just the Facts' campaign continue to be used province wide. The ‘Just the Facts' campaign began in 2018 to inform the public of the laws and risks associated with drug impaired driving. The branded campaign included radio, print, website, boosting on social media, specific videos developed for the campaign, integration of messaging on police vehicles, and PEICMC social responsibility products. In the Fall of 2020, PEI launched a public education campaign wherein the Province partnered with first responders like firefighters, Island EMS and Island police forces as well as an Islander who was deeply impacted by impaired driving to develop a public awareness campaign. The awareness campaign urged Islanders to help drive change on impaired driving behaviours. Using social media, radio and print advertising to reach as many homes as possible, the campaign underscored the rippling effect of these dangerous driving behaviors. Participants described impacts of driving impaired on their jobs and some also shared personal stories which recognizing that change requires a collective effort.
- Newfoundland and Labrador continues to run billboards, print, and media campaigns; target audiences vary depending on the platform, but are inclusive of young people, legal cannabis consumers, as well as parents, educators, and outreach personnel. RNC Community Services officers promote drug education and awareness among school‐aged youth and children. The Government of Newfoundland and Labrador continues to maintain the following website to educate members of the public on cannabis related issues: https://www.gov.nl.ca/cannabis/.
- In 2020, the Northwest Territories (NWT) focused interventions on impaired driving in general, running five different campaigns on radio stations, newspapers, and web pages. Posters and paraphernalia warning specifically against cannabis-impaired driving were distributed in NWT communities starting in 2019.
- No general public awareness campaigns took place in Yukon in 2020. However, the Territory has developed plans for prevention and awareness campaigns in 2021/22.
In addition, in most jurisdictions, local and regional law enforcement organizations also conduct targeted awareness and education campaigns at selected periods of the year such as Christmas and the New Year, and highly publicized roadside checks operations, such as the Reduced Impaired Driving Everywhere (R.I.D.E.) operations conducted by the OPP.
Public Safety Canada's campaign, Don't Drive High, continued to raise awareness amongst young Canadians from April 2020 to March 2021, featuring:
- A new animated video, developed for the pandemic context, showing that the decision to not drive high is an easy one to make
- 64 million digital advertising impressions. including 5M on Facebook and Instagram, 25 million on Snapchat, 13.5 million on TikTok, 19.5 million on YouTube, and 1 million on other websites
- 20.7 million completed views of the new video, with a completion rate of 86% on YouTube, far surpassing the Government of Canada benchmark of 15%
- Over 2,000 engagements with the dedicated campaign Facebook and Instagram accounts
- 634,000 visits to the Don't Drive High campaign landing page
Law Enforcement Capacity Building
As previously mentioned, key tools available to law enforcement include using the approved drug screening equipment (ADSE) and the SFST to detect DID, and DRE and blood draws to support the prosecution of DID offences. The federal government's initiative to support the implementation of the new DID legislative regime by law enforcement provides the opportunity for enhanced training in SFST and DRE, increased capacity to procure ADSE, and increased funding for the RCMP laboratory to conduct toxicological analyses.
Standardized Field Sobriety Test (SFST) Training
Originally designed for the detection of alcohol-impaired driving, SFST is an observational test consisting of three key components: Walk and Turn, One Leg Stand, and Horizontal Gaze Nystagmus. While used to detect DID in the USA since 1981, SFST was formally authorized as a screening tool for law enforcement to detect impaired driving in Canada in 2008, and training offered on its use in all provinces and territories. Although research is still ongoing to determine SFST's scientific validity for drugs (Porath & Beirness, 2014), extensive Canadian case law has recognized its use.
SFST training takes different forms. In some jurisdictions, it is only delivered in police colleges (e.g., Quebec), but in most cases it is delivered by a combination of colleges and local law enforcement organizations (e.g., BC, Ontario). In Quebec, training on SFST is mandatory and is part of the initial training program for police officers at the police school. Also, SFST training is available to police officers on duty (course lasting 24 hours).
As part of the federal initiative to support the implementation of the new DID legislative regime, the national target is that 33% (or approximately 21,000) of all frontline law enforcement officers will have been trained in SFST over five years.Footnote 12 The CBSA initiated SFST training in 2018 as part of the DID initiative.
Excluding Quebec which trains 100% of its police officers in SFST,Footnote 13 there were almost 11,700 SFST trained officers overall across the country at the end of 2020, representing almost 21% of all police officers in the country. The distribution across jurisdictions is as follows:
| Province and Territories | # of SFST officers trained in | Average cost per officer | |||
|---|---|---|---|---|---|
| 2018 | 2019 | 2020 | 2019 | 2020 | |
| BC | 329 | 402 | 116 | - | $1,737.61 |
| AB | 356 | 348 | 39 | - | $886.21 |
| SK | 46 | 83 | 22 | $1,709.75 | $1,652.88 |
| MB | 98 | 101 | 37 | - | - |
| ON | 2,083 | 1,584 | 512 | $1,149.71 | $2,110.14 |
| QC | - | - | |||
| NB | 279 | 419 | 11 | $365.00 | |
| NS | 350 | 106 | 18 | $750.00 | |
| PEI | 51 | 2 (or 39 counting cadets) | 0 (or 32 counting cadets) | - | - |
| NL | 45 | 13 | 9 | $131.79 | - |
| YT | 19 | 18 | 2 | - | $3,494.03 |
| NT | 32 | 37 | - | $3,000.00 | - |
| NU | 6 | 7 | - | - | - |
| Canada | 3,694 | 3,120 | 766 | ||
| CBSA | - | 567 | 149 | - | $2,479.00 |
| Province and Territories | Total # of officers trained in SFST as of December 31 | % frontline police officers trained in SFST | ||
|---|---|---|---|---|
| 2019 | 2020 | 2019 | 2020 | |
| BC | 1,445 | 1,560 | 30% | 33% |
| AB | 1,435 | 1,360 | 25% | 24% |
| SK | 251 | 273 | 21% | 23% |
| MB | 455 | 492 | 25% | 28% |
| ON | 5,291 | 6,392 | 35% | 25% |
| QC | 15,884 | 15,622 | 100% | 100% |
| NB | 430 | 430 | 41% | 41% |
| NS | 609 | 627 | 90% | 34% |
| PEI | 108 | 118 | 55% | 61% |
| NL | 244 | 364 | - | 44% |
| YT | 39 | - | 30% | |
| NT | 27 | - | 18% | |
| NU | 12 | - | - | - |
| Canada | 10,280 excl. QC | 11,682 excl. QC | ||
| 26,164 with QC | 27,304 with QC | |||
| CBSA | - | 716 | - | 24% |
The average cost of SFST training varies significantly across jurisdictions from a few hundred dollars to a few thousands. This may depend on such factors as the method of course delivery, geographical location (e.g., need to travel), course duration, class size, etc.
Drug Recognition Expert (DRE) Training and Certification
Drug Recognition Experts (DRE) receive training on how to use the Drug Evaluation Classification (DEC) Program. The DEC is a systematic and standardized 12-step procedure used by trained officers to recognize and evaluate behaviours and physiological indicators associated with the seven different drug categories: central nervous system depressants and stimulants, inhalants, dissociative anesthetics, cannabis, hallucinogens, and narcotic analgesics. The results of the 12-step evaluation, when corroborated by toxicological evidence of drug use, provide sufficient evidence to proceed with DID charges (Porath & Beirness, 2019).
The Canadian Association of Chiefs of Police recognizes the DEC Program as the sole approved training provider for DID for Canadian police and, since 2005, the program has been under the stewardship of the Royal Canadian Mounted Police National Traffic Services. The national DEC program is managed by the RCMP which collects yearly statistics on training, certification, and re-certification of officers across Canada. Data from the RCMP national office indicates that 91 officers were trained in DRE in 2020, following almost 400 in each of 2018 and 2019, bringing the national total of DRE officers to 1,135. This represents 91% of the 5-year target (n=1,250) established by the provinces and territories as part of the funding agreements under the federal initiative. The decrease in officers trained, and in the total number of active DREs, is due in large part to the inability to hold training sessions and recertification sessions in line with new public health measures resulting from the COVID-19 pandemic.
| Provinces and Territories | DREs Trained in 2018 | DREs Trained in 2019 | DREs Trained in 2020 |
|---|---|---|---|
| BC | 55 | 63 | 13 |
| AB | 53 | 76 | 0 |
| SK | 17 | 32 | 0 |
| MB | 9 | 12 | 0 |
| ON | 123 | 127 | 42 |
| QC | 56 | 34 | 21 |
| NB | 23 | 11 | 4 |
| NS | 31 | 15 | 6 |
| PEI | 6 | 1 | 1 |
| NL | 9 | 14 | 3 |
| YT | 0 | 1 | 1 |
| NT | 2 | 1 | 0 |
| NU | 0 | 0 | 0 |
| Canada | 384 | 387 | 91 |
| Provinces and Territories | Active DREs as of January 1, 2020Footnote 14 | Active DREs as of January 1, 2021 |
|---|---|---|
| BC | 186 | 155 |
| AB | 172 | 149 |
| SK | 80 | 74 |
| MB | 43 | 37 |
| ON | 450 | 418 |
| QC | 160 | 151 |
| NB | 51 | 45 |
| NS | 78 | 50 |
| PEI | 12 | 16 |
| NL | 41 | 34 |
| YT | 2 | 4 |
| NT | 4 | 2 |
| NU | 0 | 0 |
| Canada | 1,279 | 1,135 |
Approved Drug Screening Equipment (ADSE)
The Royal Canadian Mounted Police (RCMP) has rolled-out a national master “train-the-trainer” curriculum on the approved drug screeners for police services across the country.
Eleven provinces and territories have purchased and deployed ADSE as follows:
| Provinces and Territories | 2018 | 2019 | 2020 | Total |
|---|---|---|---|---|
| BC | 15 | 15 | 32 | 62 |
| AB | 6 | 0 | 6 | |
| SK | 30 | 0 | 30 | |
| MB | 20 | 0 | 0 | 20 |
| ON | 0 | 155 | 23 | 178 |
| NS | 5 | 0 | 17 | 22Footnote 15 |
| PEI | 5 | 8 | 13 | |
| NL | 21 | 21 | ||
| NT | 2 | 2 | ||
| NU | 1 | 1 | ||
| YK | 6 | 6 |
Law Enforcement Interventions
Collecting data on law enforcement interventions to address DID has been challenging for all jurisdictions for a variety of reasons. When this initiative started in 2017, collecting this data was a new requirement in most instances for law enforcement organizations across the country. As such, there was a need to work closely with provinces and territories to ascertain the feasibility and capacity to collect data on law enforcement interventions in DID cases. Started in late 2018, further to the enactment of cannabis legalization, this work continued well into 2019. Agreement was reached with all jurisdictions in December 2019 on the list of national indicators and data sources. Once agreement was reached on the list of indicators and data sources, jurisdictions needed to develop data collection tools and establish protocols with law enforcement agencies. Given that data collection takes time, and law enforcement priority responsibility is to respond to calls and conduct investigations, discussions with law enforcement agencies on appropriate and efficient ways to collect the required data are ongoing.
Standard Field Sobriety Testing
Historically, data has not been collected by police on the use (e.g., frequency, circumstances such as day of the week or time of day, and results) of SFST. However, some jurisdictions have started testing the implementation of a log of SFST results in 2019. The CBSA does have a process for tracking each time the SFST is administered to a driver.
Data on the frequency of use and results of SFST by law enforcement for 2020 was reported by eight provinces and territories (Alberta, Saskatchewan, Manitoba, Ontario, New Brunswick, Nova Scotia, Newfoundland and Labrador, and the Northwest Territories), with the proportion of positive results ranging from 39% (Saskatchewan) to 100% (Newfoundland and Labrador). The CBSA reported positive results in 53% of their 219 SFST incidents.
However, given that few law enforcement agencies across the country, and certainly not all officers within a given agency systematically collect data on the use of SFST, and that even when collected data may not always be complete or timely, this report does not present any further data on the use of SFST.
Drug Recognition Evaluation
The RCMP National DEC program and the Sûreté du Québec in cooperation with the École nationale de police in Quebec collect DRE data. Certified drug recognition experts complete a drug influence evaluation sheet (known as the facesheet), a narrative report, and the DRE report (the tracking form). The facesheet may contain large amounts of qualitative information, but none is systematically captured in electronic records. Furthermore, the database is still largely paper-based, and likely incomplete as DRE facesheets may only be transmitted to the data collectors once toxicology reports are completed and collected, which can take months.
Overall between 2018 and 2020, there has been a significant increase in the number of DRE evaluations conducted across all jurisdictions. With the exception of the Yukon, every jurisdiction reporting DRE use in 2019 has also reported an increase in 2020. Similarly, there has been a significant increase in the average number of evaluations per DRE officer.
Total Drug Recognition Expert (DRE) Operational Evaluations (annual)
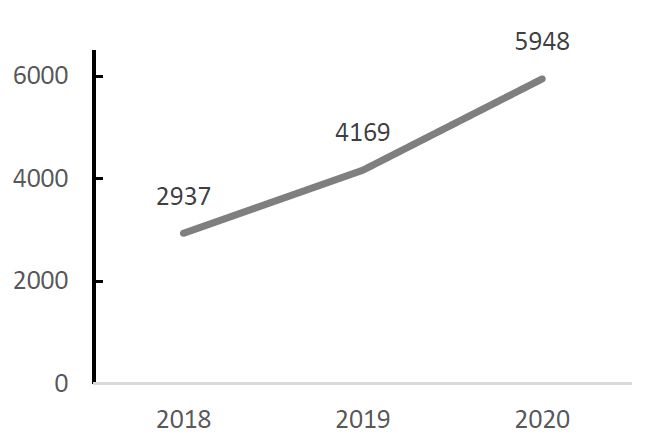
Image description
| Year | Total DRE Operational Evaluations |
|---|---|
| 2018 | 2,937 |
| 2019 | 4,169 |
| 2020 | 5,948 |
Average Number of Evaluations per DRE (annual)
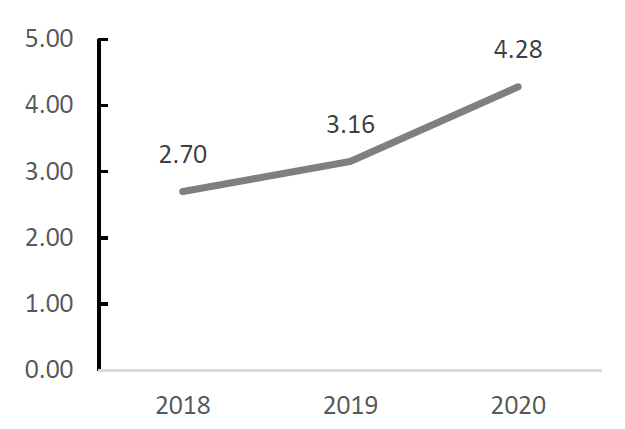
Image description
| Year | Average Evaluations per DRE |
|---|---|
| 2018 | 2.70 |
| 2019 | 3.16 |
| 2020 | 4.28 |
With the exception of inhalants as an opinion category, all other categories saw an increase in 2020; in particular, Cannabis as an opinion category increased by 281 incidents. That said, similar to 2019, cannabis remains in third position, behind stimulants and narcotics analgesics, at almost the same level as depressants.
Figure 3 - DRE Evaluations: Frequency of Opinion Categories, Canada, 2020
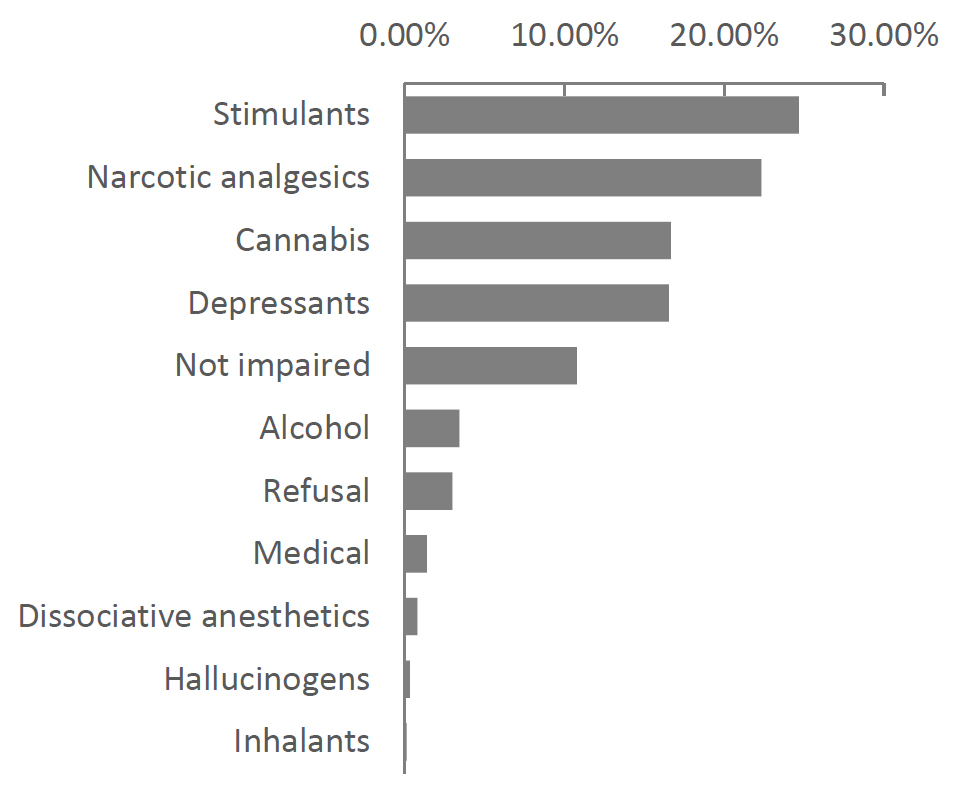
Image description
| Opinion Categories | Frequency (%) |
|---|---|
| Stimulants | 24.68 |
| Narcotic analgesics | 22.33 |
| Cannabis | 16.66 |
| Depressants | 16.54 |
| Not impaired | 10.77 |
| Alcohol | 3.43 |
| Refusal | 2.98 |
| Medical | 1.39 |
| Dissociative anesthetics | 0.79 |
| Hallucinogens | 0.32 |
| Inhalants | 0.11 |
It is important to note that the tables below represent the total number of times the drug category was opined during an evaluation, not the total number of occurrences. Additionally, there can be multiple categories opined per individual occurrence.
| BC | AB | SK | MB | ON | QCFootnote 17 | NB | NS | PEI | NFLD | YK | NWT | NU | Total | |
|---|---|---|---|---|---|---|---|---|---|---|---|---|---|---|
| Depressants | 111 | 76 | 34 | 18 | 100 | NRFootnote 18 | 22 | 32 | 7 | 29 | 0 | 0 | 0 | 429 |
| Stimulants | 247 | 66 | 25 | 9 | 87 | NR | 15 | 15 | 5 | 15 | 0 | 0 | 0 | 484 |
| Hallucinogens | 0 | 0 | 2 | 0 | 4 | NR | 0 | 1 | 0 | 1 | 0 | 0 | 0 | 8 |
| Dissociative Anesthetics | 4 | 1 | 1 | 1 | 4 | NR | 0 | 0 | 0 | 0 | 0 | 0 | 0 | 11 |
| Narcotic Analgesics | 199 | 69 | 32 | 6 | 100 | NR | 28 | 20 | 15 | 13 | 1 | 0 | 0 | 483 |
| Cannabis | 113 | 95 | 28 | 12 | 120 | NR | 22 | 35 | 7 | 18 | 0 | 1 | 0 | 451 |
| Inhalants | 1 | 0 | 0 | 0 | 1 | NR | 0 | 0 | 0 | 0 | 1 | 0 | 0 | 3 |
| Medical | 9 | 1 | 2 | 0 | 6 | NR | 1 | 4 | 1 | 2 | 0 | 0 | 0 | 26 |
| Alcohol | 14 | 8 | 7 | 1 | 15 | NR | 4 | 9 | 0 | 7 | 0 | 0 | 0 | 65 |
| Not Impaired | 25 | 40 | 6 | 6 | 66 | NR | 16 | 16 | 6 | 9 | 1 | 0 | 0 | 191 |
| Refusal | 28 | 36 | 1 | 4 | 8 | NR | 1 | 3 | 0 | 1 | 0 | 0 | 0 | 82 |
| Total | 751 | 392 | 138 | 57 | 511 | - | 109 | 135 | 41 | 95 | 3 | 1 | 0 | 2,333 |
| BC | AB | SK | MB | ON | QC | NB | NS | PEI | NFLD | YK | NWT | NU | Total | |
|---|---|---|---|---|---|---|---|---|---|---|---|---|---|---|
| Depressants | 167 | 84 | 12 | 15 | 222 | 388 | 12 | 24 | 3 | 18 | 0 | 0 | 0 | 945 |
| Stimulants | 329 | 86 | 19 | 7 | 260 | 499 | 13 | 12 | 2 | 10 | 1 | 0 | 0 | 1,238 |
| Hallucinogens | 4 | 0 | 0 | 0 | 1 | 7 | 0 | 0 | 0 | 0 | 0 | 0 | 0 | 12 |
| Dissociative Anesthetics | 6 | 0 | 0 | 0 | 10 | 13 | 1 | 2 | 0 | 0 | 0 | 0 | 0 | 32 |
| Narcotic Analgesics | 279 | 68 | 15 | 1 | 346 | 90 | 21 | 21 | 7 | 17 | 1 | 0 | 0 | 866 |
| Cannabis | 187 | 79 | 17 | 6 | 277 | 299 | 28 | 51 | 8 | 16 | 0 | 0 | 0 | 968 |
| Inhalants | 1 | 1 | 1 | 1 | 3 | 7 | 0 | 0 | 0 | 0 | 1 | 0 | 0 | 15 |
| Medical | 8 | 4 | 3 | NR | 34 | NR | 3 | NR | 1 | 2 | 0 | 0 | 0 | 55 |
| Alcohol | 33 | 7 | 4 | 1 | 27 | NR | 1 | NR | NR | 0 | 0 | 0 | 0 | 73 |
| Not Impaired | 28 | 29 | 9 | 8 | 278 | 227 | 19 | 60 | 7 | 11 | 0 | 1 | 0 | 677 |
| Refusal | 20 | 29 | 3 | NR | 45 | 32 | 5 | 11 | NR | 0 | 0 | 0 | 0 | 145 |
| Total | 1,062 | 387 | 83 | 39 | 1,503 | 1,562 | 103 | 181 | 28 | 74 | 3 | 1 | 0 | 5,026 |
| Poly Category | 356 | 28 | 12 | NR | 433 | 247 | 21 | 23 | 6 | 17 | 1 | 0 | 0 | 1,144 |
| BC | AB | SK | MB | ON | QC | NB | NS | PEI | NFLD | YK | NWT | NU | Total | |
|---|---|---|---|---|---|---|---|---|---|---|---|---|---|---|
| Depressants | 219 | 55 | 39 | 9 | 371 | 441 | 27 | 33 | 6 | 40 | - | 0 | 0 | 1,240 |
| Stimulants | 541 | 85 | 52 | 11 | 474 | 591 | 41 | 18 | 15 | 22 | - | 0 | 0 | 1,850 |
| Hallucinogens | 0 | 1 | 0 | 1 | 9 | 13 | 0 | 0 | 0 | 0 | - | 0 | 0 | 24 |
| Dissociative Anesthetics | 7 | 1 | 0 | 0 | 22 | 27 | 1 | 1 | 0 | 0 | - | 0 | 0 | 59 |
| Narcotic Analgesics | 497 | 108 | 38 | 9 | 829 | 86 | 35 | 34 | 11 | 27 | - | 0 | 0 | 1,674 |
| Cannabis | 205 | 74 | 61 | 11 | 445 | 356 | 32 | 24 | 13 | 28 | - | 0 | 0 | 1,249 |
| Inhalants | 1 | 0 | 0 | 0 | 6 | 1 | 0 | 0 | 0 | 0 | - | 0 | 0 | 8 |
| Medical | 21 | 5 | 2 | NR | 49 | 21 | 5 | 0 | 1 | 0 | - | 0 | 0 | 104 |
| Alcohol | 21 | 20 | 15 | 0 | 30 | 157 | 5 | 9 | 0 | 0 | - | 0 | 0 | 257 |
| Not Impaired | 56 | 52 | 33 | 6 | 380 | 217 | 30 | 11 | 9 | 13 | - | 0 | 0 | 807 |
| Refusal | NR | 37 | 0 | NR | 106 | 65 | 6 | 4 | 0 | 5 | - | 0 | 0 | 223 |
| Total | - | 0 | 0 | 7,495 | ||||||||||
| Poly Category | 541 | 26 | 31 | 9 | 865 | 334 | 42 | 32 | 15 | 33 | NR | 0 | 0 | 1,928 |
Approved Drug Screening Equipment
As mentioned earlier, eleven jurisdictions have procured ADSE since their approval, but not all have actually used them. Data on the use of ADSE by law enforcement for 2020 was reported by seven provinces (Alberta, Saskatchewan, Manitoba, Ontario, Nova Scotia, Newfoundland and Labrador, and the Northwest Territories) with only five reporting on the results. In jurisdictions that reported results, the proportion of positive results (i.e., an impairing drug detected above authorized levels) ranged from 77% to 100%.
In Saskatchewan, an ADSE was used 37 times between September to December 2020, resulting in 29 positive results for drugs. Twenty-nine cases were positive for THC and three of those cases tested positive for cocaine as well.
The Newfoundland and Labrador experience with the use of ADSE is also interesting. According to jurisdictional reports from the Royal Newfoundland Constabulary and the RCMP, ADSE were used in less than 3% of DID interactions in 2020, yielding positive results for cannabis (THC) in 100% of cases (5).
While based on limited data, indications are that ADSE achieve a high success rate when used.
Blood Analyses
Data on the number of times blood samples were demanded in cases involving suspected DID was provided by the RCMP where it delivers provincial or municipal police services (all but Ontario and Quebec). Data for 2020 may be lower due to the fact that toxicology laboratories were focusing their resources on the COVID-19 pandemic. Additionally, it is important to note that we can only report on the data received from the lab and cannot account for data that may be missing.
Table 9 displays the total number of blood analysis by type of analysis requested. It does not display the number of toxicological results received, and for many of these cases the toxicological analysis result reports are outstanding.
| Alcohol and Drug Analysis Requested | Drug Only Analysis Requested | Total | ||||
|---|---|---|---|---|---|---|
| 2019 | 2020 | 2019 | 2020 | 2019 | 2020 | |
| BC | 48 | 47 | 63 | 60 | 111 | 107 |
| AB | 56 | 55 | 122 | 122 | 178 | 177 |
| SK | 33 | 19 | 28 | 24 | 61 | 43 |
| MB | 23 | 27 | 56 | 33 | 79 | 60 |
| NB | 17 | 18 | 8 | 8 | 25 | 26 |
| NS | 8 | 9 | 51 | 11 | 59 | 20 |
| PE | 5 | 3 | 18 | 19 | 23 | 22 |
| NL | 6 | 8 | 9 | 12 | 15 | 20 |
| YT | 1 | 1 | 0 | 0 | 1 | 1 |
| NU | 1 | 0 | 0 | 0 | 1 | 0 |
| NT | 0 | 0 | 0 | 1 | 0 | 1 |
| Total | 198 | 187 | 355 | 290 | 553 | 477 |
*11 cases were removed as the type of analysis requested was not specified.
Of the cases that were submitted for a blood analysis request, the below table displays the frequency of the per se drugs that were found in the blood analysis. In the cases where the blood analysis was found to be negative for drugs, it's possible that those cases were alcohol and drug analyses, and could have been positive for alcohol.
| 2019 | 2020 | |||
|---|---|---|---|---|
| n | % | n | % | |
| THC | 140 | 44.7% | 49 | 38.3% |
| Methamphetamine | 89 | 28.4% | 49 | 38.3% |
| Cocaine | 29 | 9.3% | 14 | 10.9% |
| Negative - No drugs found | 25 | 8.0% | 8 | 6.3% |
| GHBFootnote 22 | 14 | 4.5% | 5 | 3.9% |
| THC Metabolite | 11 | 3.5% | 0 | 0.0% |
| Ketamine | 4 | 1.3% | 2 | 1.6% |
| LSD | 1 | 0.3% | 1 | 0.8% |
| Total | 313 | 100% | 128 | 100% |
Of the cases where THC was found in the blood analysis, the table below displays the prevalence of each blood drug concentration delineated between the hybrid and summary offence categories. The results in the table are not specific to ADSE usage and are only displaying the frequency of each category of THC concentration. There can be multiple per se drugs found per incident.
| 2019 | 2020 | |||
|---|---|---|---|---|
| n | % | n | % | |
| ≥ 5 ng/mL | 72 | 51.4% | 27 | 55.1% |
| ≥ 2 ng/mL and < 5 ng/mL | 44 | 31.4% | 12 | 24.5% |
| < 2 ng/mL | 24 | 17.1% | 10 | 20.4% |
| Total | 140 | 100.0% | 49 | 100% |
The table below displays the frequency of drug categories found in the blood analysis results. The table only includes frequencies of drugs that are outside of those included in the per se limit offences. For example, since cocaine is a per se limit drug, but it is also a stimulant, it has been excluded from the below table since it would be accounted for in Table 8. There can be multiple per se limit drugs and drug categories per incident.
| 2019 | 2020 | |||
|---|---|---|---|---|
| n | % | n | % | |
| Stimulants | 86 | 41.7% | 5 | 55.6% |
| Depressants | 46 | 22.3% | 3 | 33.3% |
| Narcotic Analgesic | 34 | 16.5% | 1 | 11.1% |
| Alcohol | 35 | 17.0% | 0 | 0.0% |
| Hallucinogens | 2 | 1.0% | 0 | 0.0% |
| Dissociative Anesthetics | 2 | 1.0% | 0 | 0.0% |
| Inhalants | 1 | 0.5% | 0 | 0.0% |
| Total | 206 | 100.0% | 9 | 100.0% |
Results
ChargesFootnote 26
Statistics Canada's 2021 Juristat article on Impaired Driving (Perreault, 2021) indicates that the rate of all impaired driving incidents cleared by charge is generally declining: it was almost 90% in 1989, about 71% in 2015, 63% in 2018, and 56% in 2019. An even smaller proportion of DID incidents are cleared by charge: 57% in 2018 and 49% in 2019. This may be due in part to increased use of administrative sanctions in alcohol-impaired driving cases as opposed to criminal charges, as well as the challenges associated with investigating and prosecuting a DID offence, as previously discussed.
Given that the legislation was only adopted in the later part of 2018 and that bringing charges to prosecution is a timely process, data presented below from provincial and territorial annual reports for 2020 may not reflect the full extent of the DID charges. The DID charges being analysed in this section include: 320.14(1)(a), (c), (d), and 320.14(4). Furthermore, and most importantly, P/T data on 320.14(1)(a) includes cases of alcohol impaired driving, which obviously skews the findings. Data provided by jurisdictions is as follows:
- In BC , 2,746 incidents were cleared by charge or cleared by charge recommended under 320.14(1)(a), (c), (d), or 320.14(4) in 2020. Of those, 478 were specific to drug impaired driving or drug and alcohol impaired driving in combination. 139 instances where administrative measures were taken.
- In Alberta, 974 charges were laid under 320.14(1)(a), (c), (d), or 320.14(4) in 2020.
- In Saskatchewan, 2,881 charges were laid under 320.14(1)(a), (c), (d), or 320.14(4) in 2020 and 456 instances where administrative measures were taken.
- In Manitoba, 76 charges were laid under 320.14(1)(a), (c), (d), or 320.14(4) in 2020.
- In Ontario 3,933 charges were laid under 320.14(1)(a), (c), (d), or 320.14(4) in 2020.
- In New Brunswick, 95 total charges were laid under 320.14(1)(a), (c), (d), or 320.14(4), 69 of which were laid by the RCMP, in 2020. There were also 105 instances when administrative measures were taken.
- In Nova Scotia, 1,577 charges were laid under 320.14(1)(a), (c), (d), or 320.14(4) in 2020.
- In PEI, 316 charges were laid under 320.14(1)(a), (c), (d), or 320.14(4) in 2020. There were 299 instances where administrative driving prohibitions were imposed (including alcohol).
- Newfoundland & Labrador did not report laying any charges under 320.14(1)(a), (c), (d), or 320.14(4) in 2020.
- In Yukon there were 51 charges were laid (and concluded – sentenced/withdrawn) under 320.14(1)(a), (c), (d) or 320.14(4) in 2020.
- In NWT, there was only one charge laid under 320.14(1)(a), (c), (d), or 320.14(4) in 2020; however, there were 1141 instances when administrative measures were taken.
Youth Charged with Impaired Driving
A research team conducted a study commissioned by the CCSA to examine the impacts of cannabis legalization on youth, vulnerable youth in particular.Footnote 27 One of the elements examined was drug-impaired driving.
Based on data from Statistics Canada, the authors examined charges related to driving while impaired on drugs. Pre-legalization charges included operation of a vehicle while impaired on drugs. Post-legalization charges included: 1) operation of a vehicle while impaired on drugs; 2) operation of a vehicle while impaired on drugs and alcohol; and 3) operation of a vehicle while impaired (unspecified).
The data presented below compare rates for youth 12-17 and 18-24 to rates for older groups of the population in order to determine whether they evolved differently over time.
The data indicate that driving while impaired charges (note that this includes all drugs, not just cannabis, as well as the combination of alcohol and drugs), in Canada, increased significantly after cannabis legalization. In 2015, only 2,549 impaired charges were issued. By 2019, this figure had risen to 11,958 charges, an increase of 369%.
| Age Group | Year | Percent Change 2015-2019 | |||
|---|---|---|---|---|---|
| 2015 | 2016 | 2017 | 2019 | ||
| 12-17 yrs | 54 | 54 | 58 | 127 | 135.20% |
| 18-24 yrs | 572 | 680 | 695 | 2,052 | 258.70% |
| 25-34 yrs | 806 | 937 | 1,061 | 3,781 | 369.10% |
| 35+ yrs | 1,117 | 1,210 | 1,289 | 5,998 | 437.00% |
| Total | 2,549 | 2,881 | 3,103 | 11,958 | 369.10% |
All provinces and territories, with the exception of the Yukon and Nunavut, experienced a significant post-legalization rise in impaired-driving charges. However, the magnitude of this increase varied dramatically by region and age group. Three provinces (Newfoundland and Labrador, New Brunswick and Manitoba) experienced increases of less than 100%. Five regions (Prince Edward Island, Quebec, Saskatchewan, British Columbia and the Northwest Territories) experienced increases of between 100% and 200%. Two provinces (Nova Scotia and Alberta) experienced increases in impaired charges between 200% and 500%. Ontario experienced – by far -- the greatest post-legalization increase in impaired driving charges: from only 439 cases in 2015 to 6,334 cases in 2019 ). This represents a 1,185% increase in driving while impaired (on drugs) charges over this five-year period.
Youth 12-17 years represent a small minority of those charged with driving while impaired offences (less than 3% across the study period). While they also experienced a significant increase in impaired-driving charges following cannabis legalization, the increase was far less than for older adults. In 2015, prior to cannabis legalization, only 54 impaired driving charges were laid against young offenders. This figure rises to only 127 charges in 2019 – a 135% increase. In comparison, the rate increased by 258% for young people aged 18-24.
Only seven of the thirteen provinces and territories – PEI, Nova Scotia, Quebec, Ontario, Manitoba, Alberta, and the Northwest Territories -- experienced a post-legalization increase in youth impaired driving charges. All other regions remained stable or experienced a post-legalization decline. Post-legalization, the Northwest Territories has the highest youth impaired driving charge rate (59.1 per 100,000). Prince Edward Island, Nova Scotia, Quebec, and Alberta also have a post-legalization youth charge rate above the national average (5.2 per 100,000). The charge rates for all other provinces and territories fall below the national average
Convictions
Over the period examined in Statistics Canada's 2019 Juristat on impaired driving (2010/11 to 2018/19) (Perreault, 2021) DID cases (64%) were less likely to result in a guilty finding (whether by plea or decision) than alcohol-impaired driving incidents (82%). However, the proportion of DID cases resulting in a guilty finding has risen over the same period of time from 64% in 2010/11 to 70% in 2018/19.
Given the length of time required to process DID charges in court (estimated at 115 days in 2018-2019; Perreault, 2021:22), few jurisdictions presented data on convictions for DID cases in their annual report, and it was incomplete in most cases. One of the factors contributing the “low conviction rate” is the amount of time it takes to complete an investigation (including getting toxicology results) and then having the case go to first appearance date, plea date and then a trial date. Except in cases where a guilty plea is entered, it is very rare for a case to be completely adjudicated in the same year that the offence occurred. That does not mean that the conviction rate is as low as what is portrayed, as the majority of cases will be adjudicated in the following year and perhaps the majority will result in a finding of guilt.
It should also be noted that convictions under 320.14(a) include a number of cases (likely the majority) where alcohol was also involved.
Data presented by jurisdictions for 2020 is as follows:
- In BC, there were 264 convictions under section 320.14(a), (c), or (d) in 2020, with a 30% conviction rate.
- In Alberta, there were 150 convictions under section 320.14(a), (c), or (d) in 2020, with a 15% conviction rate.
- In Saskatchewan, there were 480 convictions under section 320.14(a), (c), or (d) in 2020, with a 17% conviction rate.
- In Ontario, there were 2,348 convictions under section 320.14(a), (c) or (d) in 2020.Footnote 29
- In New Brunswick, there were 3 convictions under section 320.14(a), (c), or (d) in 2020, with a 3.2% conviction rate.
- In Nova Scotia, there were 177 convictions under section 320.14(a), (c), or (d) in 2020.
- In the Yukon there were 9 convictions under section 320.14(1)(a), (c), or (d) in 2020. (6 of these convictions were charges laid in previous years). While 51 charges were laid under section 320.14(1),(a), (c), or (d) in 2020 only 3 of those files resulted in a conviction. There were 47 charges under section 320.14(1)(a), (c) or (d) that were withdrawn and 1 file that was dealt with by other means.
- In the Northwest Territories, there was 1 conviction under section 320.14(a), (c), or (d) in 2020, with a 100% conviction rate.
- In PEI, there were 38 convictions under section 320.14(a), (c) or (d) in 2020.
Penalties and Sentences
The Juristat on impaired driving (Perreault, 2021:21) indicates that over the 9-year period from 2010 to 2019, the sentences most often imposed for impaired driving were fines and driving prohibitions, with the amount of fines for DID cases being slightly lower than for alcohol-impaired driving cases on average.
The following jurisdictions provided data on sentences and administrative sanctions imposed under either the criminal or administrative regime:
- In BC, 2% of convictions resulted in a prison sentence, while 33% resulted in fines, and 58% a combination of sentences. 100% of instances where administrative sanctions were imposed resulted in a combination of measures (drivers license suspension, vehicle impoundment, and/or fine).
- In Alberta, 51 convictions resulted in a prison sentence, 76 with a fine, with probation also imposed in 22 of these cases. Drivers license suspension was the most frequent administrative sanction (735 instances).
- In Saskatchewan, fines (87% of cases) were by far the most common sentence imposed. The most common administrative sanctions were drivers license suspension (2,984), vehicle impoundment (1,251) and mandated education (1,754).
- In Ontario, custody was the most serious sentence imposed in 7% of convictions, compared to 74% of convictions where the most serious sentence was a fine.Footnote 30 In addition, there were 20,522 administrative sanctions imposed on drivers relating to drug-impaired driving in 2020. The province provided the following detailed table:
| Suspension Type | 2018 | 2019 | 2020 |
|---|---|---|---|
90-day ADLS |
12,612 | 13,473 | 12,365 |
Warn Range |
7,257 | 6,683 | 4,925 |
SFST-based |
165 | 140 | 112 |
Novice Zero-BAC |
438 | 529 | 552 |
Under 22 Zero BAC |
107 | 139 | 109 |
DRE-based |
862 | 1,230 | 2,216 |
Novice Zero Drug |
6 | 63 | 104 |
Novice Under 22 Zero Drug |
6 | 15 | 16 |
Zero BAC Commercial |
44 | 110 | 103 |
Zero Drug Commercial |
4 | 11 | 20 |
| Total | 21,501 | 22,393 | 20,522 |
- In New Brunswick, the most common penalties and sentences are fines and driving prohibitions.
- In Nova Scotia, fines were also the most common sentence imposed, (155 instances), and there were 145 administrative sanctions on drivers (mostly license suspension).
- In PEI, a combination of custody, fines and driving prohibitions were imposed in close to 90% of impaired driving sentences in 2020.
- In Yukon 68% (134 convictions) of all impaired driving offences concluded in 2020 resulted in a conviction. A combination of a fine and driving prohibition accounted for 59% of all sentences, with the remaining sentences being custodial (28%) and other (conditional/suspended) 13%.
Analysis and Conclusions
In most jurisdictions across Canada, all data sources (population surveys, roadside surveys, police-reported incidents, as well as coroners' toxicological analyses) tend to indicate an ongoing trend over the past 10-12 years of DID incidents increasing as a proportion of all impaired-driving incidents, with cannabis being one the most frequently detected class of drug among drivers.
On one hand, there are some preoccupying indicators. Cannabis users, especially daily or almost daily users, are more likely to think that cannabis use does not impair driving. In addition, despite increased public awareness campaigns and new and enhanced tools for police to enforce DID laws, only 25% of Canadians believe that it is very likely that they will get caught if they drive under the influence of cannabis. And while police-reported data tends to indicate a significant decline in overall trends in impaired driving incidents over the past ten years, the proportion of DID incidents reported by police has significantly increased from about 2% of the total in 2009, to approximately 9% in 2020. It is possible that the increase in the proportion of police-reported DID incidents may be related more to enhanced awareness, and the increase in training and new detection and investigation capacities among law enforcement personnel, than to trends in the actual behaviour of driving after drug and cannabis use. Future year data on trends and patterns in self-reported and detected behaviour may help determine if there is indeed an increase in actual drug-driving behaviour.
On the other hand, survey data tends to indicate that public education and awareness campaigns conducted nationally by Public Safety Canada and in provinces and territories appear to have effectively changed Canadians' perceptions around driving after cannabis use, with an increasing number of respondents agreeing that cannabis use impairs driving abilities. Furthermore, the proportion of Canadians reporting driving after cannabis use has continued to decline in 2020.
Whether the current levels of law enforcement capacity to effectively detect and deter DID are sufficient cannot be determined. Nevertheless, despite the COVID-19 pandemic halting progress in 2020, there has been a significant increase in law enforcement capacity building through enhanced training in SFST, DRE and the use of ADSE. There is well over 26,000 officers trained in SFST. While limited data is collected on the use of SFST by law enforcement, it appears to be increasing. Eleven of thirteen jurisdictions have now procured ADSEs and their use appears to be increasing. It can be expected that use will increase as law enforcement becomes more familiar with these tools. Data indicates that there were 1,389 active DREs at any point in time in 2020, compared to 1,321 in 2019. Furthermore, data on use of DRE shows that it has continued to increase in 2020 at a rate faster than the increase in the number of trained officers: use of DRE has doubled since 2018, while the number of certified DRE officers has increased by approximately 51% between 2018 and 2020. Officers conducted 5,948 DRE evaluations in 2020, an increase from 4,169 in 2019. The proportion of DRE category opinions is variable but tends to be higher for “drugs” in general than for cannabis specifically.
Furthermore, available data indicates that these tools are highly reliable: when a DRE and/or blood sample are requested further to a failed SFST, there tends to be a high level of correlation (i.e., a failed SFST tends to be confirmed by a DRE and/or blood analysis).
Given that processing time for DID cases by police and courts tends to be significantly longer than in cases of alcohol-impaired driving, data on charges and their results remains preliminary. There is a long-standing and continuing trend where charges are laid more frequently and lead to higher levels of convictions for alcohol than for DID cases. There also appears to be a trend where administrative penalties under provincial/territorial legislation may be used more often than proceeding with criminal charges. However, future year data and additional analyses will be required to validate these early trends.
Finally, work is continuing at the FPT table and with key stakeholders such as the Canadian Association of Chiefs of Police to continue improving the completeness and accuracy of available data.
References
- Brubacher, J.R., et. al. (2019) Cannabis use as a risk factor for causing motor vehicle crashes: a prospective study
- Conseil canadien des administrateurs en transport motorisé (2019) A Compilation of Jurisdictional Roadside Surveys Conducted prior to Cannabis Legalization. (anglais seulement) Ottawa.
- Compton, R. (2017) Marijuana-impaired driving: A report to Congress. Washington, National Highway Traffic Safety Administration.
- Owusu-Bempah, A., Wortley, S. and Schlapak, R., (2021) What's changed? Cannabis Legalization and Youth Contact with the Justice System. Ottawa: Canadian Centre on Substance Use and Addictions.
- Moreau, G. (2021) Police-Reported Crime Statistics in Canada, 2020. Statistics Canada
- Perreault, S. (2021) Impaired Driving in Canada, 2019. Statistics Canada.
- Perreault, S. (2016) Impaired Driving in Canada. Statistics Canada, Statistics Canada.
- Porath-Waller, A.J. et D.J. Beirness (2014) An examination of the validity of the Standardized Field Sobriety Test in detecting drug impairment using data from the Drug Evaluation and Classification Program. Traffic Injury Prevention, 15, 125-131.
- Porath, A.J. et D.J. Beirness (2019) Predicting categories of drugs used by suspected drug-impaired drivers using the Drug Evaluation and Classification Program Tests. Traffic Injury Prevention.
- Robertson, R.D. et coll. (2017) Prevalence and Trends of Drugged Driving in Canada. Accident Analysis and Prevention. Vol.99, partie A.
- Date modified: