A Better Estimation of Police Costs by Offence Types

Table of contents
- Introduction
- Method
- Results
- Waterloo Regional Police Services Costs of Crime
- Costs of Crime versus Indirect and Non-Crime Related Activities
- Costs of UCR Crimes Against Person and Crimes Against Property
- Costs of Victimization in Waterloo
- Cost per UCR Offence Type for WRPS
- Ontario Provincial Police Costs of Crime
- Costs of Crime versus Indirect and Non-Crime Related Activities
- Costs of UCR Crimes Against Person and Crimes Against Property
- Costs of Victimization in Ontario
- Cost per UCR Offence Type for OPP
- Sensitivity Analysis
- Waterloo Regional Police Services Costs of Crime
- Discussion
- References
- Appendix A: Waterloo 2012 and 2013 Offences Used for GSS Categories of Victimization
- Appendix B: Average Cost of Offence Type per Incident in Waterloo 2012
- Appendix C: Average Cost of Offence Type per Incident in Waterloo 2013
- Appendix D: OPP List of Duty Categories and Total Costs
- Appendix E: OPP Offences Used for UCR Categories of Crime
- Appendix F: OPP Offences Used for GSS Categories of Victimization
- Appendix G: Assumptions Made When Linking OPP Duty Codes to UCR Codes
- Appendix H: OPP Cost per UCR Offence for 2009 to 2013
Abstract
The economics of policing and cost of crime remain important issues in Canada, yet much of it is done at an aggregated, macro-level, disallowing more granular estimates. The aim of the current project is to provide a better estimate by examining police data at a micro-level to allow for a more accurate assessment on policing costs by offence type. This report assesses policing costs through collaboration with two different Canadian police services (Waterloo Regional Police Service and Ontario Provincial Police).The tangible costs of policing by offence type are calculated using hours and salaries per incident. These results are compared, when possible, to the costs of non-criminal police activities. Analysis of Waterloo Regional Police Service data reveals the proportion for cost of crime is 52.49% and 54.5% of total cost for reactionary and preventative policing in 2012 and 2013 respectively. Primary costs for calls for service in Waterloo are attributable to reactive and preventative police activities. Ontario Provincial Police data shows little variation in crime expenditures. OPP crime related costs were higher than non-criminal activity expenditures, showing an average cost of crime per year of 75.95% for 2009 to 2012. Factoring in patrol costs in 2013 reduced the average cost of crime related costs to 45%. Comparisons between UCR categories and victimization categories for interpersonal and property crimes indicate estimate outcomes changes depending on the chosen metric. The findings suggest standardized definitions to ensure comparable metrics are used across studies and that more detailed, accurate analyses can provide more informative outcomes.
Author's Note
The views expressed are those of the authors and do not necessarily reflect those of Public Safety Canada, the Ontario Provincial Police, or the Waterloo Regional Police Service. Correspondence concerning this report should be addressed to: Research Division, Public Safety Canada, 340 Laurier Avenue West, Ottawa, Ontario, K1A 0P8; email: PS.CPBResearch-RechercheSPC.SP@ps-sp.gc.ca.
Acknowledgements
This project would not have been possible without the contributions of the Ontario Provincial Police and the Waterloo Regional Police Services. The author is grateful for the assistance of the participating police agencies. The report is a result of the efforts of many people who deserve credit. My sincere thanks to Ting Zhang for her input and earlier work on the project as well as Jobina Li. Special thanks goes to Austin Lawrence for his invaluable comments when reviewing the report, to Anton Maslov for his assistance, and to Marnie Wallace for her insight.
Introduction
The purpose of this study is to begin to develop a more accurate and effective estimate of police costs by offence type. This has been achieved through collaboration with multiple police services to use available data to develop a better framework for estimating crime-specific policing costs in Canada.
The objective of the study is to answer the following questions:
What is the percentage of expenditures in a police service that are generally spent on activities related to responding to crime (such as responding to calls for service and specialty investigative units) compared to other costs (such as crime prevention, responding to public emergencies, non-criminal code calls, traffic, etc.)?
For a police service, what are the average costs per criminal incident by offence type?
Background
Determining costs-of-service trends is a critical concern for law enforcement agencies. It continues to be a constant challenge in Canadian society to balance the rising cost of police services while law enforcement agencies struggle with budget cuts. Statistics Canada (2013) reports that the national level and severity of crime reported to police decreased from 118.8 to 77.6Footnote 1 between 1998 and 2011, however, the per capita cost of policing rose from $206 to $375 using the current dollar value (Burczycka, 2013: 29; Potter, 2013; Ruddell & Jones, 2013; Statistics Canada, 2012). The percent of the change in policing expenditures in Canada varied greatly between 1998 and 2011. Represented as percentage of change in policing expenditures from previous year, the range of change in cost varied from 2.2% in 2011 to 8.6% in 2008 (Statistics Canada, 2012). Therefore the amount that policing expenditures increases from year to year in Canada changes widely. The annual expenditures of police services nationally totalled $12.9 billion in 2011 alone (Kiedrowski, Petrunik, Macdonald, & Melchers, 2013). While police costs have increased over time, Ruddell and Jones (2013: 26) notes that it is important to remember that cost for all government agencies also increased in all government levels (municipal, provincial, and federal) showing an increase of 43% in total expenditures between 1998 and 2009. Nevertheless, despite overall increases in government expenditures, Ruddell and Jones (2013) argue that policing cost increases significantly exceed other government agencies in Canada. A recent report (ICURS, 2014) offers a different image of rises in police cost, stating that expenditures in education have risen comparably alongside police costs and health expenditures have exceeded police and education in rising costs. The fact remains that police costs have risen a great deal. To better understand increasing police expenditures, it is important to understand to what these rising costs can be potentially attributed.
Canada's increase in police costs is not due to an increase in police officers per capita. In fact, the change observed over the past few years is a decrease in officers per capita. For example, in 1982 there were 2.01 officers for every 1,000 residents in Canada, whereas in 2012 the rate was 1.99 (Burczycka, 2013: 29). In 2013, it is reported that the number of police officers have decreased by 1.5% in Canada and it is the third consecutive decrease observed in the past three years (Hutchins, 2013). Other factors may have an influence on the increase in policing costs (Public Safety Canada, 2012):
- expanded obligations imposed by government and courts requiring more time and effort expended per case by police services (e.g., increased reporting requirements after R. v. Stinchcombe [1991] 3 S.C.R. 326 create greater time and cost recording, reporting and transcribing by police services);
- increased workload demands on police officers, often due to higher volumes of calls for service that do not result in criminal charges, which have resulted in a rise in overtime expenditures and occupational costs;
- increased training requirements for police officers to adapt to quickly changing crime and technological trends, and to meet evolving legal and accountability standards;
- a lack of clarity or set of agreed upon metrics to ascertain if policing resources are being allocated efficiently or effectively; this results in inconsistent costing models and thus inconsistent costing results across studies creating inexact information for resource and funding allocation.
Demands on Police Service
The increased demands on police service, such as increases in administrative demands due to court decisions (Malm, et al., 2005) and a rise in incidents involving people with mental illness and mental health issues can also raise other costs. These other costs include health benefits, pensions, and personnel costs and the legal costs associated with them (Malm, et al., 2005; Standing Committee on Public Safety and National Security, 2014). In an analysis by Fred Kaustinen, Executive Director of the Ontario Association of Police Services Boards, it is determined that Ontario police expenditures have seen a steep rise since 1999, demonstrating an exponential increase above and beyond those attributable to inflation, population increases, or increase in officers (Kaustinen, 2013). For example, while inflation in Canada increased by 19% between 2001 and 2008, police budgets rose by 42%. A main reason for this increase, according to Kaustinen, is due to arbitration labour awards and collective agreements that 'leap-frog' instead of reflecting a more conservative increase in labour budgets that would better reflect those outside of police services.
A 30-year study conducted in British Columbia found that greater demands on police have emerged from court decisions which have substantially enlarged police service workloads by requiring more time to be spent on administrative tasks such as transcribing all phone conversations related to an investigation or to the more careful management of evidence. Recent research on these expanded responsibilities indicate that time spent on administrative tasks and report writing make up 40% of the daily workload of officers and that time spent on reports and administrative duties is more than the time taken to respond to calls for service and investigations combined (Malm, et al., 2005: 9). Some of the more critical and recent court decisions that have a significant impact on increasing police service demands (2005: 10-15) include:
- In R. v. Duarte [1990] 1 S.C.R. 30, the decision by the Supreme Court resulted in new legislative requirements being established in order to use one party consent for conversations as evidence in court and the creation of new provisions in the Criminal Code for “tracking warrants” (s. 492.1) and dialed “number recorder warrants” (s. 492.2). This has created much larger demands on police resources and time by increasing the number of affidavits requiring judicial approval and the detail included in them.
- R. v. Stinchcombe (1991) is considered to be a case that has had potentially the greatest demand on police time and some consider the decision to have had “a debilitating effect on police resources” (Malm et al., 2005: 13). The ruling in this case set the precedent that the accused has the right to any and all evidence from the police investigation and the Crown's case, even if not relied upon. The bulk of the responsibility for full disclosure of evidence has fallen on police services as the duty for full disclosure has created a massive demand on police resources to create transcripts for any and all evidence which includes (Malm et al., 2005: 14):
- all audio and video tapes;
- notebook entries from all officers;
- reports;
- all source debriefings;
- all tips (and outcomes of tips);
- all connected cases;
- all affiant material;
- all wiretap information;
- all operational plans;
- all surveillance notes;
- medical records;
- all analyses of phone records or other documents;
- undercover operation information;
- information relating investigative techniques considered whether used or not;
- investigative team minutes of meetings or debriefings, etc.; and
- any and all communication intercepts, whether relevant or not.
- The R. v. B. (K.G.), [1993] 1 S.C.R. 740 ruling by the Supreme Court created a mechanism to allow previously inadmissible evidence that would have fallen under hearsay. The result is that statements that previously only required a handwritten report, now require an oath and video-recording. Keeping in mind R. v. Stinchcombe, this means that not only is there increased time to gain and take a video-recorded statement, it also requires a transcription of the video-recording. Malm et al. (2005) estimated that the transcription time for one hour of audio equates to three hours of transcription time, not including the time it takes for the police investigator to validate the accuracy of the transcribed statement word by word (2005: 14).
The 30-year study of police service and performance in British Columbia also indicates that police demands for service increased exponentially due to these expanded responsibilities, and also due to a rise in calls for service. Calls for service have elevated in volume to a point that it exceeds police additions in personnel (Malm et al., 2005). In other words, any additions to police personnel does not meet the higher increase in calls for service, making it more challenging for those calls to be met efficiently. In their analysis, they found that the time from initial call for service to court showed immense increases in time required by police. For example between 1983 and 2003, the amount of time to clear a break and enter charge increased in time required by 58%, the time required to respond to a driving under the influence charge rose by 250%, while the time required for domestic assault cases increased by 964% (2005: 2). Furthermore, calls for service comprise a much larger proportion of non-crime activities such as responding to sick or mentally ill, marginalized persons, public maintenance, and more. The extra time can result in overtime expenditures that exceed budgetary capacity and are in part due to the ever expanding responsibilities required of police services. Other reasons for overtime costs may be due to staff shortages, court attendance, lengthy investigations, and greater expectations by communities for police to maintain public order or attend special events, deal with marginalized persons, etc. (ICURS, 2014).
The House of Commons (2014) has recently recommended that analyses are needed to examine cost drivers that include the excessive administrative burdens faced by police services to determine their effect on costs of policing. Furthermore, factors affecting the rise in calls to service need to be examined. For example, one of the reasons for the increase in call volume is not an increase in crime related costs, but rather an increase in police response to incidents involving people who have a mental illness or have a mental disorder (CCA, 2014). Also proactive or preventative measures such as RIDE programs and person or vehicle checks as well as time patrolling are usually not included in crime cost estimates as they are not directly related to crime. Other demands of this nature include community expectations such as community demands for increased police visibility and the presence of officers in schools, the changing roles of police (e.g., community mobilization/community development), and the lack of other service providers (e.g., the lack of by-law officers so police may need to respond to minor by-law issues, lack of sufficient hospital staff and rooms leading to greater demands for police to respond to individuals with health issues).Footnote 2 The role of police has been evolving “as part of the wider programme addressing public safety, community needs, and the needs of marginalized persons.” (ICURS, 2014: 2). Yet all of these activities contribute to total expenditures on policing. The increasing complexity on police service demands, such as rises in incidents involving people with mental illness or mental disorders and increasing operational demands due to court case precedents, significantly add to police costs.Training Costs
Another aspect not usually considered in police costing estimates is the cost of technological advancements and training needs. A police cost analysis by Public Safety (Huggins, 2013) identify that 70% of urban police expenditures are due to salaries and wages, with benefits such as insurance and health compensation making up 17%, while training makes up part of the remaining 13% 'other' expenditures for many urban police services. All police services in Canada require training with regulations mandating follow-up training and testing, as well as other mandatory courses and requirements throughout an officer's career (Pannell, 2013). For example, the Ontario Ministry of Community Safety and Correctional Services has legislated mandatory training and re-certification for police services which requires officers to train and re-certify within specified time periods such as firearm requalification which is required every 12 months. Mandatory training is also necessary for specialized areas such as sexual assault instigations. Additionally, police must contend with continuing advancements in technology and the need for updated training. New and ever evolving technologies assist in improving dispatch and communication systems, crime analysis, case management, prosecution and overall court support, as well as police service administration and management (Malm et al., 2005: 8). For each new technology introduced to provide better service, there is a demand for training and re-training to keep up-to-date with technological advancements. For example, we have a growing number of police officers that carry Conduct Energy Weapons (CEW) which necessitates an increased training demand. Police services that have adopted the use of Body Worn Video (BWV) also require necessary training. Also technology and training is required to address cyberbullying and other various Internet offences, as well as the globalization of crime that police must know how to monitor, investigate, and address. With the ever growing demands created by advancements in technology, it is important that police agencies can adapt and be able to deliver services as effectively as possible for the sake of public safety. Although police leaders recognize that training is necessary to prepare officers to meet all existing needs, including new legislative and police circumstances, training budgets are often the first to receive cut-backs (CACP, 2008). Pannell (2013) outlines the 'hidden' costs associated with inadequate training that result in loss of public trust:
- reduces the quality of police investigations;
- increase in court case losses;
- increase in public complaints;
- increase in professional standards investigations;
- increase in negative media stories; and
- increase in inquests, inquiries, and judicial reviews.
Efforts to reduce training costs through advancements such as eLearning have been introduced (Huggins, 2013), but determining the full and accurate cost of policing training requires better accounting and proper metrics to ascertain detailed and informative cost estimates. Achieving a better estimate remains a challenge for most police agencies.
Overview of Previous Police Costing Research in Canada and Metric Challenges
Several attempts over the years have created estimates of policing and costs of crime to better inform policy development, program and operational planning of governments, funding, and law enforcement agencies. Despite these efforts, several outstanding issues remain when attempting to determine an accurate estimate of the cost of crime in Canada. Although data on costs of crime and the criminal justice system are available in Canada, they are aggregated primarily at the level of a police agency or provincial jurisdiction, which cannot be categorized into activity- or crime-specific information. For instance, for policing, the only official national cost information is the total annual policing expenditures in Canada collected through the Police Administration Survey conducted annually by the Canadian Centre for Justice Statistics at Statistics Canada. Micro-level information is required to undertake efficiency, planning and cost-benefit studies of various approaches to criminal justice and policing interventions.
In an attempt to fill this information gap, the Research and Statistics Division at the Department of Justice (RSD) conducted multiple costing studies to estimate the criminal justice system costs for individual offences. However, the accuracy of these estimates is significantly limited by the availability and the quality of the data. High quality estimates of this kind require very specific data at a granular level which is difficult to obtain. For example, in an earlier cost of crime report by RDS (Zhang, 2008), the primary cost of policing appears to be based on the Police Administration Survey (PAS). Limitations of the data for the estimate of police costs include missing information as drug and traffic offences had gaps in data. Also, only the crime-prevention expenditures are available for analysis. Having only partial costs creates an underestimate of total police expenditures due to the exclusion of being able to analyse the full range of expenses involved in police costs. Missing data and lack of all activities associated with policing create inaccurate and underestimated total expenditures.
A more in-depth example of data limitations that have been encountered by previous policing costs efforts is seen in a comprehensive estimate on the cost of spousal violence (Zhang, Hoddenbagh, McDonald, & Scrim, 2012). The authors recognize a number of data limitations when calculating the cost of policing by incident. First, gaps in information created omissions and/or underestimations of costs. An example would be the exclusion of non-criminal police activities when estimating expenditures or the absence of all criminal (i.e., only having a select number/types of incidents included) when analyzing police expenditures, or missing information on civilian police service costs. Without more comprehensive data, one cannot conduct an accurate analysis on police expenditures. Second, a number of assumptions tend to be adopted to conduct analyses. For example, in the spousal violence report (Zhang, et al., 2012), assumptions were required when estimating the prevalence of children who develop hyperactivity as a result of being exposed to spousal violence as the specific data would be difficult if not impossible to acquire (2012:18). Third, when calculating police expenditures, the Uniform Crime Reporting (UCR2) is relied on, yet there are limitations with the UCR2. It relies on the assumption that all police forces collect and code their UCR2 data the same way, which is not the case. This creates a reliability question with the data as each police jurisdiction is aggregating their data in different ways due to having alternate service delivery options from police service to police service. This creates comparison challenges, rendering data difficult to compare across jurisdictions, let alone to create an accurate estimation of policing costs at a national level. In addition, the UCR2 only captures a portion of all crimes because only the most serious violation gets recorded during an incident, yet one incident can involve more than one offence. Also the UCR2 does not include all crimes as it excludes by-law offences and most cybercrimes with a few exceptions such as child luring and child pornography. Due to only the most serious violation being recorded and the UCR2 not encompassing all criminal offences, it is an underrepresentation of the actual total of all UCR2 offences that have occurred (ICURS, 2014).
For the 2012 spousal violence cost report, police expenditures are calculated based on a per-incident cost for each Criminal Code offence related to spousal violence using the Crime Severity Index (CSI). The CSI is determined by sentence lengths for the offence. Police costs in the RSD report are calculated by multiplying the severity weight to each offence by the number of incidents of each offence and then deriving a weighted proportion based on the total severities divided by the summation of all total severities (2012: 25). The final step is to calculate overall police expenditures by multiplying each offence’s “weighted proportion” of severity by the total police budget which is adjusted to 65% of the total budget. This percentage is based on the assumption that police time spent on criminal activity is 65%. Using the above method, it is determined by RSD that the police costs for spousal violence in Canada in 2009 was 145.6 million dollars (Zhang, et al., 2012: 25).
Another data limitation is a lack of accuracy in estimating the percent of police budget spent on responding to crime-related activities. After a few correspondences with Ottawa Police Service, for estimation purposes it is subjectively assumed that about 65% of police time is spent on responding to criminal activity. While these figures seem to be consistent with estimates used in costing studies for other countries, such as Walby (2004) using 61% for the UK and Rollings (2008) using 70% for Australia, information obtained from one municipal police force might not be adequate to reflect the differences among other police services or to represent a national average. Detailed enough data has not yet been available to create more reliable estimates of the amount of police time spent on dealing with criminal activity versus other activities or to estimate the average policing cost of responding to individual criminal incidents.
The focus on crime misses an important aspect of law enforcement: proactive policing. The time taken patrolling and police stops for vehicle or person checks such as RIDE programs serve as preventative measures to increase public safety. Meanwhile community awareness and youth programs are instances when the police work proactively with the public. Furthermore, an increase in incidents involving people with mental illnesses or disorders has created greater demands on police services (CCA, 2014). These are only some of the types of police activities that go unaccounted for in economic estimates when determining police costs. Yet these activities make up an important part of police services and must be taken into account when evaluating a costing model.
Another aspect that needs to be taken into consideration in efforts to provide a better estimate on police costs is to determine police costs per crime incident. This can be achieved by providing a less aggregated costing result to better inform police and government agencies about police expenditures. An estimate that can allow for more granular analysis can offer more in-depth information regarding policing resources as it pertains to costs and demand for service. In order to calculate the policing costs per crime, this figure needs to first be adjusted to account for the police activities that are not related to combating, responding to, or investigating criminal activities such as traffic regulations (non-criminal), providing youth education seminars, coordinating community public safety efforts, and responding to phone calls. Including non-criminal costs, such as pro-active policing, is critical to establish a more accurate estimation of policing costs (Rout, 1979).
In order to differentiate policing resources allocated to different crimes, Justice Canada used a method of weighted average where the Crime Severity Index (CSI) severity weights are applied to adjust the estimate (Zhang et al., 2012). Severity weights, developed by the CCJS in consultation with the Canadian criminal justice community, are measures of the relative severity of offences based on the typical sentences given to offenders that are convicted of those offences. For example, 1st degree murder has a severity weight of 7,042, while level 1 assault’s severity weight is 23. In the absence of better data, the assumption being made in the Justice Canada methodology is that the relationship between the severity of different criminal incidents will be similar to the relationship between the amount of police resources required to respond to the criminal incidents. However, it must be noted that severity weights do not necessarily give an accurate representation of relative police resource use across crimes as they are based on sentences given in court, not on studies of policing effort. For the purposes of the calculations, it has been assumed, in previous studies of the cost of crime, that severity weights correlate to the seriousness and the complexity of different crimes, and hence, capture the differences in police resource use in terms of investigation and any other crime-related processes. Although imperfect, this method is an advancement of using a simple average calculated by dividing the number of criminal incidents by police expenditures, which treats each crime as if police resources were equally required to address them.
Furthermore, it has been argued by Ruddell and Jones (2013) that current research focuses on urban policing and should include rural areas and take into account Aboriginal communities and related policing costs unique to those areas. The varying size and geographical locations of police services, particularly those in rural areas, may have different or limited resources compared to larger urban law enforcement agencies. Also, policing in Aboriginal communities have specific needs and considerations. The exclusion of these factors in current research impacts the accuracy when estimating policing costs and thereby limits our understanding of what trends or factors influence the rise or decrease in said costs in Canada. However, urban services and Aboriginal policing communities may not have the resources to devote to capturing and calculating sophisticated metrics to analyze police expenditures.
Another, and crucial, consideration when conducting studies of policing costs is the metric used. A review of police performance metrics indicates that not all police agencies use similar metrics or frameworks, and some agencies such as rural areas, may not use any metrics at all when measuring police performance and expenditures (Kiedrowski et al., 2013). Gabor (2014) conducted a synthesis of existing literature on costs of crime and related costs of criminal justice system per offence type and demonstrated how studies have used differing costing methods. Findings indicate that the choice of costing method in turn impacted the estimate in question (Gabor, 2014:16). Such variations suggest that a consistent framework for costing is needed that would include the factors missing from previous data and costing research, and address data issues by providing a more granular level analysis, including proactive police activities, and analyzing cost of policing by offence type. Data that includes these considerations are necessary to form a better estimate that could be used to provide consistency and better accuracy in costing research efforts. Such efforts would better inform governing bodies on how and where to better allocate funding for police services and create more efficient models for policing agencies.
With all these challenges, it is apparent that data limitations are a major obstacle for the credibility of cost of crime estimates and a barrier to further studying the expenditure of police resources on various types of criminal justice interventions. In April 2013, Justice Canada and Public Safety made a cooperative presentation at the Police Information and Statistics Committee (POLIS), which covered multiple topics – policing spending, cost drivers, performance measures, and possible research ideas. At that meeting, the current project is endorsed by the members of the committee. Improving the quality of per-incident cost estimates is not only important in understating the costs of individual crimes, but also essential in policing performance management aiming to better manage service delivery costs and to generate improved public safety outcomes.
Method
Participants
Two POLIS member police services (Waterloo Police Regional Service and Ontario Provincial Police) have agreed to collaborate with Justice Canada and Public Safety in carrying out this research. Detailed data on time keeping, average salaries, and other expenditure tracking data provided by these police services have been used to develop an improved estimate of the costs of crime compared to indirect- and non-crime expenditures.
Data
In order to determine the costs of policing, tangible costs from police agencies were the focus for the current study. Specifically, data used to calculate the police costs per crime incident includes all police activities when possible. When available, data includes police activities that are not related to combating, responding to, or investigating criminal activities such as non-crime proactive activities like RIDE programs, providing youth education, responding to phone calls, patrolling, traffic regulations, and so on, and non-crime reactive policing such as responding to calls for service for sick/injured persons, compassionate to locate, etc. The data includes officer and civilianFootnote3 related costs which are broken down into amount of hours and salary per each individual offence type when provided. By obtaining tangible costs in this manner, the current study provides improved estimated proportions of the cost of crime versus non-crime expenditures. Cost of crime in this analysis involves costs directly associated to when a criminal violation has occurred.
The Waterloo Regional Police Service (WRPS) data contains calls for service per incident for 2012 and 2013. The data contains front line response (i.e., patrol time on task) referred to as reactive and preventative/proactive policing and not Investigative/Administrative Support time on task or Equipment/Infrastructure costs. The time chosen for the current analysis is Total Unit Service Time which is defined as the total time of any and all units dispatched using and recorded by the Computer Aided Dispatch system (CAD) that is attached to that occurrence. All direct crime response related police activities have been linked to UCR codes prior to the current analyses. The data includes number of incidents but did not include cost (i.e., salary). To calculate the cost of calls for service, the salary for Stage 3 Constables is assigned as it is assumed that the majority of police officers on patrol have served more than 12 months (i.e., Stage 3). Stage 3 is the lowest salary assigned to Constables serving over 12 months. Constables were chosen over Sergeants for the analyses in order to obtain the most conservative estimate since the majority of patrols are Constables and the number of Sergeants per unit per incident is unknown. Also, since a large number of units consist of two officers in Waterloo, two officers (Constables) were assigned per incident. It should be noted that the number of officers per incident is unknown, meaning there could be seven officers for a call for service or only one. Two officers per incident have been chosen for the calculation to create as conservative yet realistic average estimate as possible for salary. Furthermore, null and negative values have been found in the initial data for unit service time. In discussions with WRPS, it has been ascertained that at times calls are cancelled resulting in a null value for unit service time. Also the CAD can infrequently provide misinformation regarding service time, resulting in negative values. Since these negative values result in less than 3% of the data, the assumption taken is that they are attributable to computer error and are deleted from the data sample. For the purposes of the current analysis, null values and negative values in Total Unit Service Time have been deleted from the data set in order to conduct the necessary calculations for costs of crime (when a UCR violation has occurred) and indirect and non-crime related activity and obtain the most accurate costing estimate.
The Ontario Provincial Police data set includes police crime type and proactive/preventative activities such as RIDE programs, as well as non-criminal activities including administrative, statute, and operational activities for 2009, 2010, 2011, 2012, and 2013. The data includes the total time per aggregated offence type and covers the time from the offence being opened to the close of the case, thus comprising investigative policing costs. Total costs in police salaries per activity for that year are provided. Frequency of UCR incidents per year wre provided and have been linked manually by the author from their OPP duty codes to calculate cost per offence. In addition, a cost of crime versus indirect and non-crime analysis that includes investigative time aggregated in the total time/cost per type of offence have been calculated.
Procedure
The basic tangible costs per offence type (UCR codes) from each of the two police services are reported separately. In addition, a mean cost for the police services is calculated and reported. When possible, the mean cost for overall offence types (i.e., violent crimes, property crimes, etc., based on UCR codes) is calculated for comparison purposes. In the case of the OPP, OPP service codes were not linked to UCR codes by the police service and therefore have been linked manually by the author for the purposes of the pilot project.
Two main issues exist when examining this type of data from law enforcement agencies. First, multiple crimes often take place during the same incident, making distinguishing costs between offences difficult. For example, a case of homicide can also involve assault with a weapon, break and entering, robbery, etc. To mitigate this issue, individual case studies of different offence types are used, when available, to verify and adjust cost estimates per offence type. These case studies are used to help provide a better estimate of police costs because investigative and civilian support resources are not always captured by calls for service or Police Records Management Systems (RMS). Therefore these individual case studies provide a more realistic reference for the cost per offence types for the offence that case study represents for that particular police agency. When possible, case studies have been integrated into the overall policing cost for that law enforcement agency. Second, the method that police services use to record their data and code offence types does not always align with offence definitions used by UCR, making alignment of costs across different police services by offence difficult. Steps have been taken to mitigate this issue by requesting definitions for offence codes from participating police services and verifying if they did, or could, map their data (i.e., as it pertains to offence types) to UCR offence codes.
Results
Waterloo Regional Police Services Costs of Crime
The following are the results of the analyses of the WRPS data on costs of crime for 2012 and 2013. First are the top 10 frequencies of calls for service, followed by costs of crime versus indirect and non-crime related activity comparisons, UCR definitions of personal versus property crime comparisons, and lastly, comparisons of the cost of personal versus property victimization in Waterloo for 2012 and 2013.
Costs of Crime versus Indirect and Non-Crime Related Activities
In Table 1.1 it can be seen that the most frequent occurrence types for calls for service in Waterloo in 2012 are non-crime related activities captured by the CAD. The majority of most frequent calls for service in 2012 are non-crime reactive policing such as compassionate to locate, and proactive/preventative policing activities such as the STEP program and vehicle stops. Only three criminal activities make the list, which is Domestic Dispute, Theft Under $5000, and Motor Vehicle Collision – Property Damage. It should be noted that not every call of a crime related nature results in a charge being laid. The most frequent calls indicate that the majority of calls for service in Waterloo are indirect or non-crime policing activities.
| Description of Occurrence Type | Number of Calls |
|---|---|
| Bylaw Complaint | 9,283 |
| Compassionate to Locate | 6,582 |
| Domestic Dispute | 5,568 |
| MVC - Property Damage | 5,216 |
| Theft Under $5000 | 4,589 |
| Unwanted Person | 3,862 |
| Alarm | 3,829 |
| Administrative/Routine Detail | 3,564 |
| Driving Complaint | 3,494 |
| Injured/Sick Person | 3,473 |
Note. Adapted from: http://www.atyourservice2012.ca/Demand_on_Service.html for 2012 html
In Table 1.2 it can be seen that the most frequent occurrence types for calls for service in Waterloo in 2013 are non-crime reactive (e.g., compassionate to locate) policing activities as well. As with 2012, in 2013 the only crime related calls to make the list is Domestic Dispute, Theft Under $5000, and MVC resulting in property damage. This affirms the indication that the most frequent calls for service in Waterloo are not directly crime related. The two tables refer only to frequency though, and not cost.
| Description of Occurrence Type | Number of Calls |
|---|---|
| Bylaw Complaint | 8,769 |
| Compassionate to Locate | 6,905 |
| Domestic Dispute | 5,805 |
| MVC - Property Damage | 5,097 |
| Theft Under $5000 | 4,968 |
| Alarm | 4,058 |
| Unwanted Person | 3,973 |
| Driving Complaint | 3,760 |
| Administrative/Routine Detail | 3,500 |
| Injured/Sick Person | 3,334 |
Note. Adapted from: http://www.atyourservice2013.ca/service.html
To further investigate the most frequent occurrence types, highest costs have also been analyzed. Table 1.3 and 1.4 show the results for the top 10 occurrences for calls to service by cost for 2012 and 2013 respectively. The types of occurrences are based on final call type. As can be seen, both years show similar top 10 costs for calls for service with the preventative/proactive vehicle stops and STEP program alternating top spot in costs for 2012 and 2013 respectively. Only two of the top 10 are potentially directly crime related, recalling that such calls do not necessarily result in charges being laid. Specifically Domestic Dispute is the second highest in cost for calls for service in Waterloo in 2012 and the third most costly and time consuming for Waterloo police. Theft Under $5000 is the seventh highest in time and cost for Waterloo calls for service in 2012 and 2013. The most frequent and majority of most costly calls for service are reactive non-crime duties such as Compassionate to Locate and proactive duties such as STEP and vehicle stops. The results affirm the above findings that the greatest cost in calls for service police activities are primarily indirect and non-crime reactive and preventative policing activities.
| Type of Occurrence | Sum of Total Unit Service Time in Hours |
Sum of Total Cost Per Call: Total Unit Time in Hours/Hourly Wage |
|---|---|---|
| 9830 – Vehicle Stop | 19680.73 | $1,348,327.04 |
| 9330 – Domestic Dispute | 17509.46 | $1,119,573.10 |
| 9750 – Paid Duty | 16447.83 | $1,126,840.80 |
| 9540 – Selective Traffic Enforcement Program (STEP) | 13888.31 | $951,488.10 |
| 9840 – Proactive Initiative/Project | 11246.04 | $770,466.28 |
| 9800 – Administrative/Routine Detail | 9602.09 | $657,839.34 |
| 9790 – Theft Under $5000 | 9565.10 | $655,304.85 |
| 9500 – MVC Prop. Damage | 7244.95 | $496,357.24 |
| 9280 – Compassionate to Locate | 7147.43 | $489,670.49 |
| 9490 - Arresta | 7039.47 | $482,274.07 |
| Grand Total | 119371.41 | $8,178,135.30 |
Note. aArrest refers to calls for service where someone, such as a foot patrol officer made an arrest and called for service (e.g., an officer initiated calls for service).
| Type of Occurrence | Sum of Total Unit Service Time in Hours |
Sum of Total Cost Per Call: Total Unit Time in Hours/Hourly Wage |
|---|---|---|
| 9540 – Selective Traffic Enforcement Program (STEP) | 22212.45 | $1,521,775.18 |
| 9830 – Vehicle Stop | 20668.13 | $1,415,973.36 |
| 9330 – Domestic Dispute | 20298.10 | $1,390,623.00 |
| 9840 – Proactive Initiative/Project | 17551.11 | $1,202,426.30 |
| 9750 – Paid Duty | 16310.61 | $1,117,440.20 |
| 9800 – Administrative/Routine Detail | 12225.99 | $837,602.48 |
| 9790 – Theft Under $5000 | 11010.43 | $754,324.22 |
| 9500 – MVC Prop. Damage | 9033.92 | $618,913.63 |
| 9280 – Compassionate to Locate | 8327.33 | $570,505.26 |
| 9490 - Arresta | 7873.47 | $539,411.52 |
| Grand Total | 145511.53 | $9,968,995.15 |
Note. aArrest refers to calls for service where someone, such as a foot patrol officer, made an arrest and called for service (e.g., an officer initiated calls for service).
The total cost for crime for calls for service in Waterloo in 2012 is $8,898,644.64. The total cost for all calls for service in Waterloo in 2012 totals $16,954,811.33, a difference of $8,056,166.70. The cost of crime makes up 52.5% of all costs for calls for service in Waterloo in 2012 and 54.5% in 2013.
Costs of UCR Crimes Against Person and Crimes Against Property
Table 1.5 displays the results for the different UCR crime types. As can be seen, the highest salary cost for calls for service in Waterloo in 2012 is attributable to UCR Crimes Against Property at $2.45 million. Crimes Against Person comes a close second in cost at $2.33 million. Other Criminal Code Violations are the third most costly calls for service in Waterloo in 2012 at $1.93 million. The least costly is Other Federal Statute Violations at $163.3 thousand. Recall that these totals represent only those calls captured by CAD and do not include investigative policing time. Therefore the results only provide a small portion of the cost of police workload related to crime.
| UCR Crime Category | Total Cost |
|---|---|
| Crimes Against Property | $2,451,039.36 |
| Crimes Against Person | $2,334,039.46 |
| Other Criminal Code Violations | $1,926,181.47 |
| Traffic Violations | $1,779,958.52 |
| Drugs and Substances Violations | $643,791.27 |
| Other Provincial Statute Violations | $189,610.10 |
| Other Federal Statute Violations | $163,343.84 |
Table 1.6 displays the results for the different UCR crime types for Waterloo in 2013. As can be seen, the highest salary cost for calls for service is attributable to UCR Crimes Against Property at $2.68 million. Crimes Against Person comes second in cost at $1.98 million. Other Criminal Code Violations are the third most costly calls for service in Waterloo in 2013 at $1.72 thousand. The least costly is Other Federal Statute Violations at $136.8 thousand. The rank is similar to 2012 in highest to lowest cost except for Traffic and Drug violations which switch positions in 2013 compared to 2012.
| UCR Crime Category | Total Cost |
|---|---|
| Crimes Against Property | $2,680,768.67 |
| Crimes Against Person | $1,977,214.85 |
| Other Criminal Code Violations | $1,716,828.00 |
| Drugs and Substances Violations | $1,219,367.22 |
| Traffic Violations | $1,181,646.80 |
| Other Provincial Statute Violations | $160,030.00 |
| Other Federal Statute Violations | $136,804.88 |
Costs of Victimization in Waterloo
As a comparative metric, definitions of victimization have been derived from the General Social Survey (GSS) on Victimization in Canada (Perreault & Brennan, 2010) in order to calculate and compare police costs of victimization seen in Figure 1. Appendix A contains a list of all crimes used for each of the two victimization categories: violent victimization and non-violent victimization for each year (2012 and 2013). In 2012, violent victimization is higher in reactive policing costs in Waterloo at $1.96 million compared to non-violent victimization that same year, which costs $1.40 million. This is notably different than the UCR person and crime categories for Waterloo which showed a consistent higher cost for property crimes than interpersonal crimes. Also the costing estimates of policing for the two categories are lower than the UCR ones for the same year. Similar to UCR person versus property crime cost comparisons, the GSS violent (person) versus non-violent (property) victimization costs are close to each other, but very different from the UCR costs in 2013. Violent victimization costs for calls to service in Waterloo in 2013 was $1.77 million while non-violent victimization costs were nearly as much, but slightly lower at $1.56 million. While the costs are similar for UCR personal compared to property crimes in 2013, the 2013 GSS victimization difference in costs between the two categories is $209.9 thousand while the difference between the two UCR categories is approximately $10.9 million. The change in costs indicates that differences in definitions for type of crime/offence category can alter the outcome of the metric used for policing cost estimates.
Figure 1. Comparisons between GSS categories of violent and non-violent victimization offences for calls for service in Waterloo in 2012 and 2013.
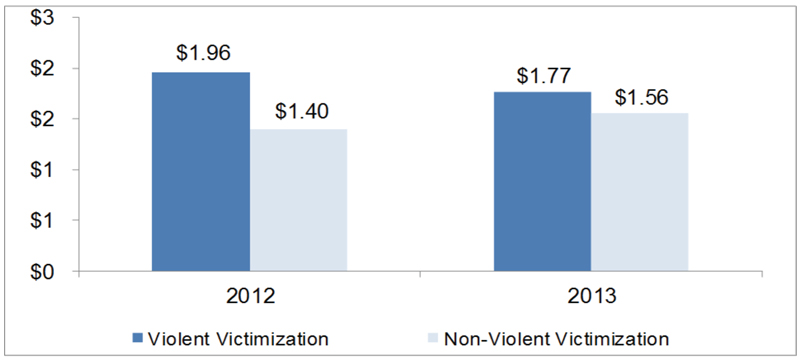
Image Description
Figure 1, a bar chart, illustrates the differences between violent and non-violent victimization as categorized by the General Social Survey (GSS).
Starting from the left hand side, the first column in the graph indicates that the cost for violent victimization in the year 2012 was at $1.96 million for reactive policing for Waterloo police. The second bar, which is lower than the first bar, shows that the cost for non-violent victimization for reactive policing in Waterloo for the same year was less, at $1.40 million in cost. The third and fourth bars are representative of these costs for Waterloo police for the year 2013. Again, the cost was higher for violent victimization for reactive policing in Waterloo, showing an expenditure of $1.77 million. For the same year, non-violent victimization costs were lower for Waterloo, shown by a lower bar illustrating a cost of $1.56 million
Cost per UCR Offence Type for WRPS
An examination of cost per offence type has been conducted by dividing the total cost per offence type by the frequency of that offence to create the average cost per type of offence for calls for service. The cost is for reactive policing only and reflects cost in police salaries. As previously stated, the results reported represent only those calls captured by CAD and do not include investigative policing time and thus Tables 1.7 and 1.8 provide only a preliminary and small portion of the police workload related to crime, rather than an actual total of all crime costs for reactive policing for WRPS.
The results in Table 1.7 and 1.8 for 2012 and 2013 respectively show that the average cost of crime vary very little overall. For example, Crimes Against Property remains the lowest average cost per offence across both years. Crimes Against Person, Traffic violations, and Other Provincial Statute violations have nearly identical averages for their categories for both years. Although OCC violations and Other Federal Statue violations vary slightly between the two years, it is only the Drugs and Substance violations UCR category that shows a notable change. In 2012, the average drug offence for calls for service in Waterloo is $355.88 and nearly doubles in 2013 at an average cost per offence of $637.08. Where the numbers fluctuate the most between years is in the ranges of cost per offence type. Crimes Against Person has the highest top range at $20,772.08 for calls for service in Waterloo in 2012. This cost was associated with calls for service that resulted in a manslaughter charge. The second highest was 1st degree homicide at just over $17 thousand. The lowest cost per offence for Crimes Against Person is $9.46 for an incest offence. In 2013, the offence with the highest cost is Drug and Substances for a Cocaine Production offence at $4797.87. The lowest cost for an offence for calls for service in 2013 is Drug and Substances Violations has a highest cost per offence for Cocaine Production at $4797.87. A full list of all totals for offence type as well as their average cost per incident for calls for service in Waterloo in 2012 can be seen in Appendix B and a full list for 2013 can be seen in Appendix B. These costs reflect reactive and preventative policing (i.e., calls for service), not investigative costs.
| UCR Crime Category | Average | Range in CND$ |
|---|---|---|
| Crimes Against Person | 475.62 | 9.46 - 20,772.08 |
| Crimes Against Property | 134.55 | 35.53 - 1,332.16 |
| Other Criminal Code Violations | 506.49 | 44.05 - 3,559.51 |
| Drugs and Substances Violations | 355.88 | 56.75 - 4,211.73 |
| Traffic Violations | 285.43 | 1.18 - 3,816.29 |
| Other Provincial Statute Violations | 163.04 | 156.67 - 304.64 |
| Other Federal Statute Violations | 439.10 | 437.06 - 1,195.42 |
| UCR Crime Category | Average | Range in CND$ |
|---|---|---|
| Crimes Against Person | 461.75 | 63.01 –2696.46 |
| Crimes Against Property | 174.72 | 57.90 – 554.16 |
| Other Criminal Code Violations | 449.78 | 28.43 – 9651.93 |
| Drugs and Substances Violations | 637.08 | 81.09 – 4797.87 |
| Traffic Violations | 275.89 | 151.48 –1513.04 |
| Other Provincial Statute Violations | 177.81 | 176.31 – 228.20 |
| Other Federal Statute Violations | 506.68 | 37.76 – 508.43 |
Ontario Provincial Police Costs of Crime
The following are the results from the analyses of the OPP data on costs of crime. The first section shows the results for the cost comparison between crime related (responding to and investigating crime) and indirect and non-crime related police activities such as traffic, administrative, patrol, and so on. The second section covers estimates of personal versus property crime cost comparisons according to UCR definitions of Crimes Against Person and Crimes Against Property. The third section contains the comparative estimates of costs of victimization of person versus victimization of property. Lastly, a sensitivity analysis has been conducted and the results are provided below.
Costs of Crime versus Indirect and Non-Crime Related Activities
To assess crime versus indirect and non-crime costs, the costs for criminal investigations, including drug investigations and court costs, have been included in the direct costs of crime calculations. By direct costs of crime we are referring to investigative costs related directly to the offence. Administrative, traffic, statute related costs, and operational costs have been included to calculate indirect and non-crime policing costs as these activities are not necessarily directly related to investigative policing (i.e., the activities are not necessarily directly related to crime costs). A table with each of these sub-categories with their associated costs per year can be seen in Appendix D.
As seen in Table 2.1, the results demonstrate that the total amount of police salaries for the OPP show little change across crime and non-crime costs between the years 2009 to 2013, with an exception in non-crime costs in 2013. Direct crime costs based on officer salaries ranged from $80.7 million to $86.6 million with 2013 having the lowest crime cost amount. While costs of non-criminal activities differ very little across 2009 to 2012, ranging from $23.7 million to $31 million, 2013 non-criminal activity costs jump to $98 million. The cause of the jump is due to the inclusion of cost of patrol time for OPP officers which is not included in the previous years examined. Therefore, while we see the range of the total salary proportion of crime cost vary only slightly from 73.10% to 77.91% between 2009 and 2012, the proportion of crime costs suddenly drop in 2013 to 45.26% due to the addition of patrol costs in 2013. These results suggest that when proactive/preventative policing such as patrol is added, the proportion of cost of crime may drop in proportion considerably.
| Year | Total Cost of Crime | Total Non-Crime Costs | Total Salaries/Cost | % Cost of Crime† |
|---|---|---|---|---|
| 2009 | $83,138,542.00 | $24,755,499.98 | $108,366,114.83 | 76.72% |
| 2010 | $86,614,109.47 | $26,627,227.57 | $113,881,415.40 | 76.06% |
| 2011 | $85,639,331.41 | $23,713,775.82 | $109,924,754.89 | 77.91% |
| 2012 | $85,227,542.99 | $30,987,361.60 | $116,595,104.46 | 73.10% |
| 2013 | $80,673,604.52 | $97,525,846.31 | $178,243,074.65 | 45.26% |
Note. †Percentage is based on proportion of total annual police salaries that cost of crime comprised. aTotal cost of patrol time for 2013 was $63,586,531.49.
Costs of UCR Crimes Against Person and Crimes Against Property
To calculate a comparative cost of Crimes Against Person and Crimes Against Property, the UCR definitions of these two categories have been used. Since the OPP data does not include UCR codes, the crimes have been mapped manually by the author. An appendix of the offences included under each category (i.e., person and property) can be seen in Appendix E. Arson has been excluded from the analyses because the OPP amalgamated all arson offences under one code, yet the UCR manual defines arson as two different offences depending on whether a person was the target/victim or property only has been destroyed.
The results of the interpersonal versus property crime analyses can be seen in Figure 2. The cost of UCR Crimes Against Person changes very little in cost, ranging from $31.9 million to $38 million between 2009 and 2013, with 2013 having the lowest police salary expenditures for Crimes Against Person and 2010 having the highest. Similarly, police total annual salary expenditures for Crimes Against Property shows little variation, ranging from $15.5 million to $19 million between 2009 and 2013. As with interpersonal crimes, property crimes also have the lowest expenditures for the OPP in 2013 when they are compared to the other years examined. The highest cost for Crimes Against Property is in 2009. The cost of interpersonal crime is consistently nearly twice the cost of property crimes when examining OPP policing expenditures using UCR categories.
Figure 2. Comparison of OPP Total Cost of UCR Crime Incidents by Year Based on Police Salaries (in Millions of Dollars).
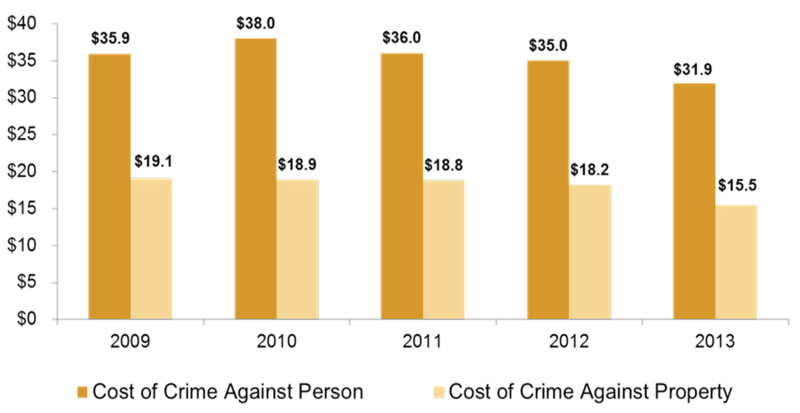
Image Description
Figure 2, a bar chart, illustrates the comparison of Ontario Provincial Police (OPP) total cost of UCR crime Incidents by year, based on police salaries (in millions of dollars).
The figure has 5 separate time points, from 2009 to 2013 for each year. There are two bars for each year for a total of 10 bars. Each pair of bars is for one year, representing the total UCR costs for crimes against persons (interpersonal crime) and crimes against property (property crime) respectively, and calculated using police salaries. For each year, the bar representing cost of interpersonal crime is higher than that for property crime.
Starting from the left hand side, the first bar illustrates the cost for interpersonal crime in 2009 at $35.9 million in police salaries. For property crimes for the same year, represented by the second lower bar, the cost was $19.1 million. The third and fourth bars represent these costs for the year 2010 in which interpersonal crime cost came to $38 million, and the fourth lower bar for property crime shows a lesser expenditure of $18.9 million. The fifth and sixth bars represent these costs for the year 2011 in which interpersonal crime cost came to $36 million, and the sixth lower bar for property crime shows a lesser expenditure of $18.8 million. The seventh and eighth bars represent these costs for the year 2012 in which interpersonal crime cost came to $35 million, and the fourth lower bar for property crime shows a lesser expenditure of $18.2 million. The final ninth and tenth bars represent these costs for OPP by salary per year for the year 2013, in which interpersonal crime cost came to $31.9 million, and the tenth lower bar for property crime shows a lesser expenditure of $15.5 million.
Costs of Victimization in Ontario
In order to calculate and compare police costs of victimization, definitions of victimization have been taken from the GSS. Appendix F contains a listing of all crimes used for each of the two victimization categories: violent victimization and non-violent victimization.
The results can be seen in Figure 3. Findings show that violent victimization changes only slightly between 2009 and 2013, ranging in total policing costs from $19 million (2009) to $20.6 million (2011). The cost of non-violent victimization is lower than violent crimes, ranging from $11.9 million (2013) to $13.1 million (2011) between 2009 and 2013.
Figure 3. Comparison of OPP Total Cost of Violent and Non-Violent Victimization by Year (in Millions of Dollars)

Image Description
Figure 3, a bar chart, illustrates the comparison of Ontario Provincial Police (OPP) total cost of violent and non-violent victimization as categorized by the General Social Survey (GSS) crime Incidents by year, based on police salaries (in millions of dollars).
The figure has 5 separate time points, from 2009 to 2013 for each year. There are two bars for each year for a total of 10 bars. Each pair of bars is for one year, representing the total costs for violent victimization (interpersonal crime) and non-violent victimization (property crime) respectively, and calculated using police salaries. For each year, the bar representing cost of violent victimization is higher than that for non-violent victimization.
Starting from the left hand side, the first bar illustrates the cost for interpersonal crime in 2009 at $19.1 million in police salaries. For property crimes for the same year, represented by the second lower bar, the cost was $11.5 million. The third and fourth bars represent these costs for the year 2010 in which interpersonal crime cost came to $19.4 million, and the fourth lower bar for property crime shows a lesser expenditure of $11.7 million. The fifth and sixth bars represent these costs for the year 2011 in which interpersonal crime cost came to $20.6 million, and the sixth lower bar for property crime shows a lesser expenditure of $12.6 million. The seventh and eighth bars represent these costs for the year 2012 in which interpersonal crime cost came to $20.5 million, and the fourth lower bar for property crime shows a lesser expenditure of $12.5 million. The final ninth and tenth bars represent these costs for OPP by salary per year for the year 2013, in which interpersonal crime cost came to $19.6 million, and the tenth lower bar for property crime shows a lesser expenditure of $11.4 million.
Cost per UCR Offence Type for OPP
An examination of cost per offence type has been conducted by dividing the total cost per offence type by the frequency of that offence to create the average cost per type of UCR offence for investigative policing for the OPP. The cost is in police salaries including overtime and reflects investigative policing costs. In the case of linking UCR codes to OPP crime code incidents, certain assumptions had to be made for specific codes. For example, while offences such as murder 1st degree could be linked directly from OPP duty codes to UCR codes, other duty codes such as robbery, are not as clear and assumptions have been made based on discussions with the OPP to match as many duty codes as possible to UCR crime codes. Not all crimes have been linked. This is due to insufficient information regarding duty codes in comparison to UCR codes to make confident linking decisions. If a duty code could not be linked confidently to a UCR code, it has not included in the current analysis. Therefore the following results are an underrepresentation and conservative estimate of investigative costs per offence. A full list of assumptions made to link OPP duty codes to UCR crime codes can be found in Appendix G.
Figure 4 illustrates the top 3 highest cost per offence for the OPP per year (2009 – 2013). As can be seen, offences that fall under Crimes Against Person, show the greatest cost for investigative policing for the OPP. Murder 1st degree and Murder 2nd degree are the highest and second highest cost per year per offence across all years observed. Between 2009 and 2011, the third highest cost per offence is Manslaughter, but this changes in 2012 and 2013 to Attempted Murder as third highest in cost per offence. Also the difference in cost is noteworthy. Murder 1st degree is considerably higher in investigative costs than the other crimes, ranging from over $441 thousand to nearly $1 million ($997,595). Meanwhile Murder 2nd degree ranges from just over $110 thousand to $362,772.
Figure 4. Top 3 Costs per Offence Type for Investigative Policing by Year.
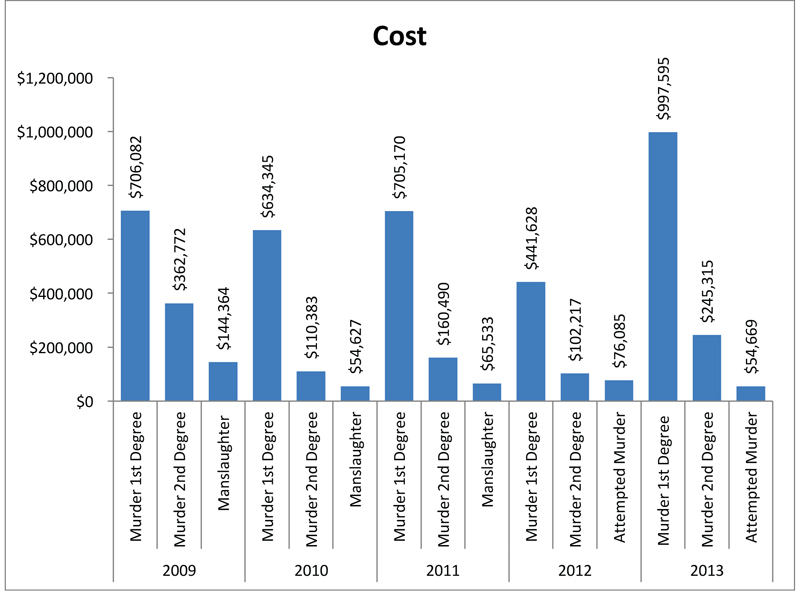
Image Description
Figure 4 is a bar chart that illustrates the top three highest costs per offence for the OPP per year (2009 through to 2013). There are three bars per year, making a total of 15 bars. The three bars per year each represent in the order going left-to-right: Murder 1st degree, Murder 2nd degree, and Manslaughter; except for years 2012 and 2013 where Manslaughter is replaced by Attempted Murder as the third highest offence cost for the OPP. For all years, the bars for Murder 1st degree are substantially higher than the other two offence categories.
Murder 1st degree and Murder 2nd degree are the highest and second highest cost per year per offence across all years observed. From left-to-right, the cost for the OPP for Murder 1st degree was $706,082 in 2009, $634,345 in 2010, $705,170 in 2011, $441,628 in 2012, and $997,595 in 2013. The cost for the OPP for Murder 2nd degree was $362,772 in 2009, $110,383 in 2010, $160,490 in 2011, $102,217 in 2012, and $245,315 in 2013.
Between 2009 and 2011, the third highest cost per offence for the OPP was Manslaughter, which was $144,364 in 2009, $54,627 in 2010, and $65,533 in 2011. In 2012 and 2013, Attempted Murder was the third highest in cost per offence for the OPP in 2012 and 2013, showing a cost of $76,085 in 2012 and $54,669 in 2013.
A full list of all UCR cost per offence calculated for the OPP between 2009 and 2013 can be seen in Appendix H. As mentioned previously, these costs do not reflect all UCR crimes committed in the OPP jurisdiction between those years, but those that could be mapped reliably by the author from existing duty codes. As seen in Tables H1 through H5 in Appendix H, the most expensive costs per offence for investigative policing are primarily Crimes Against Person. The top 10 costs are mostly comprised of the varying murder offences, varying sexual assault offences, and aggravated assaults, as well as abductions under 16 and 14, and robbery. The only Drug and Other Substances violations to reach the top 10 in cost per offence for the OPP were primarily cocaine offences with the exception of one cannabis related offence. Specifically, trafficking in cocaine is among the top 10 most costly offences for investigative policing for the OPP between 2011 and 2013. In 2011, production of cannabis was the ninth highest in cost per UCR offence for that year, right above trafficking in cocaine. The only other UCR types of offence to reach the top 10 highest costs are proceeds of crime and have stolen goods, as well as Other Criminal Code violation prostitution – bawdy house which was in the top 10 in 2011 only. The lowest cost per offence for investigative policing consistently is Other Federal Statute violations – Youth and Criminal Justice Act offence which ranges from $5.53 to $16.36 between 2009 and 2013.
Sensitivity Analysis
In discussions with the OPP, it was determined that the Operational activities may include a percentage of investigative crime. However, it cannot be determined what proportion of investigative crime costs is associated with Operational items for any given year. Due to this issue with the data, a sensitivity analysis has been conducted in order to determine if the alteration of Operational costs would notably impact the cost of crime per year. To calculate this, a percentage of Operational costs are applied to total cost of crime for the year 2013. A range of percentagesFootnote 4 have been chosen to best explore any impact changes in Operational costs might have on cost of crime outcomes. Percentages range from 10% up to 50% of Operational costs which are then added to total cost of crime per year. As can be seen in Table 2.4, adding varying proportions of Operational costs does not appear to significantly impact the cost of crime outcome for 2013.
| % of Operational Cost | Total Cost of Crime With Added Operational Cost |
|---|---|
| 10% | $82,055,786.06 |
| 20% | $83,437,967.59 |
| 30% | $84,820,149.12 |
| 40% | $86,202,330.65 |
| 50% | $87,584,512.19 |
Discussion
The goal of the current pilot project is exploratory in nature to examine different estimates of police costing by offence type in order to provide models for a better estimate in police costing. As discussed previously in this report, there are numerous challenges when attempting to calculate a better costing model for police expenditures and cost of crime (e.g., data limitations, different metrics produce different outcomes). Findings demonstrate how the choice of different metrics, in this case how interpersonal and property crime categories are defined, can significantly alter the results. This holds true no matter the sample (WKRPS or OPP) or type of policing (reactive/proactive/investigative) examined. A demonstration of how much it can alter perceptions of policing cost estimates is best demonstrated by Waterloo calls for service. Using the UCR categories for interpersonal and property crimes, the cost of crime remains highest across the two years observed for property crimes, however, using GSS Victimization categories shows higher interpersonal costs than cost of property crimes. Therefore it can be seen how by changing what is included or excluded in the metric, even slightly, can change the outcome and hence any potential conclusions drawn based on those estimates.
The results of investigative costs of crime may not comprise as much of police expenditures as first believed. Recall that police expenditures for investigative costs are estimated to be around 70% for agencies in the UK and here in Canada. For the calls for service data for Waterloo, the cost of crime comprises just over 50% for both years observed (2012 ad 2013), with the remainder of costs associated with indirect and non-crime associated preventative and proactive policing. For Waterloo, the data comprised calls for service only, meaning that it contains only front line response (patrol time/time on task) and therefore only makes up the first part of an essential equation for police crime activity, but an informative and essential one. Since Waterloo calls for service does not comprise either investigative time or infrastructure and equipment costs, what the results offer is a preliminary look at cost of frontline response as it pertains strictly to CAD data (CAD data is not the only from of front line response). When comparing cost per offence type between calls for service in Waterloo and investigative costs for OPP, we see higher expenditures per crime in OPP costs comparatively, though not exclusively, which potentially speaks to the different time demands and costs necessary for front line response compared to investigative.
The commonly held assumption of the high cost of crime for policing appears true at first when examining OPP investigative crime costs of proactive/preventative crime activities and non-crime activities such as administrative and operational costs. While the proportion of total police cost in salaries for direct crime costs was at first in the 70 percentile, this changes significantly when patrol data is added in 2013, reducing investigative crime proportion costs to below 50%. In fact, the cost of investigative crime may be even lower. In the OPP 2012 Annual Report, investigations and organized crime have been reported to comprise 10% of the OPP annual expenditures. Field operations make up 48%, while traffic safety and operational support comprises 18% of total expenditures in the 2012/13 fiscal year for the OPP. The higher proportion of reactive and preventative policing is not necessarily surprising considering that they are essential and ongoing services required for public safety. For example, far more people are injured or die each year from traffic accidents than from assault or homicide, making proactive programs like RIDE and vehicle stops as well as patrol and traffic police activities indispensable for public safety. Also reactive and preventative non-crime workload for police includes maintenance to reduce public disorder. These types of activities and growing complexity that increase police service demands include responding and dealing with intoxicated persons, mentally ill individuals, compassionate to locate, responding and helping to resolve disputes, and so on. As can be seen, these types of services are vital to community safety.
Also, it should be noted that while the current costing analysis conducted for this report shows total costs of police expenditures to be highest during 2013 when patrol activity was added for a total for $178.2 million, this does not reflect a true total for all police agency expenditures for that year. The 2012 annual report states that the total OPP operating expenditures for the fiscal 2012/2013 year came to $985.7 million. When conducting costing models, it may be a good practice to report that the costs used in a study does not necessarily reflect the entire total expenditures for a police agency. Police costing models can focus on many facets of policing, therefore depending on the focus, it offers only a view of that particular area. Policing costs is a multi-faceted arena of expenditures and that should be kept in mind when interpreting any costing estimate. The choice of focus and how it is defined, the metric used, can alter the costing outcome. The impact of metrics chosen and how it can change the outcome was demonstrated in the differences in crime categories between the UCR and GSS victimization terms. The limits of information of costing estimates was also seen when examining the focus of the current costing models used in this report in relation to actual reported financial expenditures for the fiscal year for the OPP. In other words, a costing estimate will not necessarily reflect all police expenditures for that police service.
Along similar lines, it should also be kept in mind that UCR codes only reflect federal crime violations; they do not capture provincial or municipal by-law criminal occurrences and only reflect a proportion of all calls for service (ICURS, 2015). Therefore UCR is an inexact costing model for total costs of crime as it does not capture all crimes and as previously discussed, when coded, only the most serious violation for an incident is recorded.
Another interesting finding is that while WRPS and OPP expenditures remain fairly consistent throughout the years observed in this report, statistical reports present conflicting information on crime rates in Ontario. The OPP 2012 Annual Report shows that there has been an overall rise in crime in Ontario for the regions policed by the OPPFootnote 5, however, in a report on crime rates in Canada (Boyce, Cotter, & Perreault, 2014) by Statistics Canada, Ontario crime rates have been steadily decreasing annually overall with some exceptions (e.g., sexual assault), and has one of the lowest crime rates in Canada. A reason for this difference could be that the OPP does not police major metropolitan areas like Toronto and Ottawa, so their data cannot account for the change in crime rate for all of Ontario, nor can Waterloo. Furthermore, neither data set can be claimed to capture all offences for their respective policing since UCR codes do not contain all offences.
In regards to the sensitivity analysis, while it did not appear to significantly affect the total outcome of cost of crime expenditures sought, it is important to have as accurate an estimate as possible. The sensitivity analysis was conducted because it was not known what proportion of OPP operational expenses were attributable to crime versus non-crime activities. To achieve better accuracy, knowledge of the precise proportion of costs devoted to criminal investigative activities and costs allotted to non-criminal activities is essential in order to determine the most precise estimate of policing expenditures possible.
Another recommendation for obtaining a more accurate estimate would be the use of sample sizes, in this case number of police service members per incidentFootnote 6, to determine if differences between costs are significant. For example, if information on the number of police officers per calls for service for Waterloo was available, chi-square tests could be conducted to determine if the differences between cost of crime and non-crime or cost per crime category (interpersonal compared to property, different to a statistically significant degree. Analyses of this nature could provide more precise and informative results for consideration.
The findings in this report are the results of a pilot project only. With only two different police services providing data, caution should be taken in generalizing and inferring the results. Any conclusions are tentative. Furthermore, WRPS calls for service data do not represent all crimes, but only front line response captured by CAD and therefore should be taken as preliminary findings only. What has been demonstrated is that a great deal more detailed, and hence more informative, analyses can be conducted to create a more accurate costing estimate for policing. By comparing different types of policing such as reactive, preventative, and investigative, the expenditures for these types of policing can be determined to provide a more instructive estimate. By looking at type of occurrence and/or offence types at a more granular level, we can better distinguish the costs for specific types of occurrences, creating a more informative estimate. By using standardized definitions and ones that include all offences, we can more accurately capture the true cost of crime in Canada for police services. The goal of this pilot project is to provide a more accurate estimate for policing costs; it has not been to provide conclusions regarding how police expenditures should be allocated but rather how best to proceed to obtain more accurate and detailed results when conducting policing cost assessments.
References
Boyce, J., Cotter, A., & Perreault, S. (2014). Police-reported crime statistics in Canada, 2013. Juristat, 85(2), 1-39. Ottawa, Canada: Statistics Canada.
Burczycka, M. (2013). Police resources in Canada, 2012. Ottawa, ON: Statistics Canada
Canadian Association of Chiefs of Police. (2008). Resolutions Summaries. Kanata, ON: Canadian Association of Chiefs of Police.
Council of Canadian Academies, 2014. Policing Canada in the 21st Century: New Policing for New Challenges. Ottawa (ON): The Expert Panel on the Future of Canadian Policing Models, Council of Canadian Academies.
Gabor, T. (2014). A Synthesis of the literature. Unpublished report. Ottawa, ON: Lansdowne.
Kaustinen, F. (2013). Interest arbitration and collective agreements. Presentation at Economics of Policing: The Police Education and Learning Summit, Charlottetown, P.E.I.
Kiedrowski, J., Petrunik, M., Macdonald, T., & Melchers, R. (2013). Canadian Police Board views on the use of police performance metrics. Public Safety Canada.
Haney, J. (2014). Unpublished thesis.
House of Commons. (2014). Economics of policing: Report of the Standing Committee on Public Safety and National Security. Kramp, D. (Chair). Ottawa, ON: House of Commons.
Institute for Canadian Urban Research Studies (ICURS), (November, 2014). Economics of Policing: Complexity and Costs in Canada, 2014 – Summary Report. Vancouver B.C.: Simon Fraser University.
Institute for Canadian Urban Research Studies (ICURS). (January, 2015). Crime Rates, the Crime Severity Index and Crime Gravity Scores. ICURS Technical Note 1.1: Measures of Police Performance.Unpublished draft. Vancouver, B.C.: Simon Fraser University.
Malm, A., Pollard, N., Brantingham, Paul., Tinsley, P., Plecas, D., Brantingham, Patricia, Cohen, I., Kinney, B. (2005). A 30 year analysis of police service delivery and costing: 'E' Division.Centre for Criminal Justice Research: Abbotsford, B.C.
Maslov, A. and R. Huggins. (2013) “Cost of police education and learning in Canada.” Presented by R. Huggins at the Economics of Policing: Police Education and Learning Summit, September 17 -18, 2013. Public Safety Canada. Accessed January 29, 2015 from http://www.policelearningsummit.com/presentations/Rachel_Huggins.pdf
Ontario Provincial Police. (2013). Ontario Provincial Police 2012 annual report. Ontario: OPP. Retrieved from: http://www.opp.ca/ecms/files/250258838.6.pdf
Pannell, B. (2013). Costs of training. Presentation at Economics of Policing: The Police Education and Learning Summit, Charlottetown, P.E.I.
Perreault, S., & Brennan, S. (2010). Criminal victimization in Canada, 2009. Juristat, 30(2), 1-33. Ottawa, Canada: Statistics Canada.
Potter, M. (2013). Economics of policing: Police education and learning summit. Public Safety Canada. Presentation at Economics of Policing: The Police Education and Learning Summit, Charlottetown, P.E.I.
Public Safety Canada. (2012). Economics of policing. Presentation at Economics of Policing: The Police Education and Learning Summit, Charlottetown, P.E.I.
R. v. B. (K.G.), [1993] 1 S.C.R. 740.
R. v. Duarte, [1990] 1 S.C.R. 30.
R. v. Stinchcombe, [1991] 3 S.C.R. 326.
Rollings, K. (2008). Counting the costs of crime in Australia. Canberra: Australian Institute of Criminology.
Ruddell, R. & Jones, N. A. (2013). Austerity policing: Responding to crime during economic downturns. Regina: Collaborative Centre for Justice and Safety.
Standing Committee on Public Safety and National Security. (2014). Economics of Policing. Committee Report. House of Commons.
Statistics Canada. (2012). Police Resources in Canada, 2012 (Report no. 85-255-X). Canada: Statistics Canada.
Statistics Canada. (2013). Crime severity index, by province and territory, 2011. Retrieved from http://www.statcan.gc.ca/tables-tableaux/sumsom/l01/cst01/legal51a-eng.htm
Walby, S. (2004). The Cost of Domestic Violence. London: Women and Equality Unit, Department of Trade and Industry.
Zhang, T. (2008). Costs of crime. Ottawa, ON: Department of Justice Canada.
Zhang, T., Hoddenbagh, J., McDonald, S., & Scrim, K. (2012). An Estimation of the economic impact of spousal violence in Canada, 2009. Ottawa, ON: Department of Justice Canada.
Appendix A: Waterloo 2012 and 2013 Offences Used for GSS Categories of Victimization
| Violent Victimization Crimes | Non-Violent Victimization Crimes |
|---|---|
| Sexual Assault w/Weapon | Arson |
| Sexual Assault | Break and Enter |
| Invitation to Sexual Touching | Theft Over $5000 |
| Sexual Interference | Theft Over $5000 – From Motor Vehicles |
| Sexual Exploitation | Theft of Motor Vehicles |
| Incest | Theft Under $5000 |
| Aggravated Assault – Level 3 | Theft Under $5000 – From Motor Vehicles |
| Assault with Weapon or CBH – Level 2 | Break and Enter a Motor Vehicle (Firearm) |
| Assault | Mischief |
| Assault Public Officer | |
| Assault Public Officer w/Weapon or CBH | |
| Discharge Firearms with Intent | |
| Robbery | |
| Utter Threats to Person | |
| Other Assaults |
| Violent Victimization Crimes | Non-Violent Victimization Crimes |
|---|---|
| Arson – Disregard for Human Life | Arson |
| Sexual Assault | Break and Enter |
| Sexual Interference | Break and Enter a Motor Vehicle (Firearm) |
| Aggravated Assault – Level 3 | Theft Over $5000 |
| Assault with Weapon or CBH – Level 2 | Theft Over $5000 – From Motor Vehicles |
| Assault | Theft of Motor Vehicles |
| Discharge Firearms with Intent | Theft Under $5000 |
| Robbery | Theft Under $5000 – From Motor Vehicles |
| Utter Threats to Person | Mischief |
Appendix B: Average Cost of Offence Type per Incident in Waterloo 2012
a denotes highest average.
b denotes lowest average.
| UCR Codes | Occurrence Type | Total Cost of UCR Crimes Against Person | Cost Per UCR Crimes Against Person |
|---|---|---|---|
| 1110 | Homicide 1st Degree | $51,403.26 | $17,134.42 |
| 1130 | Manslaughter | $20,772.08 | $20,772.08a |
| 1210 | Attempted Murder | $32,341.67 | $8,085.42 |
| 1320 | Sexual Assault w/Weapon | $512.30 | $512.30 |
| 1330 | Sexual Assault | $108,013.86 | $323.39 |
| 1350 | Invitation to Sexual Touching | $3,499.22 | $233.28 |
| 1345 | Sexual Interference | $15,693.09 | $307.71 |
| 1355 | Sexual Exploitation | $763.51 | $127.25 |
| 1360 | Incest | $9.46 | $9.46b |
| 1370 | Luring a Child via a Computer | $1,729.27 | $157.21 |
| 1385 | Voyeurism | $4,457.39 | $234.60 |
| 1410 | Aggravated Assault Level 3 | $67,383.28 | $2,323.56 |
| 1420 | Assault w/Weapon or Causing Bodily Harm Level 2 | $416,178.12 | $658.51 |
| 1430 | Assault Level 1 | $669,624.28 | $359.24 |
| 1440 | Unlawfully Causing Bodily Harm | $894.87 | $298.29 |
| 1450 | Discharge Firearm w/Intent | $344.95 | $172.47 |
| 1455 | Using Firearm/Imitation of Firearm in Commission of Offence | $54,719.96 | $1,243.64 |
| 1460 | Assault Against Peace Public Officer | $45,362.05 | $677.05 |
| 1461 | Assault Against Peace Officer With a Weapon or Causing Bodily Harm | $2,610.04 | $1,305.02 |
| 1470 | Criminal Negligence Causing Bodily Harm | $5,168.64 | $1,722.88 |
| 1480 | Other Assault | $60,536.58 | $903.53 |
| 1515 | Kidnapping | $483.87 | $483.87 |
| 1516 | Forcible Confinement | $74,785.10 | $1,133.11 |
| 1530 | Abduction Under 14, Not Parent/Guardian | $158.16 | $158.16 |
| 1540 | Abduction Under 16 | $168.59 | $168.59 |
| 1610 | Robbery | $232,667.44 | $799.54 |
| 1620 | Extortion | $2,567.74 | $233.43 |
| 1622 | Intimidation of a Non-Justice System Participant | $2,449.54 | $306.19 |
| 1625 | Criminal Harassment | $81,551.13 | $208.57 |
| 1626 | Indecent/Harassing Telephone Calls | $17,197.82 | $146.99 |
| 1627 | Utter Threats to Person | $329,735.83 | $377.27 |
| 1629 | Arson – Disregard for Human Life | $7,163.33 | $1,023.33 |
| 1630 | Other Violations Against the Person | $35,773.66 | $5,110.52 |
| Grand Total | $2,346,720.07 | ||
| Average | $475.62 |
| UCR Codes | Occurrence Type | Total Cost of UCR Property Crimes | Cost Per UCR Property Crime |
|---|---|---|---|
| 2110 | Arson | $41,651.72 | $438.44 |
| 2120 | Break and Enter | $353,002.86 | $176.94 |
| 2121 | Break and Enter to Steal Firearm | $1,008.28 | $32.53b |
| 2130 | Theft Over $5000 | $20,455.87 | $200.55 |
| 2132 | Theft Over $5000 From a Motor Vehicle | $999.12 | $55.51 |
| 2135 | Motor Vehicle Theft | $63,879.66 | $104.89 |
| 2140 | Theft $5000 or Under | $274,340.21 | $81.24 |
| 2142 | Theft $5000 or Under from a Motor Vehicle | $118,008.17 | $38.64 |
| 2143 | Shoplifting $5000 or Under | $279,793.91 | $155.27 |
| 2150 | Have Stolen Goods | $3,996.49 | $1,332.16a |
| 2153 | Possession of Stolen Goods Over $5000 | $38,501.93 | $396.93 |
| 2155 | Trafficking of Stolen Goods $5000 and Under | $2954.00 | $295.40 |
| 2156 | Possession of Stolen Goods $5000 and Under | $457,008.52 | $228.62 |
| 2125 | Break and Enter a Motor Vehicle (Firearm) | $88.09 | $44.05 |
| 2133 | Shoplifting Over $5000 | $95.84 | $95.84 |
| 2160 | Fraud | $117,846.41 | $126.72 |
| 2165 | Identity Theft | $12,376.20 | $229.19 |
| 2166 | Identity Fraud | $24,305.52 | $136.55 |
| 2170 | Mischief | $522,778.50 | $173.34 |
| 2178 | Altering/Destroying/Removing a Vehicle Identification Number | $948.18 | $474.09 |
| Grand Total | $2,334,039.46 | ||
| Average | $134.55 |
| UCR Codes | Occurrence Type | Total Cost of UCR Other Criminal Code Violations | Cost Per UCR Other Criminal Code Violations |
|---|---|---|---|
| 3110 | Bawdy House | $104.15 | $104.15 |
| 3115 | Living Off the Avails of Prostitution of a Person Under 18 | $241.84 | $241.84 |
| 3125 | Prostitution – Obtains/Communicates with a Person Under 18 for Purpose of Sex | $155.90 | $155.90 |
| 3130 | Other Prostitution | $1,233.28 | $44.05b |
| 3310 | Offensive Weapons: Explosives | $358.04 | $179.02 |
| 3365 | Offensive Weapons: Weapons Trafficking | $10,678.52 | $3,559.51a |
| 3370 | Weapons Possession Contrary to Order | $50,175.94 | $2,508.80 |
| 3375 | Possession of Weapons | $355,128.91 | $829.74 |
| 3390 | Firearms Documentation/Administration | $30,081.14 | $1,583.22 |
| 3395 | Unsafe Storage of Firearms | $16,795.28 | $1,526.84 |
| 3410 | Failure to Comply with Conditions | $465,794.50 | $441.09 |
| 3420 | Counterfeiting Currency | $4,235.55 | $103.31 |
| 3430 | Disturb the Peace | $23,492.95 | $435.05 |
| 3440 | Escape Custody | $29,184.42 | $521.15 |
| 3450 | Indecent Acts | $12,039.57 | $132.30 |
| 3455 | Production/Distribution of Child Pornography | $8,364.48 | $321.71 |
| 3460 | Public Morals | $95.06 | $95.06 |
| 3470 | Obstruct Public Peace Officer | $106,873.49 | $497.09 |
| 3480 | Prisoner Unlawfully at Large | $2,244.24 | $748.08 |
| 3490 | Trespass at Night | $43,593.08 | $246.29 |
| 3510 | Failure to Attend Court | $2,132.79 | $355.47 |
| 3520 | Breach of Probation | $526,649.65 | $444.43 |
| 3540 | Utter Threats Against Property or Animals | $24,840.93 | $382.17 |
| 3700 | Unauthorized Recording of a Movie/Purpose of Sale, Rental, Commercial Distribution | $1,352.33 | $1,352.33 |
| 3710 | Offences Against Public Order | $31,185.68 | $708.77 |
| 3720 | Firearms and Other Offensive Weapons (Part III CC) | $52,882.75 | $3,525.52 |
| 3730 | Offences Against the Administration of Law and Justice (Part IV CC) | $56,168.48 | $376.97 |
| 3740 | Sexual Offences, Public Morals and Disorderly Conduct (Part V CC) | $5,113.64 | $2,556.82 |
| 3750 | Invasion of Privacy (Part IV CC) | $260.34 | $260.34 |
| 3770 | Offences Against the Person and Reputation (Part VIII CC) | $1,193.82 | $596.91 |
| 3780 | Offences Against the Rights of Property (Part IX CC) | $60,208.49 | $573.41 |
| 3820 | Offences Related to Currency (Part XII CC) | $158.64 | $158.64 |
| 3825 | Proceeds of Crime (Part XII.2 CC) | $1,052.47 | $175.41 |
| 3830 | Attempts, Conspiracies, Accessories (Part XIII CC) | $2,111.10 | $1,055.55 |
| Grand Total | $1,926,181.47 | ||
| Average | $506.49 |
| UCR Codes | Occurrence Type | Total Cost of UCR Drugs/Substances Violations | Cost Per UCR Drugs/Substances Violations |
|---|---|---|---|
| 4110 | Possession: Heroin | $14,323.94 | $550.92 |
| 4120 | Possession: Cocaine | $59,224.97 | $548.38 |
| 4130 | Possession: Other Controlled Drugs and Substances Act | $77,470.69 | $397.29 |
| 4140 | Possession: Cannabis | $287,082.19 | $236.87 |
| 4150 | Possession: Methamphetamine (Crystal Meth) | $5,682.73 | $270.61 |
| 4160 | Possession: Methylenedioxyamphetamine (Ecstasy) | $4,204.78 | $525.60 |
| 4210 | Trafficking: Heroin | $15,367.31 | $1,707.48 |
| 4220 | Trafficking: Cocaine | $41,673.61 | $886.67 |
| 4230 | Trafficking: Other Controlled Drugs and Substances Act | $29,487.92 | $1,092.15 |
| 4240 | Trafficking: Cannabis | $53,700.21 | $716.00 |
| 4250 | Trafficking: Methamphetamine (Crystal Meth) | $10,601.62 | $1,766.94 |
| 4260 | Trafficking: Methylenedioxyamphetamine (Ecstasy) | $1,151.67 | $575.84 |
| 4330 | Importation and Exportation: Other Controlled Drugs and Substances Act | $3,525.85 | $3,525.85 |
| 4340 | Importation and Exportation: Cannabis | $3,126.42 | $625.28 |
| 4420 | Production: Cocaine | $56.73 | $56.73b |
| 4430 | Production: Other Controlled Drugs and Substances Act | $4,211.73 | $4,211.73a |
| 4440 | Production: Cannabis | $32,684.28 | $510.69 |
| 4450 | Production: Methamphetamine (Crystal Meth) | $214.63 | $214.63 |
| Grand Total | $643,791.27 | ||
| Average | $355.88 |
| UCR Codes | Occurrence Type | Total Cost of UCR Other Federal Statute Violations | Cost Per UCR Other Federal Statute Violations |
|---|---|---|---|
| 6450 | Youth Criminal Justice Act | $162,148.42 | $437.06 |
| 6510 | Human Trafficking | $1,195.42 | $1,195.42 |
| Grand Total | $163,343.84 | ||
| Average | $439.10 |
| UCR Codes | Occurrence Type | Total Cost of UCR Other Provincial Statute Violations | Cost Per UCR Other Provincial Statute Violations |
|---|---|---|---|
| 7100 | Liquor Act | $174,378.31 | $156.67 |
| 7300 | Other Provincial Statutes | $15,231.79 | $304.64 |
| Grand Total | $189,610.10 | ||
| Average | $163.04 |
| UCR Codes | Occurrence Type | Total Cost of UCR Traffic Violations | Cost Per UCR Traffic Violations |
|---|---|---|---|
| 9110 | Dangerous Operation: Causing Death | $3,816.29 | $3,816.29 |
| 9120 | Dangerous Operation: Causing Bodily Harm | $12,089.05 | $1,511.13 |
| 9130 | Dangerous Operation: Operation of Motor Vehicle, Vessel or Aircraft | $101,338.79 | $745.14 |
| 9133 | Flight From Peace Officer | $14,307.88 | $596.16 |
| 9220 | Impaired Operation: Causing Bodily Harm (Alcohol) | $4,572.76 | $1,524.25 |
| 9230 | Impaired Operation: Operation of Motor Vehicle, Vessel or Aircraft or Over 80 mg (Alcohol) |
$343,767.08 | $607.36 |
| 9235 | Impaired Operation: Operation of Motor Vehicle, Vessel or Aircraft or Over 80 mg (Drugs) |
$10,491.09 | $874.26 |
| 9240 | Impaired Operation: Failure to Comply or Refusal (Alcohol) | $38,206.20 | $561.86 |
| 9245 | Impaired Operation: Failure to Comply or Refusal (Drugs) | $2,194.03 | $1,097.02 |
| 9250 | Impaired Operation: Failure to Provide Blood Sample (Alcohol) | $1,552.38 | $776.19 |
| 9311 | Failure to Stop Causing Death | $3,816.29 | $3,816.29a |
| 9312 | Failure to Stop Causing Bodily Harm | $3,283.36 | $1,641.68 |
| 9313 | Failure to Stop or Remain | $37,369.29 | $602.73 |
| 9320 | Driving While Prohibited | $42,145.30 | $430.05 |
| 9450 | Dangerous Operation of Motor Vehicle While Street Racing | $1.18 | $1.18b |
| 9510 | Fail to Stop or Remain (Provincial) | $103,522.49 | $183.88 |
| 9520 | Dangerous Driving Without Due Attention | $265,778.49 | $205.55 |
| 9530 | Driving While Disqualified or License Suspended | $189,706.57 | $147.63 |
| Grand Total | $1,177,958.52 | ||
| Average | $285.43 |
Appendix C: Average Cost of Offence Type per Incident in Waterloo 2013
a denotes highest average.
b denotes lowest average.
| UCR Code | Occurrence Type | Total Cost of UCR Crimes Against Person | Cost Per UCR Crime Against Person |
|---|---|---|---|
| 1330 | Sexual Assault | $94,018.33 | $296.59 |
| 1345 | Sexual Interference | $13,704.34 | $351.39 |
| 1370 | Luring a Child via a Computer | $2,574.30 | $198.02 |
| 1385 | Voyeurism | $1,983.88 | $396.78 |
| 1410 | Aggravated Assault Level 3 | $94,376.16 | $2,696.46a |
| 1420 | Assault w/Weapon or Causing Bodily Harm Level 2 | $381,247.80 | $694.44 |
| 1430 | Assault | $648,993.65 | $382.44 |
| 1450 | Discharge Firearm w/Intent | $2,461.75 | $820.58 |
| 1455 | Using Firearm/Imitation of Firearm in Commission of Offence | $37,693.67 | $1,507.75 |
| 1457 | Pointing a Firearm | $24,689.39 | $2,468.94 |
| 1515 | Kidnapping | $237.20 | $237.20 |
| 1530 | Abduction Under 14, Not Parent/Guardian | $904.47 | $452.23 |
| 1540 | Abduction Under 16 | $63.01 | $63.01b |
| 1610 | Robbery | $186,239.75 | $779.25 |
| 1620 | Extortion | $5,229.08 | $435.76 |
| 1622 | Intimidation of a Non-Justice System Participant | $6,167.10 | $881.01 |
| 1625 | Criminal Harassment | $110,428.28 | $262.92 |
| 1626 | Indecent/Harassing Telephone Calls | $18,034.86 | $187.86 |
| 1627 | Utter Threats to Person | $342,311.49 | $424.70 |
| 1629 | Arson – Disregard for Human Life | $3,682.85 | $1841.43 |
| 1630 | Other Violations Against the Person | $2,173.50 | $724.50 |
| Grand Total | $1,977,214.85 | ||
| Average | $461.75 |
| UCR Code | Occurrence Type | Total Cost of UCR Property Crimes | Cost Per UCR Property Crime |
|---|---|---|---|
| 2110 | Arson | $66,499.16 | $554.16a |
| 2120 | Break and Enter | $437,464.72 | $223.54 |
| 2121 | B & E to Steal Firearm | $184.41 | $184.41 |
| 2130 | Theft Over $5000 | $21,961.03 | $217.44 |
| 2132 | Theft From a Motor Vehicle Over $5000 | $3,162.90 | $210.86 |
| 2135 | Motor Vehicle Theft | $75,871.08 | $140.74 |
| 2140 | Theft $5000 or Under | $315,647.19 | $105.46 |
| 2142 | Theft $5000 or Under From a Motor Vehicle | $128,603.15 | $57.90b |
| 2143 | Shoplifting $5000 or Under | $318,131.65 | $181.27 |
| 2153 | Possession of Stolen Goods Over $5000 | $61,881.64 | $476.01 |
| 2156 | Possession of Stolen Goods $5000 or Under | $565,088.64 | $307.45 |
| 2160 | Fraud | $11,324.55 | $142.97 |
| 2165 | Identity Theft | $1,964.55 | $333.08 |
| 2166 | Identity Fraud | $34,971.98 | $197.58 |
| 2170 | Mischief | $507,730.62 | $200.29 |
| Grand Total | $2,680,768.67 | ||
| Average | $174.72 |
| UCR Codes | Occurrence Type | Total Cost of Other Criminal Code UCR Violations | Cost Per UCR for Other Criminal Code Violations |
|---|---|---|---|
| 3120 | Procuring | $1,165.53 | $582.76 |
| 3130 | Other Prostitution | $4,718.49 | $337.04 |
| 3310 | Explosives | $28.43 | $28.43b |
| 3365 | Weapons Trafficking | $12,377.17 | $4,125.72 |
| 3370 | Weapons Possession Contrary to Order | $123,819.32 | $2,098.63 |
| 3375 | Possession of Weapons | $425,926.31 | $983.66 |
| 3380 | Unauthorized Importing/Exporting of Weapons | $487.09 | $243.54 |
| 3390 | Firearms Documentation/Administration | $15,998.97 | $5,332.99 |
| 3395 | Unsafe Storage of Firearms | $12,675.30 | $1,267.53 |
| 3410 | Failure to Comply with Conditions | $457,778.78 | $455.95 |
| 3420 | Counterfeiting Currency | $10,755.29 | $122.22 |
| 3430 | Disturb the Peace | $21,442.77 | $428.86 |
| 3440 | Escape Custody | $40,426.76 | $662.73 |
| 3450 | Indecent Acts | $15,470.76 | $200.92 |
| 3455 | Production/Distribution of Child Pornography | $6,719.33 | $186.65 |
| 3460 | Public Morals | $325.29 | $325.29 |
| 3470 | Obstruct Public Peace Officer | $134,804.73 | $657.58 |
| 3490 | Trespass at Night | $39,823.00 | $288.57 |
| 3520 | Breach of Probation | $719,309.42 | $577.29 |
| 3540 | Utter Threats Against Property or Animals | $27,976.65 | $451.24 |
| 3710 | Offences Against Public Order | $20,351.49 | $521.83 |
| 3720 | Firearms and Other Offensive Weapons | $20,129.25 | $1,258.08 |
| 3730 | Offences Against the Administration of Law and Justice (Part IV CC) | $56,742.44 | $468.95 |
| 3740 | Sexual Offences, Public Morals and Disorderly Conduct (Part V CC) | $19,303.85 | $9,651.93a |
| 3770 | Offences Against the Person and Reputation (Part VIII CC) | $2,327.48 | $332.50 |
| 3780 | Offences Against the Rights of Property (Part IX CC) | $105,855.22 | $904.75 |
| 3810 | Wilful and Forbidden Acts in Respect of Certain Property (Part XI CC) | $6,744.94 | $518.84 |
| 3830 | Attempts, Conspiracies, Accessories (Part XIII CC) | $10,865.86 | $1552.27 |
| Grand Total | $1,716,828.00 | ||
| Average | $449.78 |
| UCR Codes | Occurrence Type | Total Cost for UCR Drugs/Substances Violations | Cost Per UCR Drugs/Substances Violations |
|---|---|---|---|
| 4110 | Possession: Heroin | $31,184.21 | $677.92 |
| 4120 | Possession: Cocaine | $87,944.90 | $726.82 |
| 4130 | Possession: Other Controlled Drugs and Substances Act | $190,579.12 | $765.38 |
| 4140 | Possession: Cannabis | $374,472.25 | $327.34 |
| 4150 | Possession: Methamphetamine (Crystal Meth) | $13,111.88 | $291.38 |
| 4160 | Possession: Methylenedioxyamphetamine (Ecstasy) | $1,369.42 | $228.24 |
| 4220 | Trafficking: Cocaine | $134,732.53 | $2,173.11 |
| 4230 | Trafficking: Other Controlled Drugs and Substances Act | $145,882.36 | $2,359.15 |
| 4240 | Trafficking: Cannabis | $179,009.99 | $1,924.84 |
| 4250 | Trafficking: Methamphetamine (Crystal Meth) | $10,877.39 | $906.45 |
| 4340 | Importation and Exportation: Cannabis | $324.38 | $81.09b |
| 4420 | Production: Cocaine | $4,797.87 | $4,797.87a |
| 4440 | Production: Cannabis | $10,592.48 | $158.10 |
| 4450 | Production: Methamphetamine (Crystal Meth) | $2,040.06 | $2,040.06 |
| Grand Total | $1,219,367.22 | ||
| Average | $637.08 |
| UCR Codes | Occurrence Type | Total Cost of UCR Other Federal Statute Violations | Cost Per UCR Other Federal Statute Violations |
|---|---|---|---|
| 6450 | Youth Criminal Justice Act | $136,767.12 | $508.43 |
| 6510 | Human Trafficking | $37.76 | $37.76 |
| Grand Total | $136,804.88 | ||
| Average | $506.68 |
| UCR Codes | Occurrence Type | Total Cost of UCR Other Provincial Statute Violations | Cost Per UCR Other Provincial Statute Violations |
|---|---|---|---|
| 7100 | Liquor Act | $154,096.92 | $176.31 |
| 7300 | Other Provincial Statutes | $5,933.08 | $228.20 |
| Grand Total | $160,030.00 | ||
| Average | $177.81 |
| UCR Codes | Occurrence Type | Total Cost of UCR Traffic Violations | Cost Per UCR Traffic Violations |
|---|---|---|---|
| 9120 | Dangerous Operation: Causing Bodily Harm | $7,120.23 | $1,186.20 |
| 9130 | Dangerous Operation of Motor Vehicle, Vessel or Aircraft | $121,625.69 | $996.93 |
| 9133 | Flight from Peace Officer | $40,193.88 | $1,296.58 |
| 9230 | Operation of Motor Vehicle: Impaired Over 80 mg (Alcohol) | $307,264.70 | $646.87 |
| 9235 | Operation of Motor Vehicle, Vessel or Aircraft or over 80 mg. (Drugs) | $4,539.11 | $1,513.04a |
| 9240 | Impaired Operation: Failure to Comply or Refusal (Alcohol) | $35,735.63 | $567.23 |
| 9313 | Failure to Stop or Remain | $33,699.95 | $660.78 |
| 9320 | Driving While Prohibited | $32,710.96 | $363.46 |
| 9510 | Traffic Violation: Fail to Stop or Remain | $117,149.45 | $173.30 |
| 9520 | Dangerous Driving Without Due Attention | $291,493.00 | $196.82 |
| 9530 | Traffic Violation: Driving While Disqualified or License Suspended | $194,653.30 | $151.48b |
| Grand Total | $1,181,646.80 | ||
| Average | $275.89 |
Appendix D: OPP List of Duty Categories and Total Costs
| Duty Category | 2009 | 2010 | 2011 | 2012 | 2013 |
|---|---|---|---|---|---|
| Administrative | $7,896,134.76 | $7,938,995.72 | $80,401.10 | $7,847,410.98 | $7,587,344.68 |
| Operational | $3,624,950.34 | $5,603,040.97 | $10,576,311.85 | $10,280,717.90 | $13,821,815.33 |
| Crime | $71,671,848.30 | $74,587,470.99 | $74,277,691.27 | $74,879,403.54 | $74,972,867.97 |
| Court | $2,862,613.64 | $2,969,966.90 | $3,069,614.28 | $2,730,922.87 | $1,224,555.64 |
| Drugs | $8,634,044.35 | $9,056,671.58 | $8,292,025.86 | $7,617,216.58 | $7,820,245.60 |
| Statutes | $442,108.56 | $640,078.36 | $571,647.66 | $380,199.88 | $228,621.02 |
| Traffic | $13,234,414.88 | $13,085,190.89 | $13,137,463.97 | $12,859,232.72 | $8,957,469.12 |
| Patrol | N/A | N/A | N/A | N/A | $63,586,531.49 |
Appendix E: OPP Offences Used for UCR Categories of Crime
| Crimes Against Person | Crimes Against Property |
|---|---|
| Murder First Degree | Break and Enter – Residence |
| Murder Second Degree | Break and Enter – Other |
| Manslaughter | Theft – Automobile |
| Attempted Murder | Theft – Trucks |
| Aggravated Sexual Assault | Theft – Motorcycles |
| Sexual Assault with Weapon | Theft – Other Motor Vehicles |
| Sexual Assault | Theft Over $5000 – Bicycles |
| Assault – Level 1 | Theft Over $5000 – From Motor Vehicles |
| Assault with Weapon or CBH – Level 2 | Theft Over $5000 – Shoplifting |
| Aggravated Assault – Level 3 | Theft Over $5000 – Other |
| Unlawfully Causing Bodily Harm | Theft Over $5000 – Mining Product |
| Discharge Firearms with Intent | Theft Over $5000 – Mine Equipment/Property |
| Assault Police | Theft Over $5000 – Load |
| Assaults – Other Peace/Public Officer | Theft Under $5000 – Bicycles |
| Assaults – Other | Theft Under $5000 – From Motor Vehicles |
| Sexual Offences (Not Assaults) | Theft Under $5000 – Shoplifting |
| Abduction – Person Under 14 | Theft Under $5000 – Other |
| Abduction – Person Under 16 | Theft Under $5000 – Mining Product |
| Abduction – Contravene Custody Order | Theft Under $5000 – Mine Equipment/Property |
| Abduction – No Custody Order | Have Stolen Goods |
| Robbery – Firearms | Frauds – Cheques |
| Robbery – Other Offensive Weapons | Frauds – Credit Cards |
| Robbery – Other Robbery | Frauds – Welfare |
| Utter Threats to Person | Frauds – Other |
| Criminal Harassment | Mischief (Property Damage) Over $5000 |
| Other Criminal Code – Indecent Acts | Mischief (Property Damage) $5000 and Under |
| Other Criminal Code – Kidnapping | Extortion |
| FRAUD Money/property/security > $5000 |
Appendix F: OPP Offences Used for GSS Categories of Victimization
| Violent Victimization Crimes | Non-Violent Victimization Crimes |
|---|---|
| Aggravated Sexual Assault | Break and Enter – Business Premises |
| Sexual Assault with Weapon | Break and Enter – Residence |
| Sexual Assault | Break and Enter – Other |
| Assault – Level 1 | Theft – Automobile |
| Assault with Weapon or CBH – Level 2 | Theft – Trucks |
| Aggravated Assault – Level 3 | Theft – Motorcycles |
| Unlawfully Causing Bodily Harm | Theft – Other Motor Vehicles |
| Discharge Firearms with Intent | Theft Over $5000 – Bicycles |
| Assault Police | Theft Over $5000 – From Motor Vehicles |
| Assaults – Other Peace or Public Officer | Theft Over $5000 – Other |
| Assaults – Other | Theft Over $5000 – Load |
| Sexual Offences (Not Assaults) | Theft Under $5000 – Bicycles |
| Robbery – Firearms | Theft Under $5000 – From Motor Vehicles |
| Robbery – Other Offensive Weapons | Theft Under $5000 – Other |
| Robbery – Other Robbery | Mischief (Property Damage) Over $5000 |
| Utter Threats to Person | Mischief (Property Damage) $5000 and Under |
Appendix G: Assumptions Made When Linking OPP Duty Codes to UCR Codes
Robbery:
OPP duty codes 356 (Robbery –Firearm), 358 (Robbery – Other offensive weapons), and 360 (Robbery – Other robbery) were combined and linked to UCR code 1610 (Robbery – Master code) since UCR codes do not have the same differentiation within robbery offences as OPP duty codes.
Utter Threats to Person:
OPP duty codes have only a single code for threats for person (363) but UCR codes have variations in threats (threatening/indecent phone calls, utter threats to animals, utter threats to property). OPP threats to person were linked to UCR code 1627 Utter Threats – Master code as it was the most inclusive. However, due to this assumption, cost per utter threats offences may not be exact.
Break and Enter:
OPP duty codes 371 (Break and Enter – Business premises), 373 (Break and Enter – Residence), and 375 (Break and Enter – Other) do not match up directly to UCR codes 2120 (Break and Enter), 2121 (Break and Enter - Firearm), and 2125 (Break and Enter - Steal firearm from motor vehicle). OPP duty codes for Break and Enter were summed and included under 2120 UCR code which is the most inclusive. Due to this assumption, it is possible the cost of Break and Enter UCR code made be marginally over representative of the offence type.
Mischief:
For 2009, the link between OPP duty codes 532 (Mischief - property damage over $5000) and 534 (Mischief - property damage equal to or under $5000) was clear to map to similar UCR codes 2172 and 2174. However, in subsequent years, the frequency of the two individual codes were not given for UCR coding, therefore OPP duty codes for both mischief offences were summed and placed under UCR code Mischief – Master code.
Fail to Remain:
The OPP duty code 730 (Fail to Stop) is the only PP duty code for that type of offence, but UCR codes comprise many types of Fail to Stop, including 9311 (Fail to Stop – Causing death), 9312 (Fail to Stop – Causing bodily harm), 9313 (Fail to Stop or Remain). Since the more inclusive OPP duty code could not be divided into these separate codes (the information regarding which offence out of the number of occurrences belonged to which specific UCR code was not known), it was linked to UCR code 9310 (Fail to Stop or Remain – Master code).
Appendix H: OPP Cost per UCR Offence for 2009 to 2013
| UCR Code | Occurrence Type | Total Cost of UCR Crime | Cost Per UCR Crime |
|---|---|---|---|
| 1110 | Murder 1st Degree | $11,297,304.06 | $706,081.50 |
| 1120 | Murder 2nd Degree | $1,451,087.99 | $362,772.00 |
| 1130 | Manslaughter | $144,363.71 | $144,363.71 |
| 1210 | Attempted Murder | $1,250,037.35 | $48,078.36 |
| 1310 | Aggravated Sexual Assault | $57,662.85 | $11,532.57 |
| 1320 | Sexual Assault with a Weapon | $241,270.19 | $7,311.22 |
| 1330 | Sexual Assault | $5,204,852.84 | $2,547.65 |
| 1410 | Aggravated Assault Level 3 | $1,001,524.56 | $5,789.16 |
| 1420 | Assault w/Weapon or Causing Bodily Harm Level 2 | $2,029,931.87 | $926.49 |
| 1430 | Assault | $6,159,322.34 | $508.70 |
| 1440 | Unlawfully Causing Bodily Harm | $43,663.11 | $2,079.20 |
| 1450 | Discharge Firearm with Intent | $40,803.84 | $2,266.88 |
| 1530 | Abduction Under 14 | $1,081,429.44 | $60,079.41 |
| 1540 | Abduction Under 16 | $20,320.38 | $2,540.05 |
| 1610 | Robbery | $1,931,862.40* | $6,461.08* |
| 1625 | Criminal Harassment | $1,325,692.66 | $488.28 |
| 1627 | Utter Threats to Person | $1,508,550.77* | $251.13* |
| 2120 | Break and Enter | $5,736,685.93* | $492.38* |
| 2132 | Theft From a Motor Vehicle Over $5000 | $68,294.80 | $704.07 |
| 2133 | Theft Over $5000 - Shoplifting | $26,334.16 | $1,881.01 |
| 2142 | Theft $5000 or Under From a Motor Vehicle | $655,500.04 | $87.76 |
| 2143 | Shoplifting $5000 or Under | $452,502.52 | $327.43 |
| 2150 | Possession of Stolen Goods – Master Code | $1,150,748.31 | $464.57 |
| 2172 | Mischief Over $5000 | $235,704.20 | $1,288.00 |
| 2173 | Mischief $5000 or Under | $2,126,121.38 | $244.33 |
| 3110 | Prostitution – Bawdy House | $15,721.25 | $5,240.42 |
| 3130 | Prostitution – Other | $6,255.57 | $430.93 |
| 3310 | Offensive Weapons - Explosives | $69,708.17 | $1,991.66 |
| 3410 | Failure to Comply with Conditions | $2,631,730.41 | $335.64 |
| 3420 | Counterfeiting Currency | $55,660.18 | $56.97 |
| 3430 | Disturb the Peace | $596,214.43 | $167.15 |
| 3440 | Escape Custody | $54,477.20 | $656.35 |
| 3450 | Indecent Acts | $105,155.82 | $254.00 |
| 3455 | Production/Distribution of Child Pornography | $30,873.80 | $263.88 |
| 3460 | Public Morals | $87,973.17 | $988.46 |
| 3470 | Obstruct Public Peace Officer | $189,831.60 | $192.53 |
| 3480 | Prisoner Unlawfully at Large | $2,026,735.91 | $2,249.43 |
| 3490 | Trespass at Night | $71,022.50 | $117.01 |
| 3825 | Proceeds of Crime | $300,928.93 | $12,037.16 |
| 4110 | Possession - Heroin | $3,344.93 | $304.08 |
| 4120 | Possession - Cocaine | $119,507.99 | $385.51 |
| 4140 | Possession - Cannabis | $760,577.65 | $172.19 |
| 4210 | Trafficking - Heroin | $2,259.37 | $282.42 |
| 4220 | Trafficking - Cocaine | $1,512,387.54 | $5,075.13 |
| 4240 | Trafficking - Cannabis | $1,239,615.11 | $1,347.41 |
| 4440 | Production - Cannabis | $2,255,658.13 | $5,370.61 |
| 6200 | Canada Shipping Act | $105,146.12 | $157.40 |
| 6300 | Customs Act | $10,014.71 | $1,112.75 |
| 6400 | Excise Act | $53,339.54 | $282.22 |
| 6450 | Youth Criminal Justice Act | $29,964.29 | $16.36 |
| 6500 | Immigration Act | $17,174.35 | $613.37 |
| 6900 | Other Federal Statutes | $256,149.42 | $192.02 |
| 9240 | Fail to Provide Breath Sample | $52,029.77 | $80.54 |
| 9310 | Fail to Stop or Remain – Master Code | $242,918.56* | $804.37* |
Note. Costs are investigative policing costs by salary including over time salary expenditures.
*Denotes offences where OPP duty code and UCR codes did not match up exactly, therefore cost estimate may be an imprecise reflection of cost of UCR code offence.
| UCR Code | Occurrence Type | Total Cost of UCR Crime | Cost Per UCR Crime |
|---|---|---|---|
| 1110 | Murder 1st Degree | $13,321,250.27 | $634,345.25 |
| 1120 | Murder 2nd Degree | $2,207,650.34 | $110,382.52 |
| 1130 | Manslaughter | $218,509.65 | $54,627.41 |
| 1210 | Attempted Murder | $1,014,371.55 | $48,303.41 |
| 1310 | Aggravated Sexual Assault | $75,334.96 | $5,381.07 |
| 1320 | Sexual Assault with a Weapon | $159,123.91 | $6,630.16 |
| 1330 | Sexual Assault | $5,595,808.77 | $2,591.85 |
| 1410 | Aggravated Assault Level 3 | $1,056,359.13 | $6,480.73 |
| 1420 | Assault w/Weapon or Causing Bodily Harm Level 2 | $1,948,485.86 | $1,012.20 |
| 1430 | Assault | $6,232,533.49 | $508.90 |
| 1440 | Unlawfully Causing Bodily Harm | $16,589.65 | $1,508.15 |
| 1450 | Discharge Firearm with Intent | $32,680.26 | $2,042.52 |
| 1530 | Abduction Under 14 | $165,827.83 | $6,141.77 |
| 1540 | Abduction Under 16 | $32,621.13 | $16,310.57 |
| 1610 | Robbery | $1,814,830.48* | $5,779.71* |
| 1625 | Criminal Harassment | $1,421,311.31 | $465.24 |
| 1627 | Utter Threats to Person | $1,606,634.06* | $273.61* |
| 2120 | Break and Enter | $5,732,928.90* | $518.11* |
| 2132 | Theft From a Motor Vehicle Over $5000 | $72,107.35 | $828.82 |
| 2133 | Theft Over $5000 - Shoplifting | $34,184.18 | $1,486.27 |
| 2142 | Theft $5000 or Under From a Motor Vehicle | $649,825.46 | $90.15 |
| 2143 | Shoplifting $5000 or Under | $509,971.05 | $213.56 |
| 2150 | Possession of Stolen Goods – Master Code | $1,088,091.43 | $466.59 |
| 2170 | Mischief – Master Code | $2,336,567.75* | $122.65* |
| 3110 | Prostitution – Bawdy House | $19,365.18 | $4,841.29 |
| 3130 | Prostitution – Other | $8,969.12 | $896.91 |
| 3310 | Offensive Weapons - Explosives | $69,708.17 | $1,991.66 |
| 3410 | Failure to Comply with Conditions | $3,364,749.46 | $428.41 |
| 3420 | Counterfeiting Currency | $78,668.02 | $88.29 |
| 3430 | Disturb the Peace | $637,176.16 | $179.23 |
| 3440 | Escape Custody | $73,697.60 | $887.92 |
| 3450 | Indecent Acts | $91,764.14 | $219.01 |
| 3455 | Production/Distribution of Child Pornography | $155,164.53 | $1,166.65 |
| 3460 | Public Morals | $52,410.33 | $1,069.60 |
| 3470 | Obstruct Public Peace Officer | $205,104.50 | $200.89 |
| 3480 | Prisoner Unlawfully at Large | $1,740,683.65 | $1,962.44 |
| 3490 | Trespass at Night | $77,875.58 | $129.15 |
| 3825 | Proceeds of Crime | $277,581.79 | $19,827.27 |
| 4110 | Possession - Heroin | $4,825.58 | $268.09 |
| 4120 | Possession - Cocaine | $127,520.74 | $344.65 |
| 4140 | Possession - Cannabis | $826,199.85 | $161.15 |
| 4210 | Trafficking - Heroin | $4,625.90 | $462.59 |
| 4220 | Trafficking - Cocaine | $1,315,545.23 | $4,444.41 |
| 4240 | Trafficking - Cannabis | $1,186,780.74 | $1,237.52 |
| 4440 | Production - Cannabis | $2,201,027.68 | $4,624.01 |
| 6200 | Canada Shipping Act | $89,557.95 | $117.68 |
| 6300 | Customs Act | $8,946.89 | $4,473.44 |
| 6400 | Excise Act | $153,457.70 | $691.25 |
| 6450 | Youth Criminal Justice Act | $12,100.32 | $7.33 |
| 6500 | Immigration Act | $20,173.75 | $960.65 |
| 6900 | Other Federal Statutes | $355,410.76 | $460.97 |
| 9240 | Fail to Provide Breath Sample | $56,154.91 | $88.71 |
| 9310 | Fail to Stop or Remain – Master Code | $226,357.98* | $808.42* |
Note. Costs are investigative policing costs by salary including over time salary expenditures.
*Denotes offences where OPP duty code and UCR codes did not match up exactly, therefore cost estimate may be an imprecise reflection of cost of UCR code offence.
| UCR Code | Occurrence Type | Total Cost of UCR Crime | Cost Per UCR Crime |
|---|---|---|---|
| 1110 | Murder 1st Degree | $10,577,546.26 | $705,169.75 |
| 1120 | Murder 2nd Degree | $1,444,410.52 | $160,490.06 |
| 1130 | Manslaughter | $196,599.57 | $65,533.19 |
| 1210 | Attempted Murder | $1,168,684.77 | $50,812.38 |
| 1310 | Aggravated Sexual Assault | $71,484.64 | $4,765.64 |
| 1320 | Sexual Assault with a Weapon | $152,527.82 | $6,933.08 |
| 1330 | Sexual Assault | $6,453,026.57 | $2,842.74 |
| 1410 | Aggravated Assault Level 3 | $892,707.67 | $5,251.22 |
| 1420 | Assault w/Weapon or Causing Bodily Harm Level 2 | $1,948,279.60 | $1,012.62 |
| 1430 | Assault | $6,737,817.08 | $554.32 |
| 1440 | Unlawfully Causing Bodily Harm | $13,617.65 | $648.46 |
| 1450 | Discharge Firearm with Intent | $58,667.17 | $2,346.69 |
| 1530 | Abduction Under 14 | $107,584.14 | $4,890.19 |
| 1540 | Abduction Under 16 | $8,530.78 | $1,218.68 |
| 1610 | Robbery | $1,863,824.66* | $6,212.75* |
| 1625 | Criminal Harassment | $1,520,219.69 | $460.39 |
| 1627 | Utter Threats to Person | $1,679,609.60* | $288.59* |
| 2120 | Break and Enter | $6,332,723.19* | $600.26* |
| 2132 | Theft From a Motor Vehicle Over $5000 | $78,387.07 | $922.20 |
| 2133 | Theft Over $5000 - Shoplifting | $21,007.21 | $1,167.07 |
| 2142 | Theft $5000 or Under From a Motor Vehicle | $644,236.90 | $106.38 |
| 2143 | Shoplifting $5000 or Under | $493,492.51 | $240.14 |
| 2150 | Possession of Stolen Goods – Master Code | $1,166,487.92 | $546.88 |
| 2170 | Mischief – Master Code | $2,223,849.95* | $128.26 |
| 3110 | Prostitution – Bawdy House | $16,770.40 | $16,770.40 |
| 3130 | Prostitution – Other | $9,722.46 | $648.16 |
| 3310 | Offensive Weapons - Explosives | $49,471.32 | $1,075.46 |
| 3410 | Failure to Comply with Conditions | $3,163,446.24 | $411.48 |
| 3420 | Counterfeiting Currency | $40,980.93 | $61.17 |
| 3430 | Disturb the Peace | $597,188.40 | $186.50 |
| 3440 | Escape Custody | $31,707.00 | $634.14 |
| 3450 | Indecent Acts | $172,020.49 | $386.56 |
| 3455 | Production/Distribution of Child Pornography | $259,240.87 | $1,448.27 |
| 3460 | Public Morals | $57,137.62 | $1,098.80 |
| 3470 | Obstruct Public Peace Officer | $250,490.11 | $247.28 |
| 3480 | Prisoner Unlawfully at Large | $218,309.70 | $272.21 |
| 3490 | Trespass at Night | $83,575.69 | $141.18 |
| 4110 | Possession - Heroin | $5,920.99 | $740.12 |
| 4120 | Possession - Cocaine | $127,769.29 | $354.91 |
| 4140 | Possession - Cannabis | $929,139.33 | $170.11 |
| 4210 | Trafficking - Heroin | $9,026.34 | $1,128.29 |
| 4220 | Trafficking - Cocaine | $1,275,121.87 | $4,474.11 |
| 4240 | Trafficking - Cannabis | $1,136,079.22 | $1,213.76 |
| 4440 | Production - Cannabis | $1,736,829.74 | $3,129.42 |
| 6200 | Canada Shipping Act | $102,670.75 | $145.84 |
| 6300 | Customs Act | $7,439.08 | $826.56 |
| 6400 | Excise Act | $137,944.51 | $2,873.84 |
| 6450 | Youth Criminal Justice Act | $9,961.95 | $6.89 |
| 6500 | Immigration Act | $21,533.93 | $897.25 |
| 6900 | Other Federal Statutes | $291,897.45 | $213.84 |
| 9240 | Fail to Provide Breath Sample | $66,663.61 | $110.37 |
| 9310 | Fail to Stop or Remain – Master Code | $250,796.63* | $1,139.98* |
Note. Costs are investigative policing costs by salary including over time salary expenditures.
*Denotes offences where OPP duty code and UCR codes did not match up exactly, therefore cost estimate may be an imprecise reflection of cost of UCR code offence.
| UCR Code | Occurrence Type | Total Cost of UCR Crime | Cost Per UCR Crime |
|---|---|---|---|
| 1110 | Murder 1st Degree | $8,832,555.67 | $441,627.78 |
| 1120 | Murder 2nd Degree | $1,431,042.08 | $102,217.29 |
| 1130 | Manslaughter | $78,662.45 | $19,665.61 |
| 1210 | Attempted Murder | $2,054,286.96 | $76,084.70 |
| 1310 | Aggravated Sexual Assault | $76,638.40 | $6,967.13 |
| 1320 | Sexual Assault with a Weapon | $169,402.78 | $4,235.07 |
| 1330 | Sexual Assault | $6,363,654.17 | $2,809.56 |
| 1410 | Aggravated Assault Level 3 | $884,179.58 | $6,226.62 |
| 1420 | Assault w/Weapon or Causing Bodily Harm Level 2 | $1,975,040.06 | $990.99 |
| 1430 | Assault | $6,630,651.67 | $551.22 |
| 1440 | Unlawfully Causing Bodily Harm | $13,013.41 | $1,859.06 |
| 1450 | Discharge Firearm with Intent | $56,891.22 | $2,031.83 |
| 1530 | Abduction Under 14 | $65,479.10 | $4,365.27 |
| 1540 | Abduction Under 16 | $7,650.90 | $1,530.18 |
| 1610 | Robbery | $1,804,651.37* | $6,076.27 |
| 1625 | Criminal Harassment | $1,683,380.68 | $465.79 |
| 1627 | Utter Threats to Person | $1,673,599.82 | $296.21* |
| 2120 | Break and Enter | $6,050,937.46* | $599.58* |
| 2132 | Theft From a Motor Vehicle Over $5000 | $73,766.03 | $983.55 |
| 2133 | Theft Over $5000 - Shoplifting | $22,776.40 | $2,070.58 |
| 2142 | Theft $5000 or Under From a Motor Vehicle | $610,149.39 | $104.25 |
| 2143 | Shoplifting $5000 or Under | $468,152.22 | $234.43 |
| 2150 | Possession of Stolen Goods – Master Code | $1,017,959.46 | $692.02 |
| 2170 | Mischief – Master Code | $2,285,589.15* | $134.74* |
| 3110 | Prostitution – Bawdy House | $1,055.55 | $1,055.55 |
| 3130 | Prostitution – Other | $653.66 | $653.66 |
| 3310 | Offensive Weapons - Explosives | $51,409.80 | $2,142.08 |
| 3410 | Failure to Comply with Conditions | $3,209,280.18 | $440.59 |
| 3420 | Counterfeiting Currency | $59,927.15 | $113.07 |
| 3430 | Disturb the Peace | $646,567.72 | $180.96 |
| 3440 | Escape Custody | $40,219.34 | $773.45 |
| 3450 | Indecent Acts | $164,836.51 | $355.25 |
| 3455 | Production/Distribution of Child Pornography | $282,755.45 | $1,553.60 |
| 3460 | Public Morals | $43,486.10 | $1,115.03 |
| 3470 | Obstruct Public Peace Officer | $236,980.59 | $231.43 |
| 3480 | Prisoner Unlawfully at Large | $120,401.60 | $147.01 |
| 3490 | Trespass at Night | $84,990.61 | $142.84 |
| 4110 | Possession - Heroin | $4,169.70 | $463.30 |
| 4120 | Possession - Cocaine | $119,094.55 | $328.99 |
| 4140 | Possession - Cannabis | $774,067.44 | $151.10 |
| 4210 | Trafficking - Heroin | $38,917.50 | $3,537.95 |
| 4220 | Trafficking - Cocaine | $1,234,540.87 | $4,331.72 |
| 4240 | Trafficking - Cannabis | $972,110.02 | $1,259.21 |
| 4440 | Production - Cannabis | $1,259,086.14 | $2,067.46 |
| 6200 | Canada Shipping Act | $80,731.65 | $105.12 |
| 6300 | Customs Act | $5,747.45 | $957.91 |
| 6400 | Excise Act | $33,364.28 | $695.09 |
| 6450 | Youth Criminal Justice Act | $10,064.29 | $7.65 |
| 6500 | Immigration Act | $22,557.15 | $902.29 |
| 6900 | Other Federal Statutes | $227,649.06 | $180.53 |
| 9240 | Fail to Provide Breath Sample | $61,428.30 | $100.54 |
| 9310 | Fail to Stop or Remain – Master Code | $262,883.37* | $879.21* |
Note. Costs are investigative policing costs by salary including over time salary expenditures.
*Denotes offences where OPP duty code and UCR codes did not match up exactly, therefore cost estimate may be an imprecise reflection of cost of UCR code offence.
| UCR Code | Occurrence Type | Total Cost of UCR Crime | Cost Per UCR Crime |
|---|---|---|---|
| 1110 | Murder 1st Degree | $7,980,763.44 | $997,595.43 |
| 1120 | Murder 2nd Degree | $1,717,206.24 | $245,315.18 |
| 1130 | Manslaughter | $50,225.15 | $25,112.58 |
| 1210 | Attempted Murder | $984,036.83 | $54,668.71 |
| 1310 | Aggravated Sexual Assault | $66,099.90 | $11,016.65 |
| 1320 | Sexual Assault with a Weapon | $173,774.18 | $6,206.22 |
| 1330 | Sexual Assault | $5,979,281.14 | $2,807.17 |
| 1410 | Aggravated Assault Level 3 | $996,247.16 | $6,686.22 |
| 1420 | Assault w/Weapon or Causing Bodily Harm Level 2 | $1,856,065.66 | $1,135.21 |
| 1430 | Assault | $6,024,173.97 | $575.54 |
| 1440 | Unlawfully Causing Bodily Harm | $9,052.80 | $2,263.20 |
| 1450 | Discharge Firearm with Intent | $53,971.32 | $2,570.06 |
| 1530 | Abduction Under 14 | $73,638.84 | $3,506.61 |
| 1540 | Abduction Under 16 | $8,448.56 | $4,224.28 |
| 1610 | Robbery | $1,621,393.96* | $7,612.18* |
| 1625 | Criminal Harassment | $1,650,126.76 | $529.06 |
| 1627 | Utter Threats to Person | $1,562,980.25* | $308.22* |
| 2120 | Break and Enter | $5,629,118.60* | $670.53* |
| 2132 | Theft From a Motor Vehicle Over $5000 | $71,868.79 | $958.25 |
| 2133 | Theft Over $5000 - Shoplifting | $16,317.60 | $2,039.70 |
| 2142 | Theft $5000 or Under From a Motor Vehicle | $532,863.88 | $114.97 |
| 2143 | Shoplifting $5000 or Under | $462,155.34 | $252.41 |
| 2150 | Possession of Stolen Goods – Master Code | $786,879.82 | $12,295.00 |
| 2170 | Mischief – Master Code | $2,162,782.47* | $145.45* |
| 3110 | Prostitution – Bawdy House | $3,061.80 | $765.45 |
| 3130 | Prostitution – Other | $10,431.50 | $695.43 |
| 3310 | Offensive Weapons - Explosives | $44,747.76 | $2,485.99 |
| 3410 | Failure to Comply with Conditions | $2,871,370.68 | $465.38 |
| 3420 | Counterfeiting Currency | $85,467.89 | $129.69 |
| 3430 | Disturb the Peace | $551,848.83 | $187.83 |
| 3440 | Escape Custody | $35,791.75 | $872.97 |
| 3450 | Indecent Acts | $154,635.77 | $414.57 |
| 3455 | Production/Distribution of Child Pornography | $441,710.42 | $2,016.94 |
| 3460 | Public Morals | $36,226.32 | $1,065.48 |
| 3470 | Obstruct Public Peace Officer | $266,562.86 | $282.68 |
| 3480 | Prisoner Unlawfully at Large | $44,601.95 | $63.90 |
| 3490 | Trespass at Night | $76,180.85 | $149.37 |
| 4110 | Possession - Heroin | $6,877.05 | $529.00 |
| 4120 | Possession - Cocaine | $123,059.97 | $304.60 |
| 4140 | Possession - Cannabis | $758,709.85 | $150.12 |
| 4210 | Trafficking - Heroin | $17,583.30 | $2,511.90 |
| 4220 | Trafficking - Cocaine | $1,594,803.00 | $5,333.79 |
| 4240 | Trafficking - Cannabis | $855,101.00 | $1,185.99 |
| 4440 | Production - Cannabis | $1,390,727.14 | $2,317.88 |
| 6200 | Canada Shipping Act | $58,996.70 | $98.00 |
| 6300 | Customs Act | $6,083.58 | $675.95 |
| 6400 | Excise Act | $13,417.15 | $419.29 |
| 6450 | Youth Criminal Justice Act | $6,300.14 | $5.53 |
| 6500 | Immigration Act | $19,303.60 | $1,135.51 |
| 6900 | Other Federal Statutes | $130,819.99 | $258.03 |
| 9240 | Fail to Provide Breath Sample | $56,795.15 | $109.86 |
| 9310 | Fail to Stop or Remain – Master Code | $292,744.34* | $824.63* |
Note. Costs are investigative policing costs by salary including over time salary expenditures.
*Denotes offences where OPP duty code and UCR codes did not match up exactly, therefore cost estimate may be an imprecise reflection of cost of UCR code offence.
Footnotes
- 1
Measured using the Crime Severity Index (CSI).
- 2
Derived in part from discussions with WRPS.
- 3
Civilian costs are included in the OPP data, not the WRPS data.
- 4
A range of percentages was chosen through discussions with the OPP and the RSD from the Department of Justice Canada.
- 5
Specifically defined by the OPP as Criminal Code and provincial statute charges laid.
- 6
This was not available for the current pilot project.
- Date modified: